19690 N Hwy 99 #27 · Lodi, CA
Flood risk No data
- FEMA flood zone
- —
- Chance of flooding over 30 yrs
- —
- Est. flood insurance / yr
- —
Fire risk No data
- Est. fire insurance / yr
- —
Heat risk No data
- Hot days now (above threshold)
- —
- Hot days in 30 yrs
- —
Wind risk No data
- Chance of severe wind over 30 yrs
- —
Air-quality risk No data
- Unhealthy air days now
- —
- Unhealthy air days in 30 yrs
- —
Risk factors via First Street. Map © Google.
Why this score? — see what drove the C+ grade
The composite is a weighted blend of 9 inputs, each scored 0–100. Each bar is that input's sub-score; the figure is the points it added to the 100-point composite (weight × sub-score).
- Cash flow +30.0/30.0
- 1% rule +10.0/10.0
- DSCR +10.0/10.0
- Livability +2.9/5.0
- Schools +2.7/10.0
- Rent growth +2.5/5.0
- Condition / age +2.5/5.0
- ARV discount +1.3/15.0
- Appreciation +0.0/10.0
$145,000
🖨 Deal sheet (PDF) 📄 Offer letter ✓ Due diligence
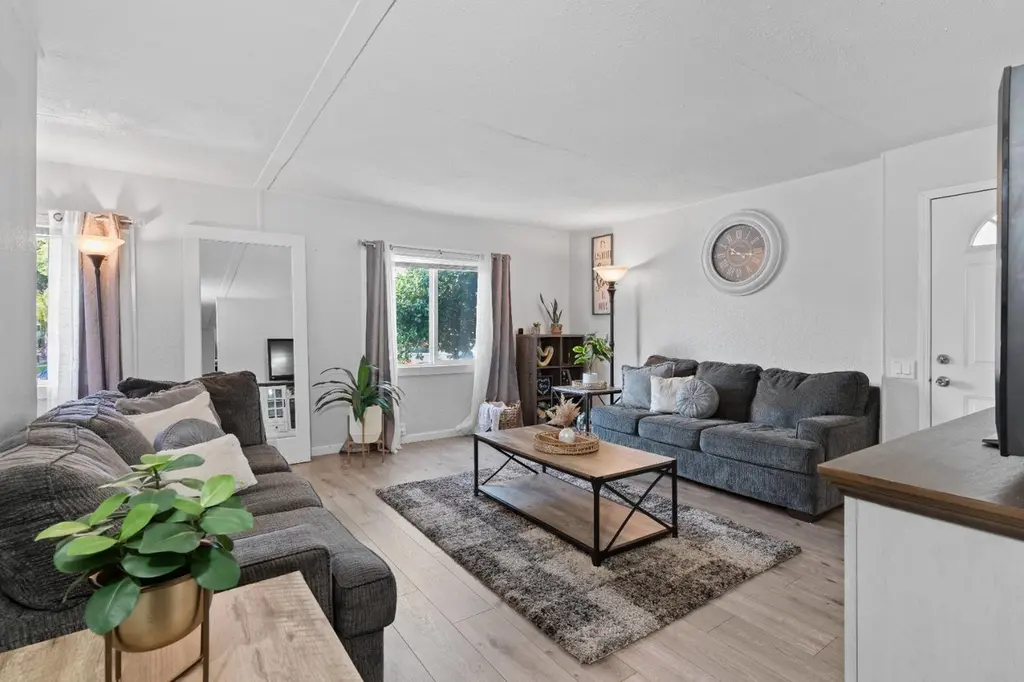
Listing remarks
Welcome to this beautifully updated spacious home in Arbor Mobile Home Park an all ages community. Featuring a large living room, roomy kitchen and covered patio. Flooring is hardwood all throughout the home with new central heating/cooling that was replaced last year. Includes gas stove, built-in oven, and carport for two cars. Located around the corner from the community clubhouse, pool, basketball court, and guest parking. Easy access to Hwy 99.
Key facts
- Hardwood flooring
- Roomy kitchen
- Large living room
Tags
Neighborhood map
What this means for you Summary
Snapshot
- This is a 3-bed/2.0-bath manufactured listed at $145k.
Deal economics
- At list price, monthly cash flow is $776 ($9k/yr) — positive.
- The deal already cash-flows at list — no discount required.
- Meets the 1% rule at list price ($2k rent vs $145k).
- Recommended offer: $132k (9.0% below list) — sets the bar for market timing.
- Cap rate 12.7% vs local median 2.9% in Lodi — top-decile yield for the area; either an underpriced asset or a hidden risk that comps aren't pricing in. Stress-test before assuming the spread holds.
Location & tenants
- Location reads 58/100 on livability (#730 in CA) — a working-class tenant base; expect higher turnover. Strengths: housing A; Watch: schools C-, crime F, amenities F.
- Lodi Unified (urban): math 24% / reading 36% proficiency, ranked #325 of 517 in CA (top 63%) — families likely to look elsewhere, expect single-tenant / working-renter base with shorter leases.
- Market conditions: 38 active listings in the ZIP; 2 comparable units currently listed for rent nearby; 3,779 units permitted in San Joaquin County in 2024 (0 in 5+ unit buildings).
Forward outlook
- Local home prices are declining (-3.0%/yr); year-one equity from $1k of loan paydown is wiped out by about $4k of value loss. Plan a longer hold.
- San Joaquin County population projected at +17% by 2050 — long-run rental-demand tailwind backs the buy-and-hold thesis.
- At projected returns (-3.0% appreciation + 3.0% rent growth), your $41k cash investment doubles in ~6 years — after that, you're playing with house money.
Negotiation context
- It's been on market 105 days — a 9% lower offer ($132k) is reasonable based on typical stale-listing flexibility.
Questions for the listing agent
- It's been on market 105 days. Have you received any prior offers? Is the seller open to a 9% concession, seller financing, or rate buy-down credit?
- Built in 1972 — when were the roof, HVAC, electrical panel, plumbing, and water heater last replaced?
- Why hasn't it sold? Are there any deal-killer items the seller is aware of (foundation, flood, title, zoning, code violations)?
- Is there a deadline driving the sale (1031 exchange, divorce, estate, relocation)? That informs how much negotiation room exists.
- Crime grade is F in this area — have there been break-ins, vandalism, or insurance claims at this property in the last 3 years? What carrier currently insures it and at what premium?
- What's the average days-on-market for RENTAL listings here right now (not sales)? A rising rental-DOM trend means longer vacancies and softer asking-rent achievability than the comps imply.
- What's the recent tenant-quality profile in this submarket — average credit score on applications, eviction rate, late-payment / NSF rate, and stable-employment percentage? A property-management company in the area should have these aggregated.
- How much new for-sale + rental construction is in the pipeline within 1–3 miles? Heavy new supply typically softens prices + rents 12–24 months out; constrained supply supports both.
Investment metrics
- 1% rule
- 1.55% ✓
- Cap rate
- 12.71%
- Cash-on-cash
- 22.93%
- DSCR
- 2.02
- GRM
- 5.4
CMA / ARV
- ARV (median comp)
- $127,500
- List price
- $145,000
- Delta
- 13.73%
- Verdict
- OVERPRICED
- Comps
- 8 within 1.0 mi
Show comp detail 12 sales within ~0.75 mi
| Address | Dist | Beds/Ba | Sqft | Sold | Price | $/sf | Match |
|---|---|---|---|---|---|---|---|
| 19690 N Hwy 99 #27 | 0.00mi | 3/2.0 | 1,440 (0%) | 0mo | $130,000 | $90 | 100 |
| 19690 Highway 99 #147 | 0.06mi | 3/2.0 | 1,440 (0%) | 14mo | $110,000 | $76 | 86 |
| 19690 N Highway 99 #26 | 0.06mi | 3/2.0 | 1,536 (+7%) | 3mo | $140,000 | $91 | 84 |
| 19690 N Highway 99 #8 | 0.12mi | 3/2.0 | 1,344 (-7%) | 0mo | $145,000 | $108 | 83 |
| 19690 N Hwy 99 #89 | 0.06mi | 2/2.0 (-1) | 1,439 (-0%) | 14mo | $100,000 | $69 | 80 |
| 19690 N Hwy 99 #110 | 0.11mi | 2/2.0 (-1) | 1,536 (+7%) | 2mo | $124,000 | $81 | 77 |
| 19690 N Hwy 99 #143 | 0.06mi | 3/2.0 | 1,344 (-7%) | 13mo | $130,000 | $97 | 76 |
| 19690 N Highway 99 #170 | 0.07mi | 2/2.0 (-1) | 1,440 (0%) | 24mo | $100,000 | $69 | 72 |
| 19690 N Hwy 99 #39 | 0.00mi | 3/2.0 | 1,344 (-7%) | 24mo | $181,000 | $135 | 69 |
| 19690 N Highway 99 #55 | 0.06mi | 3/2.0 | 1,608 (+12%) | 15mo | $176,000 | $109 | 66 |
| 19690 N Highway 99 #44 | 0.00mi | 3/2.0 | 1,228 (-15%) | 22mo | $164,900 | $134 | 57 |
| 19690 N Hwy 99 #3 | 0.06mi | 2/2.0 (-1) | 1,248 (-13%) | 21mo | $55,000 | $44 | 53 |
Match score weights: distance 35% · size 25% · config 20% · recency 20%. Top-matched comps best support the ARV.
Projected returns pro-forma
-3.0% appreciation · 3.0% rent growth · sell at horizon
- IRR
- 15.9%
- Equity multiple
- 1.64×
- Total profit
- $25,949
- Equity at exit
- $21,620
- IRR
- 24.5%
- Equity multiple
- 3.13×
- Total profit
- $86,359
- Equity at exit
- $12,537
Cash invested: $40,600 (down + closing). Projections, not guarantees.
Landlord ↔ Tenant lean methodology
- Overall (STATE)
- 18 Strongly Tenant-Friendly
- State California
- 18 Strongly Tenant-Friendly · D+13
- County
- — inherits STATE
- City
- — inherits STATE
ZIP-level market 95220
- Active inventory
- 38
- Price-to-rent
- 5.4×
Monthly cashflow live
- Estimated rent
- $2,250 medium interval (Pro) →
- Mortgage (P&I)
- −$760
- Tax est. 1.5%
- −$181 /mo · $2,175/yr
- Insurance
- −$60
- HOA
- −$0
- Vacancy / Maint / Mgmt
- −$473
- Net cashflow
- $776
Break-even live
Sensitivity live
| Price | -10% $876 | -5% $826 | +0% $776 | +5% $726 | +10% $676 |
|---|---|---|---|---|---|
| Rent | -10% $598 | -5% $687 | +0% $776 | +5% $865 | +10% $954 |
| Rate | -1.0pp $849 | -0.5pp $813 | base $776 | +0.5pp $738 | +1.0pp $700 |
UW: 25.0% down · 7.5% · 30yr · 1.5% tax · 5.0% vac · 8.0% maint · 8.0% mgmt
Financing live
Cash to close
- Down payment
- $36,250
- Closing costs
- $4,350
- Reserves months
- —
- Total cash needed
- —
Loan-product check · same deal, 3 products live
Conventional
25% down · 7.5% · 30yr
- Down + closing
- —
- Monthly P&I
- —
- Monthly cashflow
- —
- DSCR
- —
- Eligible?
- —
Personal DTI + credit; lowest rate.
DSCR
20% down · 8.5% · 30yr
- Down + closing
- —
- Monthly P&I
- —
- Monthly cashflow
- —
- DSCR
- —
- Eligible?
- —
No personal income docs; deal must DSCR.
Hard money
10% down · 12.0% · 12mo
- Down + closing
- —
- Monthly P&I
- —
- Monthly cashflow
- —
- DSCR
- —
- Eligible?
- —
Short-term bridge; refi at stabilization.
Rent comps 2 comps
| Address | Beds | Baths | Sqft | Rent | $/sqft | DOM | Units | Dist |
|---|---|---|---|---|---|---|---|---|
| 500 Sonora Ave Lodi, CA | 3.0 | 1.0 | 1032 | $2,149 | $2.08 | 4d | 1 | 1.39mi |
| 15 Forrest Ave Lodi, CA | 3.0 | 2.0 | 1100 | $2,350 | $2.14 | 45d | 1 | 1.45mi |
Nearby sold comps map
Loading sold comps map…
Walkable amenities ~0.75 mi
Loading nearby amenities…
Taxation est. · year 1
- Rental income
- $27,006
- − Mortgage interest
- −$8,122
- − Property taxes
- −$2,175
- − Insurance
- −$725
- − Repairs & maintenance
- −$2,160
- − Management
- −$2,160
- − Depreciation
- −$4,218
- Taxable income
- $7,444
- Est. tax owed @ 24.0%
- −$1,787
- After-tax cash flow
- $7,523/yr
For passive investors: Depreciation is non-cash, so a rental often shows a tax loss while cash-flowing — sheltering income. Rental losses are passive: they offset passive income freely, and up to $25,000/yr can offset ordinary (W-2) income if you actively participate and your MAGI is under $100k (phasing out to $0 by $150k); unused losses carry forward. On sale, claimed depreciation is recaptured at up to 25%, and gains may owe capital-gains tax (a 1031 exchange can defer both). Figures are a year-1 estimate at your 24.0% rate — not tax advice; consult a CPA.
Schools (NCES district)
- District
- Lodi Unified
- NCES district ID
- 0622230
- Math proficiency
- 24% ▼ -8.00%
- Reading proficiency
- 36% ▼ -8.00%
- Median HH income
- $57,165
- Composite
- 26.84/100
- National rank
- #7108
- State rank
- #325 of 517 in CA
Livability — Lodi
- Score
- 58/100
- State rank
- #730
- US rank
- #21523
Category grades
Schools grade is shown separately in the Schools card above.
Census & demographics
- City population
- 78,944
- Population (ZIP)
- 7,958
Population outlook (San Joaquin County) Hauer SSP2
- Today (2025)
- 796,965 people
- By 2030
- 828,849 · +4.0%
- By 2040
- 885,611 · +11.1%
- By 2050
- 929,798 · +16.7%
- By 2075
- 994,578 · +24.8%
- By 2100
- 971,291 · +21.9%
Race, ethnicity, and origin ACS 2023
- Neighborhood character
- Majority White (62%)
- Race & ethnicity
- White 62% Hispanic / Latino 34% Two or more races 22% Asian 2%
- Hispanic origin (detail)
- Mexican 31%
- Common ancestry
- Russian 4% Lithuanian 3% Italian 2%
- Foreign-born
- 14% · Canada
- Languages at home
- 74% English-only · Spanish 24% Other Indo-European 1% Other Asian/Pacific 1%
Political lean MEDSL · San Joaquin
- 2024 margin
- Toss-up / Even · D 48.0% · R 48.9% · Other 3.0%
- 2008→2024 swing
- -11.6pp toward R · 2008: 10.7pp · 2024: -0.9pp
- All cycles
- 2024: R+0.9 2020: D+13.9 2016: D+12.9 2012: D+8.9 2008: D+10.7
Not yet ingested
- Civics
- —
Market trends
- HPI YoY
- ▼ -277.06%
- Current HPI
- 334.006
- Rent YoY
- —
- Metro
- —
- State GDP YoY
- ▲ 3.21%
- F500 in state
- 116
Industry mix (Fortune 500 HQ in CA)
| Industry | F500 HQs | Revenue |
|---|---|---|
| Technology | 27 | $1,492B |
|
||
| Financial Services | 3 | $174B |
|
||
| Retail | 3 | $44B |
|
||
| Insurance | 3 | $26B |
|
||
| Media / Entertainment | 2 | $115B |
|
||
| Pharmaceuticals / Biotech | 2 | $62B |
|
||
Cash-flow waterfall
monthlySold comps — $/sqft
last 12 mo · ≤1 miLoading sold comps…