 Multi-family
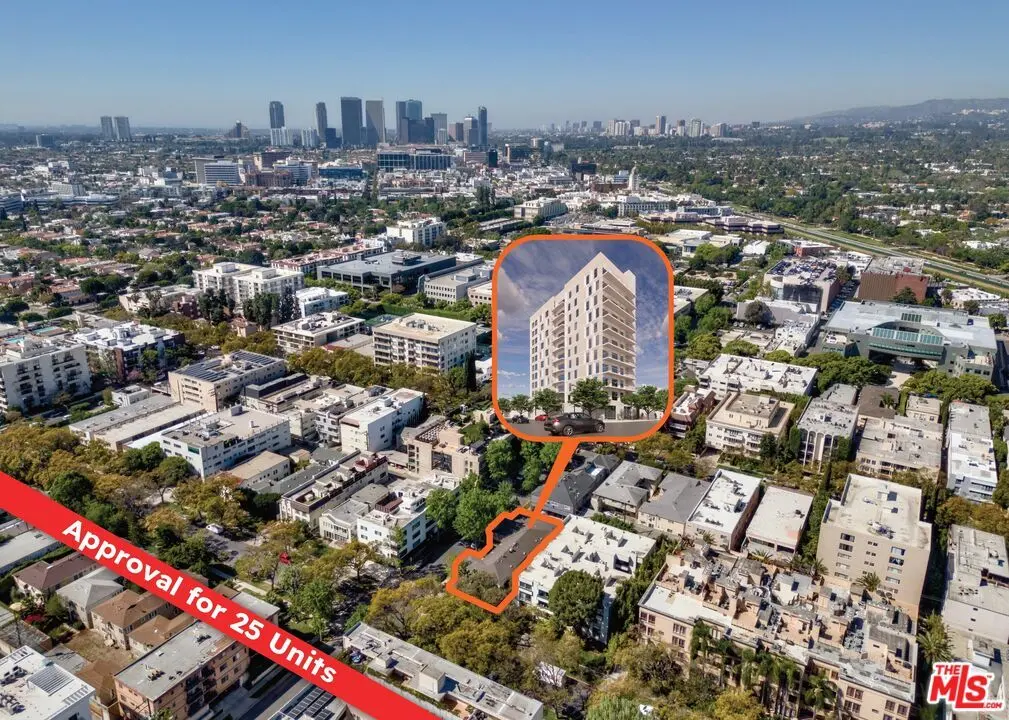
401 N Oakhurst Dr · Beverly Hills, CA
Flood risk 1/10 · Minimal
- FEMA flood zone
- X (unshaded)
- Chance of flooding over 30 yrs
- 0.0%
- Est. flood insurance / yr
- $507 – $1,088
Fire risk 1/10 · Minimal
- Est. fire insurance / yr
- $659 – $1,223
Heat risk 6/10 · Moderate
- Hot days now (above 88°F)
- 7 days/yr
- Hot days in 30 yrs
- 22 days/yr
Wind risk 1/10 · Minimal
- Chance of severe wind over 30 yrs
- —
Air-quality risk 5/10 · Moderate
- Unhealthy air days now
- 7 days/yr
- Unhealthy air days in 30 yrs
- 7 days/yr
Risk factors via First Street. Map © Google.
Why this score? — see what drove the A- grade
The composite is a weighted blend of 9 inputs, each scored 0–100. Each bar is that input's sub-score; the figure is the points it added to the 100-point composite (weight × sub-score).
- Cash flow +30.0/30.0
- 1% rule +10.0/10.0
- DSCR +10.0/10.0
- Appreciation +9.8/10.0
- ARV discount +7.5/15.0
- Schools +5.9/10.0
- Livability +3.7/5.0
- Rent growth +2.9/5.0
- Condition / age +2.5/5.0
$6,200,000
🖨 Deal sheet 📄 Offer letter ✓ Due diligence
Multi-family units
County records classify this as Multi-Family (5+ Unit). Listing-text estimate: 1 unit. estimate disagrees with records
5+ unit building — per-unit beds/baths from public records are typically unavailable; the breakdown below (if shown) is an estimate from the listing text.
Listing remarks
We are proud to present another rare opportunity to acquire an exciting and new type of entitled site in the City of Beverly Hills, one of the most coveted and supply-constrained municipalities throughout the nation. The 7,717 SF site has been entitled utilizing the state Housing Accountability Act Builder's Remedy provisions, securing approvals for a 11-story multi-family development with 25 units. At a height of 131 feet, the residential tower would consist of 22 market rate units and 3 lower-income units. The Project design features 10 residential levels with all two bedroom, two bathroom units, ranging from 1,184 to 1,876 SF, plus a rooftop deck, balconies, and 14 parking spaces. The su
Key facts
- High ceiling
- Rooftop deck
- Bicycle parking
Tags
Property features AI
Finance
- Other: Assessor parcel number 4342-001-030; Disclosures: Property sold As Is
Exterior
- Utilities: Cable available
- Home design: Residential land; Land leased as fee; Zoned R4; Special zoning: Other; Present use: 6 units; Potential for a 25-unit, 11-story project
- Construction: Lot dimensions approximately 51 x 150; Lot area approximately 7,705 sq ft
- Exterior features: Flat topography; Alley access
Interior
- Interior features: Telephone service; Panoramic city lights view
Neighborhood map
What this means for you Summary
Snapshot
- This is a 10-bed/6.0-bath multifamily listed at $6.20M.
Deal economics
- At list price, monthly cash flow is $69k ($824k/yr) — positive.
- The deal already cash-flows at list — no discount required.
- Meets the 1% rule at list price ($136k rent vs $6.20M).
- Recommended offer: $6.11M (1.5% below list) — sets the bar for market timing.
Location & tenants
- Location reads 74/100 on livability (#138 in CA, #4,810 nationally) — a middle-class / working-renter tenant base. Strengths: schools A+, amenities A+, commute A+; Watch: housing C-, health & safety C-, crime F.
- Beverly Hills Unified (suburban): math 57% / reading 73% proficiency, ranked #61 of 517 in CA (top 12%) — acceptable for families but not a draw, mixed tenant base, ~2y average lease; only 7% free/reduced lunch — higher-income household profile.
- Market conditions: Rents rising (+1.7%/yr); 308 active listings in the ZIP; 1 comparable units currently listed for rent nearby; high-income renter base; 19,697 units permitted in Los Angeles County in 2024 (9,426 in 5+ unit buildings).
- At $135,798/mo this rent would consume 868% of the median local household income ($188k/yr) (locally 911% of renters already pay >50% of income on rent) — very limited rent-growth headroom before tenants either downsize or default.
Forward outlook
- In year one you build about $635k of equity ($43k loan paydown + $593k appreciation (9.6% local appreciation)).
- Los Angeles County population projected at +9% by 2050 — modest demand growth; plan on rents tracking national, not racing it.
- At projected returns (9.6% appreciation + 1.7% rent growth), your $1.74M cash investment doubles in ~2 years — after that, you're playing with house money.
- By year 2, paydown + projected appreciation supports a ~$1.02M cash-out refi (75% LTV) — recoverable capital for the next deal without selling this one.
Negotiation context
- It's been on market 29 days — a 2% lower offer ($6.11M) is reasonable based on typical stale-listing flexibility.
- Current owner paid $3.38M; list at $6.20M implies a 83% gain — meaningful room to come down on a strong offer.
Risks & watch-outs
- Watch-outs: built in 1937 — expect roof / HVAC / electrical / plumbing capex.
- Climate carrying-cost: extreme-heat days projected 7→22/yr by 2055 (HVAC capex compounding) — expect insurance premiums to compound above CPI over the hold.
Questions for the listing agent
- Built in 1937 — when were the roof, HVAC, electrical panel, plumbing, and water heater last replaced?
- Is there a deadline driving the sale (1031 exchange, divorce, estate, relocation)? That informs how much negotiation room exists.
- Schools are A-rated — typically a magnet for longer-tenancy family renters. What's the average tenant stay here, and is there a school-zone premium baked into asking?
- Crime grade is F in this area — have there been break-ins, vandalism, or insurance claims at this property in the last 3 years? What carrier currently insures it and at what premium?
- What's the average days-on-market for RENTAL listings here right now (not sales)? A rising rental-DOM trend means longer vacancies and softer asking-rent achievability than the comps imply.
- What's the recent tenant-quality profile in this submarket — average credit score on applications, eviction rate, late-payment / NSF rate, and stable-employment percentage? A property-management company in the area should have these aggregated.
- How much new apartment / multifamily construction is in the pipeline within 1–3 miles? Heavy new supply (>2% of stock underway) typically softens rents 12–24 months out; light construction supports rent growth.
Investment metrics
- 1% rule
- 2.19% ✓
- Cap rate
- 19.58%
- Cash-on-cash
- 47.45%
- DSCR
- 3.11
- GRM
- 3.8
CMA / ARV
No comps found within radius.
Projected returns pro-forma
9.56% appreciation · 1.73% rent growth · sell at horizon
- IRR
- 60.0%
- Equity multiple
- 5.26×
- Total profit
- $7,389,432
- Equity at exit
- $5,386,178
- IRR
- 53.3%
- Equity multiple
- 11.34×
- Total profit
- $17,945,774
- Equity at exit
- $11,409,778
Cash invested: $1,736,000 (down + closing). Projections, not guarantees.
Landlord ↔ Tenant lean methodology
- Overall (STATE)
- 18 Strongly Tenant-Friendly
- State California
- 18 Strongly Tenant-Friendly · D+13
- County
- — inherits STATE
- City
- — inherits STATE
ZIP-level market 90210
- Home prices YoY
- 2.0%
- Rents YoY
- 1.7%
- Active inventory
- 308
- Price-to-rent
- 95.1×
Monthly cashflow live
- Estimated rent
- $135,798 medium interval (Pro) →
- Mortgage (P&I)
- −$32,513
- Tax from tax record
- −$3,540 /mo · $42,475/yr
- Insurance
- −$2,583
- HOA
- −$0
- Vacancy / Maint / Mgmt
- −$28,518
- Net cashflow
- $68,644
Break-even live
25-unit breakdown (identical units grouped — click to expand)
| Units | Beds | Baths | Est. rent |
|---|---|---|---|
| 25× units | 2 | 2 | $135,800 |
| #1 | 2 | 2 | $5,432 |
| #2 | 2 | 2 | $5,432 |
| #3 | 2 | 2 | $5,432 |
| #4 | 2 | 2 | $5,432 |
| #5 | 2 | 2 | $5,432 |
| #6 | 2 | 2 | $5,432 |
| #7 | 2 | 2 | $5,432 |
| #8 | 2 | 2 | $5,432 |
| #9 | 2 | 2 | $5,432 |
| #10 | 2 | 2 | $5,432 |
| #11 | 2 | 2 | $5,432 |
| #12 | 2 | 2 | $5,432 |
| #13 | 2 | 2 | $5,432 |
| #14 | 2 | 2 | $5,432 |
| #15 | 2 | 2 | $5,432 |
| #16 | 2 | 2 | $5,432 |
| #17 | 2 | 2 | $5,432 |
| #18 | 2 | 2 | $5,432 |
| #19 | 2 | 2 | $5,432 |
| #20 | 2 | 2 | $5,432 |
| #21 | 2 | 2 | $5,432 |
| #22 | 2 | 2 | $5,432 |
| #23 | 2 | 2 | $5,432 |
| #24 | 2 | 2 | $5,432 |
| #25 | 2 | 2 | $5,432 |
| Total (25 units) | $135,798 | ||
UW: 25.0% down · 7.5% · 30yr · 1.5% tax · 5.0% vac · 8.0% maint · 8.0% mgmt
Financing live
Cash to close
- Down payment
- $1,550,000
- Closing costs
- $186,000
- Reserves months
- —
- Total cash needed
- —
Loan-product check · same deal, 3 products live
Conventional
25% down · 7.5% · 30yr
- Down + closing
- —
- Monthly P&I
- —
- Monthly cashflow
- —
- DSCR
- —
- Eligible?
- —
Personal DTI + credit; lowest rate.
DSCR
20% down · 8.5% · 30yr
- Down + closing
- —
- Monthly P&I
- —
- Monthly cashflow
- —
- DSCR
- —
- Eligible?
- —
No personal income docs; deal must DSCR.
Hard money
10% down · 12.0% · 12mo
- Down + closing
- —
- Monthly P&I
- —
- Monthly cashflow
- —
- DSCR
- —
- Eligible?
- —
Short-term bridge; refi at stabilization.
Rent comps 1 comps
| Address | Beds | Baths | Sqft | Rent | $/sqft | DOM | Units | Dist |
|---|---|---|---|---|---|---|---|---|
| 9451 Sunset Blvd Beverly Hills, CA | 9.0 | 11.5 | 10000 | $98,000 | $9.80 | 43d | 1 | 1.03mi |
Listing history 17 events
-
2026-06-18days on market $6,200,000 Active 29 DOM
-
2026-06-17days on market $6,200,000 Active 28 DOM
-
2026-06-16days on market $6,200,000 Active 27 DOM
-
2026-06-15days on market $6,200,000 Active 26 DOM
-
2026-06-13days on market $6,200,000 Active 24 DOM
-
2026-06-13days on market $6,200,000 Active 23 DOM
-
2026-06-09days on market $6,200,000 Active 20 DOM
-
2026-06-08days on market $6,200,000 Active 19 DOM
-
2026-06-07days on market $6,200,000 Active 18 DOM
-
2026-06-04days on market $6,200,000 Active 15 DOM
-
2026-06-03days on market $6,200,000 Active 14 DOM
-
2026-06-02days on market $6,200,000 Active 13 DOM
-
2026-06-01days on market $6,200,000 Active 12 DOM
-
2026-05-31days on market $6,200,000 Active 11 DOM
-
2026-05-20$6,200,000 Active
-
2023-08-24soldstatus $3,380,000
-
1977-02-14soldstatus $255,000
ⓘ Source: listings_history table (triggers on properties + properties_extension) + one-shot
backfill from property_details.listing_events for pre-trigger history.
Tax reassessment forecast CA · Resets to sale price
- Current annual tax
- $42,475 · $3,540/mo
- Projected year-2 tax
- $47,120 · $3,927/mo
- Expected delta
- +$4,645/yr (+$387/mo · 10.9%)
ⓘ Screening estimate from a state-policy table — verify with the county assessor before closing.
Climate risk First Street
- Flood 1/10 Low FEMA zone X (unshaded) · 0% chance over 30 yrs
- Wildfire 1/10 Low
- Heat 6/10 Major 7 d/yr ≥88°F today · 22 d/yr by 30 yrs out
- Wind 1/10 Low
- Air quality 5/10 Major 7 unhealthy d/yr today · 7 by 30 yrs out
Nearby sold comps map
Loading sold comps map…
Walkable amenities ~0.75 mi
Loading nearby amenities…
Taxation est. · year 1
- Rental income
- $1,629,576
- − Mortgage interest
- −$347,296
- − Property taxes
- −$42,475
- − Insurance
- −$31,000
- − Repairs & maintenance
- −$130,366
- − Management
- −$130,366
- − Depreciation
- −$180,364
- Taxable income
- $767,709
- Est. tax owed @ 24.0%
- −$184,250
- After-tax cash flow
- $639,478/yr
For passive investors: Depreciation is non-cash, so a rental often shows a tax loss while cash-flowing — sheltering income. Rental losses are passive: they offset passive income freely, and up to $25,000/yr can offset ordinary (W-2) income if you actively participate and your MAGI is under $100k (phasing out to $0 by $150k); unused losses carry forward. On sale, claimed depreciation is recaptured at up to 25%, and gains may owe capital-gains tax (a 1031 exchange can defer both). Figures are a year-1 estimate at your 24.0% rate — not tax advice; consult a CPA.
Schools (NCES district)
- District
- Beverly Hills Unified
- NCES district ID
- 0604830
- Math proficiency
- 57% ▼ -7.00%
- Reading proficiency
- 73% ▼ -2.00%
- Median HH income
- $89,439
- Composite
- 58.93/100
- National rank
- #969
- State rank
- #61 of 517 in CA
Livability — Beverly Hills
- Score
- 74/100
- State rank
- #138
- US rank
- #4810
Category grades
Schools grade is shown separately in the Schools card above.
Census & demographics
- Census place
- Beverly Hills, CA
- County
- Los Angeles County · 9,444,647 people
- City population
- 38,852
- Metro
- Los Angeles-Long Beach-Anaheim, CA
- Population (ZIP)
- 19,004
- Household income
- $187,801
- Rent vs Own
- Severe rent burden
- 911.0
Population outlook (Los Angeles County) Hauer SSP2
- Today (2025)
- 10,940,515 people
- By 2030
- 11,256,481 · +2.9%
- By 2040
- 11,729,929 · +7.2%
- By 2050
- 11,948,407 · +9.2%
- By 2075
- 11,818,114 · +8.0%
- By 2100
- 10,842,928 · -0.9%
Race, ethnicity, and origin ACS 2023
- Neighborhood character
- Predominantly White (81%)
- Race & ethnicity
- White 81% Two or more races 8% Asian 7% Hispanic / Latino 6% Black 2%
- Hispanic origin (detail)
- Mexican 3%
- Common ancestry
- Scotch-Irish 5% Italian 4% Romanian 3%
- Foreign-born
- 36% · Canada, China, South Korea
- Languages at home
- 59% English-only · Other Indo-European 21% Spanish 4% French/Haitian/Cajun 3%
Political lean MEDSL · Los Angeles
- 2024 margin
- Solid D (+32.9) · D 64.8% · R 31.9% · Other 3.3%
- 2008→2024 swing
- -7.4pp toward R · 2008: 40.4pp · 2024: 32.9pp
- All cycles
- 2024: D+32.9 2020: D+44.2 2016: D+48.0 2012: D+40.0 2008: D+40.4
Not yet ingested
- Civics
- —
Market trends
- HPI YoY
- ▲ 9.56%
- Current HPI
- 495.052
- Rent YoY
- ▲ 1.73%
- Metro
- Los Angeles-Long Beach-Anaheim, CA
- State GDP YoY
- ▲ 3.21%
- F500 in state
- 116
Industry mix (Fortune 500 HQ in CA)
| Industry | F500 HQs | Revenue |
|---|---|---|
| Technology | 27 | $1,492B |
|
||
| Financial Services | 3 | $174B |
|
||
| Retail | 3 | $44B |
|
||
| Insurance | 3 | $26B |
|
||
| Media / Entertainment | 2 | $115B |
|
||
| Pharmaceuticals / Biotech | 2 | $62B |
|
||
Price history
+2331.4% since first listed3 events — show timeline
- 2026-05-20 Listed $6,200,000 TheMLS
- 2023-08-24 Sold (Public Records) $3,380,000 Public Records
- 1977-02-14 Sold (Public Records) $255,000 Public Records
Property tax history
+11.2%/yrLatest (2025): $42,475 · +2.2% YoY. Source: county tax records.
Cash-flow waterfall
monthlySold comps — $/sqft
last 12 mo · ≤1 miLoading sold comps…