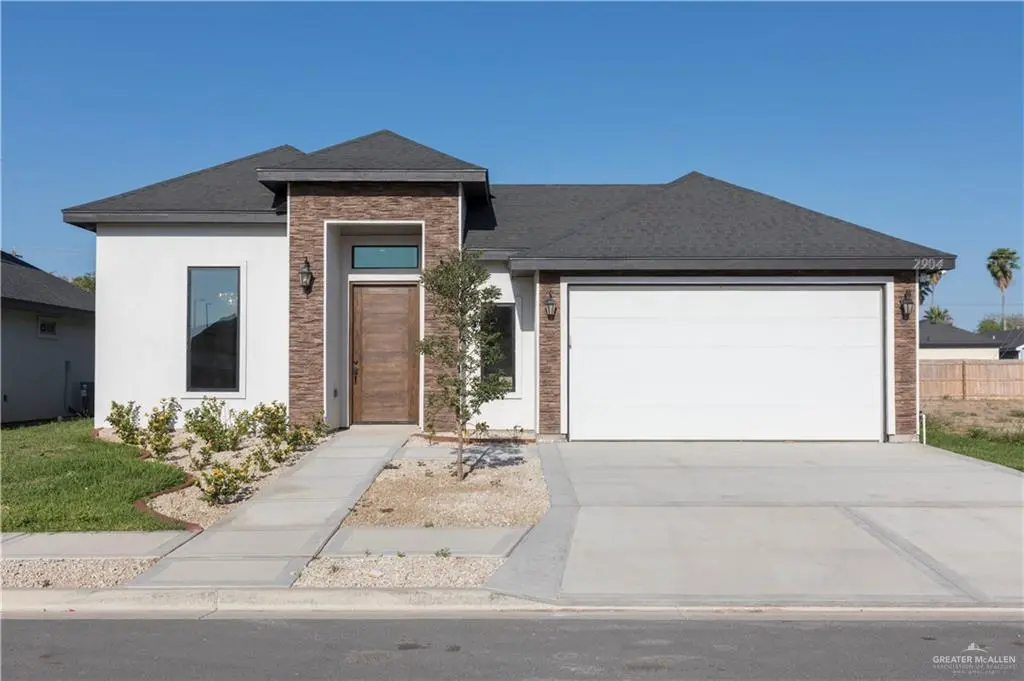
2904 Magnolia Dr · San Juan, TX
Flood risk No data
- FEMA flood zone
- —
- Chance of flooding over 30 yrs
- —
- Est. flood insurance / yr
- —
Fire risk No data
- Est. fire insurance / yr
- —
Heat risk No data
- Hot days now (above threshold)
- —
- Hot days in 30 yrs
- —
Wind risk No data
- Chance of severe wind over 30 yrs
- —
Air-quality risk No data
- Unhealthy air days now
- —
- Unhealthy air days in 30 yrs
- —
Risk factors via First Street. Map © Google.
Why this score? — see what drove the F grade
The composite is a weighted blend of 9 inputs, each scored 0–100. Each bar is that input's sub-score; the figure is the points it added to the 100-point composite (weight × sub-score).
- Cash flow +15.4/30.0
- DSCR +4.7/10.0
- Livability +3.6/5.0
- 1% rule +3.3/10.0
- Rent growth +2.5/5.0
- Condition / age +2.5/5.0
- Schools +2.0/10.0
- ARV discount +0.0/15.0
- Appreciation +0.0/10.0
$330,000
🖨 Deal sheet 📄 Offer letter ✓ Due diligence
Listing remarks MLS
Welcome to your dream home in San Juan, Texas! Nestled in a highly sought-after neighborhood," Plantation Heights". This stunning new construction offers the perfect blend of modern elegance and comfortable living. As you step inside, you’ll be greeted by high and decorative ceilings that add a touch of sophistication to the spacious living areas. This home features 4 bedrooms and 3.5 luxurious bathrooms, providing ample space for your family. The master suite boasts a walk-in closet and an in-suite bathroom with high-end finishes. Energy efficiency is a priority in this home, with spray foam ensuring comfort and reduced utility costs year-round. Don’t miss the opportunity to make this exquisite property your own!
Key facts
- New construction
- Walk-in closet
- In-suite bathroom
Tags
Neighborhood map
What this means for you Summary
Snapshot
- This is a 4-bed/3.5-bath land listed at $330k.
Deal economics
- At list price, monthly cash flow is $128 ($2k/yr) — positive.
- The deal already cash-flows at list — no discount required.
- To meet the 1% rule (rent ≥ 1% of price), the offer needs to be $274k (17.0% below list).
- Recommended offer: $274k (17.0% below list) — sets the bar for 1% rule.
- Cap rate 6.8% vs local median 3.4% in San Juan — top-decile yield for the area; either an underpriced asset or a hidden risk that comps aren't pricing in. Stress-test before assuming the spread holds.
Location & tenants
- Location reads 71/100 on livability (#294 in TX) — a middle-class / working-renter tenant base. Strengths: cost of living A+, housing A+, health & safety A+; Watch: schools D, amenities F, commute F.
- Pharr-San Juan-Alamo ISD (suburban): math 18% / reading 30% proficiency, ranked #740 of 826 in TX (top 90%) — low school quality limits family demand, transient renter base, plan for 1-2y turnover; 72% free/reduced lunch — lower-income household profile, screen leases tightly.
- Market conditions: 362 active listings in the ZIP; 7 comparable units currently listed for rent nearby; rentals at typical pace (median 23d on market — plan ~3-4 weeks tenant-placement turnaround); 43% of comp listings sitting > 30 days — soft ceiling on asking rent; 7,378 units permitted in Hidalgo County in 2024 (641 in 5+ unit buildings).
Forward outlook
- Local home prices are declining (-3.0%/yr); year-one equity from $2k of loan paydown is wiped out by about $10k of value loss. Plan a longer hold.
- Hidalgo County population projected at +28% by 2050 — long-run rental-demand tailwind backs the buy-and-hold thesis.
Negotiation context
- It's been on market 85 days — a 6% lower offer ($310k) is reasonable based on typical stale-listing flexibility.
Questions for the listing agent
- It's been on market 85 days. Have you received any prior offers? Is the seller open to a 17% concession, seller financing, or rate buy-down credit?
- What does the HOA fee cover, when was the last increase, and are there any pending special assessments or reserve-fund shortfalls?
- Why hasn't it sold? Are there any deal-killer items the seller is aware of (foundation, flood, title, zoning, code violations)?
- Is there a deadline driving the sale (1031 exchange, divorce, estate, relocation)? That informs how much negotiation room exists.
- Schools are D-rated, which usually means shorter tenancies and higher turnover. Who's the typical renter profile here, and what's been the actual vacancy rate?
- The area grade is low — what's the realistic commute time and amenity access for the typical tenant pool here? Any planned neighborhood developments (good or bad) we should know about?
- What's the average days-on-market for RENTAL listings here right now (not sales)? A rising rental-DOM trend means longer vacancies and softer asking-rent achievability than the comps imply.
- What's the recent tenant-quality profile in this submarket — average credit score on applications, eviction rate, late-payment / NSF rate, and stable-employment percentage? A property-management company in the area should have these aggregated.
- How much new for-sale + rental construction is in the pipeline within 1–3 miles? Heavy new supply typically softens prices + rents 12–24 months out; constrained supply supports both.
Investment metrics
- 1% rule
- 0.83% ✗
- Cap rate
- 6.76%
- Cash-on-cash
- 1.66%
- DSCR
- 1.07
- GRM
- 10.0
CMA / ARV
- ARV (median comp)
- $245,143
- List price
- $330,000
- Delta
- 34.62%
- Verdict
- OVERPRICED
- Comps
- 20 within 1.0 mi
Projected returns pro-forma
-3.0% appreciation · 3.0% rent growth · sell at horizon
- IRR
- -13.7%
- Equity multiple
- 0.51×
- Total profit
- $-45,454
- Equity at exit
- $49,204
- IRR
- -4.9%
- Equity multiple
- 0.68×
- Total profit
- $-29,555
- Equity at exit
- $28,532
Cash invested: $92,400 (down + closing). Projections, not guarantees.
Landlord ↔ Tenant lean methodology
- Overall (STATE)
- 87 Strongly Landlord-Friendly
- State Texas
- 87 Strongly Landlord-Friendly · R+5
- County
- — inherits STATE
- City
- — inherits STATE
ZIP-level market 78589
- Home prices YoY
- -12.1%
- Active inventory
- 362
- Price-to-rent
- 10.0×
Monthly cashflow live
- Estimated rent
- $2,739 high interval (Pro) →
- Mortgage (P&I)
- −$1,731
- Tax from tax record
- −$138 /mo · $1,662/yr
- Insurance
- −$138
- HOA
- −$30
- Vacancy / Maint / Mgmt
- −$575
- Net cashflow
- $128
Break-even live
UW: 25.0% down · 7.5% · 30yr · 1.5% tax · 5.0% vac · 8.0% maint · 8.0% mgmt
Financing live
Cash to close
- Down payment
- $82,500
- Closing costs
- $9,900
- Reserves months
- —
- Total cash needed
- —
Loan-product check · same deal, 3 products live
Conventional
25% down · 7.5% · 30yr
- Down + closing
- —
- Monthly P&I
- —
- Monthly cashflow
- —
- DSCR
- —
- Eligible?
- —
Personal DTI + credit; lowest rate.
DSCR
20% down · 8.5% · 30yr
- Down + closing
- —
- Monthly P&I
- —
- Monthly cashflow
- —
- DSCR
- —
- Eligible?
- —
No personal income docs; deal must DSCR.
Hard money
10% down · 12.0% · 12mo
- Down + closing
- —
- Monthly P&I
- —
- Monthly cashflow
- —
- DSCR
- —
- Eligible?
- —
Short-term bridge; refi at stabilization.
Rent comps 7 comps
| Address | Beds | Baths | Sqft | Rent | $/sqft | DOM | Units | Dist |
|---|---|---|---|---|---|---|---|---|
| 2917 Arboledas Dr San Juan, TX | 3.0 | 2.0 | 1843 | $3,260 | $1.77 | 14d | 1 | 0.10mi |
| 1606 S Kumquat St Pharr, TX | 3.0 | 2.0 | 1476 | $1,350 | $0.91 | 23d | 1 | 0.81mi |
| 1606 Kumquat Ave Pharr, TX | 3.0 | 2.0 | 1476 | $1,398 | $0.95 | 43d | 1 | 0.93mi |
| 1305 James Cir Pharr, TX | 3.0 | 2.0 | 1525 | $1,550 | $1.02 | 23d | 1 | 1.17mi |
| 2302 San Pascual St San Juan, TX | 3.0 | 2.0 | 1285 | $1,800 | $1.40 | 43d | 1 | 1.19mi |
| 4000 S Las Nubes Pharr, TX | 3.0 | 2.5 | 1498 | $2,000 | $1.34 | 43d | 1 | 1.35mi |
| 4000 S Las Nubes Pharr, TX | 3.0 | 2.0 | 1549 | $2,000 | $1.29 | 19d | 1 | 1.35mi |
HOA detail
- Monthly dues
- $30 · $360/yr
Listing history 17 events
-
2026-06-18days on market $330,000 Active 85 DOM
-
2026-06-17days on market $330,000 Active 84 DOM
-
2026-06-16days on market $330,000 Active 83 DOM
-
2026-06-15days on market $330,000 Active 82 DOM
-
2026-06-14days on market $330,000 Active 80 DOM
-
2026-06-13days on market $330,000 Active 79 DOM
-
2026-06-10days on market $330,000 Active 77 DOM
-
2026-06-09days on market $330,000 Active 76 DOM
-
2026-06-08days on market $330,000 Active 75 DOM
-
2026-06-07days on market $330,000 Active 74 DOM
-
2026-06-03days on market $330,000 Active 70 DOM
-
2026-06-02days on market $330,000 Active 69 DOM
-
2026-06-01days on market $330,000 Active 68 DOM
-
2026-05-31days on market $330,000 Active 67 DOM
-
2026-05-31days on market $330,000 Active 66 DOM
-
2026-04-29price $330,000 749-char remark
Show marketing remark (749 chars)
Welcome to your dream home in San Juan, Texas! Nestled in a highly sought-after neighborhood," Plantation Heights". This stunning new construction offers the perfect blend of modern elegance and comfortable living. As you step inside, you’ll be greeted by high and decorative ceilings that add a touch of sophistication to the spacious living areas. This home features 4 bedrooms and 3.5 luxurious bathrooms, providing ample space for your family. The master suite boasts a walk-in closet and an in-suite bathroom with high-end finishes. Energy efficiency is a priority in this home, with spray foam ensuring comfort and reduced utility costs year-round. Don’t miss the opportunity to make this exquisite property your own!
-
2026-03-25$340,000 Active 749-char remark
Show marketing remark (749 chars)
Welcome to your dream home in San Juan, Texas! Nestled in a highly sought-after neighborhood," Plantation Heights". This stunning new construction offers the perfect blend of modern elegance and comfortable living. As you step inside, you’ll be greeted by high and decorative ceilings that add a touch of sophistication to the spacious living areas. This home features 4 bedrooms and 3.5 luxurious bathrooms, providing ample space for your family. The master suite boasts a walk-in closet and an in-suite bathroom with high-end finishes. Energy efficiency is a priority in this home, with spray foam ensuring comfort and reduced utility costs year-round. Don’t miss the opportunity to make this exquisite property your own!
ⓘ Source: listings_history table (triggers on properties + properties_extension) + one-shot
backfill from property_details.listing_events for pre-trigger history.
Tax reassessment forecast TX · Resets to sale price
- Current annual tax
- $1,662 · $138/mo
- Projected year-2 tax
- $6,039 · $503/mo
- Expected delta
- +$4,377/yr (+$365/mo · 263.4%)
ⓘ Screening estimate from a state-policy table — verify with the county assessor before closing.
Nearby sold comps map
Loading sold comps map…
Walkable amenities ~0.75 mi
Loading nearby amenities…
Taxation est. · year 1
- Rental income
- $32,873
- − Mortgage interest
- −$18,485
- − Property taxes
- −$1,662
- − Insurance
- −$1,650
- − Repairs & maintenance
- −$2,630
- − Management
- −$2,630
- − HOA
- −$360
- − Depreciation
- −$9,600
- Taxable loss
- −$4,143
- Est. tax savings @ 24.0%
- +$994
- After-tax cash flow
- $2,526/yr
For passive investors: Depreciation is non-cash, so a rental often shows a tax loss while cash-flowing — sheltering income. Rental losses are passive: they offset passive income freely, and up to $25,000/yr can offset ordinary (W-2) income if you actively participate and your MAGI is under $100k (phasing out to $0 by $150k); unused losses carry forward. On sale, claimed depreciation is recaptured at up to 25%, and gains may owe capital-gains tax (a 1031 exchange can defer both). Figures are a year-1 estimate at your 24.0% rate — not tax advice; consult a CPA.
Schools (NCES district)
- District
- Pharr-San Juan-Alamo ISD
- NCES district ID
- 4834860
- Math proficiency
- 18% ▼ -34.00%
- Reading proficiency
- 30% ▼ -11.00%
- Median HH income
- $33,757
- Composite
- 19.63/100
- National rank
- #8744
- State rank
- #740 of 826 in TX
Livability — San Juan
- Score
- 71/100
- State rank
- #294
- US rank
- #6725
Category grades
Schools grade is shown separately in the Schools card above.
Census & demographics
- Census place
- San Juan, TX
- City population
- 34,370
- Population (ZIP)
- 39,958
Population outlook (Hidalgo County) Hauer SSP2
- Today (2025)
- 955,232 people
- By 2030
- 1,009,774 · +5.7%
- By 2040
- 1,120,332 · +17.3%
- By 2050
- 1,225,036 · +28.2%
- By 2075
- 1,439,189 · +50.7%
- By 2100
- 1,533,429 · +60.5%
Race, ethnicity, and origin ACS 2023
- Neighborhood character
- Predominantly Hispanic (97%)
- Race & ethnicity
- Hispanic / Latino 97% Two or more races 43% White 3%
- Hispanic origin (detail)
- Mexican 94%
- Foreign-born
- 26% · Canada
- Languages at home
- 18% English-only · Spanish 82%
Political lean MEDSL · Hidalgo
- 2024 margin
- Toss-up / Even · D 48.1% · R 51.0%
- 2008→2024 swing
- -41.6pp toward R · 2008: 38.7pp · 2024: -2.9pp
- All cycles
- 2024: R+2.9 2020: D+17.1 2016: D+40.5 2012: D+41.8 2008: D+38.7
Not yet ingested
- Civics
- —
Market trends
- HPI YoY
- ▼ -32.82%
- Current HPI
- 239.3829
- Rent YoY
- —
- Metro
- —
- State GDP YoY
- ▲ 3.95%
- F500 in state
- 110
Industry mix (Fortune 500 HQ in TX)
| Industry | F500 HQs | Revenue |
|---|---|---|
| Energy | 16 | $1,198B |
|
||
| Technology | 5 | $198B |
|
||
| Engineering / Construction | 4 | $72B |
|
||
| Energy Services | 3 | $60B |
|
||
| Utilities | 3 | $41B |
|
||
| Healthcare | 2 | $330B |
|
||
Price history
-2.9% since first listed2 events — show timeline
- 2026-04-29 Price Changed $330,000 MCALLENMLS
- 2026-03-25 Listed $340,000 MCALLENMLS
Property tax history
+27.0%/yrLatest (2025): $1,662 · +27.0% YoY. Source: county tax records.
Cash-flow waterfall
monthlySold comps — $/sqft
last 12 mo · ≤1 miLoading sold comps…