151 SE 1st St #608 · Miami, FL
Flood risk 5/10 · Moderate
- FEMA flood zone
- X (unshaded)
- Chance of flooding over 30 yrs
- 0.5%
- Est. flood insurance / yr
- $507 – $1,088
Fire risk 1/10 · Minimal
- Est. fire insurance / yr
- $947 – $1,759
Heat risk 10/10 · Severe
- Hot days now (above 103°F)
- 4 days/yr
- Hot days in 30 yrs
- 15 days/yr
Wind risk 10/10 · Severe
- Chance of severe wind over 30 yrs
- 99.0%
Air-quality risk 2/10 · Minimal
- Unhealthy air days now
- 1 days/yr
- Unhealthy air days in 30 yrs
- 1 days/yr
Risk factors via First Street. Map © Google.
Why this score? — see what drove the C grade
The composite is a weighted blend of 9 inputs, each scored 0–100. Each bar is that input's sub-score; the figure is the points it added to the 100-point composite (weight × sub-score).
- Cash flow +18.3/30.0
- 1% rule +7.8/10.0
- ARV discount +7.5/15.0
- DSCR +5.8/10.0
- Schools +4.2/10.0
- Appreciation +4.0/10.0
- Livability +3.9/5.0
- Rent growth +3.0/5.0
- Condition / age +2.5/5.0
$304,500
🖨 Deal sheet (PDF) 📄 Offer letter ✓ Due diligence
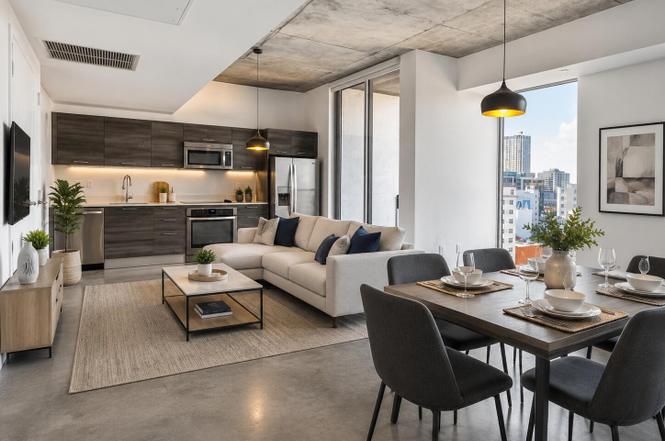
Listing remarks
NEWLY painted luxury studio apartment nestled in the heart of downtown Miami. This rare gem gives easy access tothe city's vibrant cultural and commercial districts—walk to Bayfront Park, Brickell, Biscayne Blvd, and a variety ofshops & entertainment venues. The unit comes equipped with a washer & dryer, and the building boasts top-notchamenities including a rooftop pool, upper & lower lounges, a gym, & steam room. Pet-friendly with no weight or sizerestrictions. ADDED BONUS: you can do 30 day SHORT-TERM RENTALS with thisunit!
Key facts
- Rooftop pool
- Steam room
- Gym
Tags
Property features AI
Finance
- Other: Directions: Downtown Miami exit 2c on I-95
- Financial info: Pets allowed with number limit
- HOA & community: Has association; Monthly association fee; Association amenities include clubhouse, fitness center, pool, sauna, trash chute, community room, internet included, and kitchen facilities; Association fee covers maintenance of structure, sewer, water, hot water, and pool service
Exterior
- Parking: Valet parking
- Security: Smoke detector(s); Security system
- Utilities: Water included in association; Sewer included in association; Hot water included in association; Pool service included in association
- Home design: Condominium; Resale property; 30-story building; Accessible elevator installed
- Construction: Built with CBS (concrete block and stucco) construction
- Exterior features: Not waterfront
Interior
- Kitchen: Microwave; Refrigerator
- Bedrooms: 1 bedroom on the main level
- Flooring: Concrete flooring
- Bathrooms: 1 full bathroom
- Heating & cooling: Central heating; Central air conditioning
- Interior features: High ceilings; Walk-in closet(s)
Neighborhood map
What this means for you Summary
Snapshot
- This is a 1-bed/1.0-bath condo listed at $304k.
Deal economics
- At list price, monthly cash flow is $281 ($3k/yr) — positive.
- The deal already cash-flows at list — no discount required.
- Meets the 1% rule at list price ($4k rent vs $304k).
- Recommended offer: $277k (9.0% below list) — sets the bar for market timing.
- Cap rate 7.4% vs local median 1.9% in Miami — top-decile yield for the area; either an underpriced asset or a hidden risk that comps aren't pricing in. Stress-test before assuming the spread holds.
Location & tenants
- Location reads 78/100 on livability (#177 in FL, #2,724 nationally) — a middle-class / working-renter tenant base. Strengths: amenities A+, commute A+, health & safety A+; Watch: employment C-, crime F, cost of living F.
- Miami-Dade (suburban): math 45% / reading 54% proficiency, ranked #40 of 73 in FL (top 55%) — families likely to look elsewhere, expect single-tenant / working-renter base with shorter leases; 64% free/reduced lunch — lower-income household profile, screen leases tightly.
- Zoned schools: Frederick R. Douglass Elementary (math 12% / reading 22%, grade F, #2,121 of 2,144 statewide, top 99%, 221 students, 76% FRL); Jose De Diego Middle School (math 20% / reading 24%, grade F, #549 of 571 statewide, top 97%, 868 students, 68% FRL); Booker T. Washington Senior High (math 12% / reading 19%, grade F, #604 of 667 statewide, top 91%, 1,014 students, 60% FRL) — zoned schools at 68% FRL track the district average.
- Zoned-school proficiency averages 18% at this address vs 50% district-wide (-31 pts) — the specific schools serving this property underperform the Miami-Dade average; the district grade overstates school quality for this exact location.
- Market conditions: Rents rising (+2.0%/yr); 1023 active listings in the ZIP; 1 comparable units currently listed for rent nearby; high-income renter base; 10,051 units permitted in Miami-Dade County in 2024 (7,758 in 5+ unit buildings).
- This rent runs 32% of the median local income ($144k/yr) — at the standard rent-burdened threshold; future hikes will face affordability resistance.
Forward outlook
- Local home prices are declining (-2.1%/yr); year-one equity from $2k of loan paydown is wiped out by about $6k of value loss. Plan a longer hold.
- Miami-Dade County population projected at +28% by 2050 — long-run rental-demand tailwind backs the buy-and-hold thesis.
Negotiation context
- It's been on market 99 days — a 9% lower offer ($277k) is reasonable based on typical stale-listing flexibility.
- 7 sale attempts since 2y ago; this cycle's ask is 13433% above the opening price — seller raised mid-cycle; expect resistance to lowballs.
Risks & watch-outs
- Climate carrying-cost: moderate flood risk; severe wind risk, 99% chance of damaging wind over 30y; extreme-heat days projected 4→15/yr by 2055 (HVAC capex compounding) — expect insurance premiums to compound above CPI over the hold.
Questions for the listing agent
- It's been on market 99 days. Have you received any prior offers? Is the seller open to a 9% concession, seller financing, or rate buy-down credit?
- What does the HOA fee cover, when was the last increase, and are there any pending special assessments or reserve-fund shortfalls?
- Any open or pending special assessments — roof, HVAC, plumbing, elevator, façade? What's the per-unit balance and payoff schedule, and is the seller paying it off at close or rolling it to the buyer?
- Why hasn't it sold? Are there any deal-killer items the seller is aware of (foundation, flood, title, zoning, code violations)?
- Is there a deadline driving the sale (1031 exchange, divorce, estate, relocation)? That informs how much negotiation room exists.
- Schools are B-rated — typically a magnet for longer-tenancy family renters. What's the average tenant stay here, and is there a school-zone premium baked into asking?
- Crime grade is F in this area — have there been break-ins, vandalism, or insurance claims at this property in the last 3 years? What carrier currently insures it and at what premium?
- What's the average days-on-market for RENTAL listings here right now (not sales)? A rising rental-DOM trend means longer vacancies and softer asking-rent achievability than the comps imply.
- What's the recent tenant-quality profile in this submarket — average credit score on applications, eviction rate, late-payment / NSF rate, and stable-employment percentage? A property-management company in the area should have these aggregated.
- How much new apartment / multifamily construction is in the pipeline within 1–3 miles? Heavy new supply (>2% of stock underway) typically softens rents 12–24 months out; light construction supports rent growth.
Investment metrics
- 1% rule
- 1.28% ✓
- Cap rate
- 7.40%
- Cash-on-cash
- 3.96%
- DSCR
- 1.18
- GRM
- 6.5
CMA / ARV
No comps found within radius.
Projected returns pro-forma
-2.09% appreciation · 2.04% rent growth · sell at horizon
- IRR
- -6.8%
- Equity multiple
- 0.73×
- Total profit
- $-22,975
- Equity at exit
- $57,835
- IRR
- 0.1%
- Equity multiple
- 1.00×
- Total profit
- $421
- Equity at exit
- $48,189
Cash invested: $85,260 (down + closing). Projections, not guarantees.
Landlord ↔ Tenant lean methodology
- Overall (STATE)
- 87 Strongly Landlord-Friendly
- State Florida
- 87 Strongly Landlord-Friendly · R+3
- County
- — inherits STATE
- City
- — inherits STATE
ZIP-level market 33131
- Home prices YoY
- -0.7%
- Rents YoY
- 2.0%
- Active inventory
- 1023
- Price-to-rent
- 6.5×
Monthly cashflow live
- Estimated rent
- $3,886 medium interval (Pro) →
- Mortgage (P&I)
- −$1,597
- Tax from tax record
- −$381 /mo · $4,573/yr
- Insurance
- −$127
- HOA
- −$684
- Lot rent
- −$0
- Vacancy / Maint / Mgmt
- −$816
- Net cashflow
- $281
Break-even live
Sensitivity live
| Price | -10% $454 | -5% $368 | +0% $281 | +5% $195 | +10% $109 |
|---|---|---|---|---|---|
| Rent | -10% $-26 | -5% $128 | +0% $281 | +5% $435 | +10% $588 |
| Rate | -1.0pp $435 | -0.5pp $359 | base $281 | +0.5pp $202 | +1.0pp $122 |
UW: 25.0% down · 7.5% · 30yr · 1.5% tax · 5.0% vac · 8.0% maint · 8.0% mgmt
Financing live
Cash to close
- Down payment
- $76,125
- Closing costs
- $9,135
- Reserves months
- —
- Total cash needed
- —
Loan-product check · same deal, 3 products live
Conventional
25% down · 7.5% · 30yr
- Down + closing
- —
- Monthly P&I
- —
- Monthly cashflow
- —
- DSCR
- —
- Eligible?
- —
Personal DTI + credit; lowest rate.
DSCR
20% down · 8.5% · 30yr
- Down + closing
- —
- Monthly P&I
- —
- Monthly cashflow
- —
- DSCR
- —
- Eligible?
- —
No personal income docs; deal must DSCR.
Hard money
10% down · 12.0% · 12mo
- Down + closing
- —
- Monthly P&I
- —
- Monthly cashflow
- —
- DSCR
- —
- Eligible?
- —
Short-term bridge; refi at stabilization.
Rent comps 1 comps
| Address | Beds | Baths | Sqft | Rent | $/sqft | DOM | Units | Dist |
|---|---|---|---|---|---|---|---|---|
| 601 NE 1st Ave Unit 1227496P Miami, FL | 3.0 | 1.0–3.0 | 904 | $8,354 | $9.24 | 1d | 4 | 0.46mi |
HOA detail condo
- Monthly dues
- $684 · $8,208/yr
- Likely covers
- poolgym
- Assessments
- None detected in remarks — confirm with the listing agent.
Listing history 29 events
-
2026-06-22days on market $304,500 Active 99 DOM
-
2026-06-21days on market $304,500 Active 98 DOM
-
2026-06-18days on market $304,500 Active 95 DOM
-
2026-06-17days on market $304,500 Active 94 DOM
-
2026-06-16days on market $304,500 Active 93 DOM
-
2026-06-15days on market $304,500 Active 92 DOM
-
2026-06-13statusdays on market $304,500 Active 90 DOM
-
2026-06-08status $304,500 Pending 88 DOM
-
2026-06-07days on market $304,500 Active 88 DOM
-
2026-06-04days on market $304,500 Active 85 DOM
-
2026-06-03days on market $304,500 Active 84 DOM
-
2026-06-02days on market $304,500 Active 83 DOM
-
2026-06-01days on market $304,500 Active 82 DOM
-
2026-05-31days on market $304,500 Active 81 DOM
-
2026-04-14price $304,500
-
2026-03-06historical $2,250
-
2026-03-06$2,250
-
2025-11-13$309,500 Active
-
2025-11-07historical
-
2025-03-11historical $2,200
-
2025-01-22historical $2,200
-
2024-12-28price $2,200
-
2024-12-19$2,250
-
2024-12-07historical $2,250
-
2024-12-03$2,250
-
2024-11-19$2,400
-
2024-11-19historical $2,400
-
2024-11-14$2,400
-
2024-11-14$324,900
ⓘ Source: listings_history table (triggers on properties + properties_extension) + one-shot
backfill from property_details.listing_events for pre-trigger history.
Tax reassessment forecast FL · Resets to sale price
- Current annual tax
- $4,573 · $381/mo
- Projected year-2 tax
- $4,573 · $381/mo
- Expected delta
- $0/yr ($0/mo · 0.0%)
ⓘ Screening estimate from a state-policy table — verify with the county assessor before closing.
Climate risk First Street
- Flood 5/10 Major FEMA zone X (unshaded) · 50% chance over 30 yrs
- Wildfire 1/10 Low
- Heat 10/10 Extreme 4 d/yr ≥103°F today · 15 d/yr by 30 yrs out
- Wind 10/10 Extreme 99% chance of damaging wind over 30 yrs
- Air quality 2/10 Low 1 unhealthy d/yr today · 1 by 30 yrs out
Nearby sold comps map
Loading sold comps map…
Walkable amenities ~0.75 mi
Loading nearby amenities…
Taxation est. · year 1
- Rental income
- $46,635
- − Mortgage interest
- −$17,057
- − Property taxes
- −$4,573
- − Insurance
- −$1,522
- − Repairs & maintenance
- −$3,731
- − Management
- −$3,731
- − HOA
- −$8,208
- − Depreciation
- −$8,858
- Taxable loss
- −$1,045
- Est. tax savings @ 24.0%
- +$251
- After-tax cash flow
- $3,627/yr
For passive investors: Depreciation is non-cash, so a rental often shows a tax loss while cash-flowing — sheltering income. Rental losses are passive: they offset passive income freely, and up to $25,000/yr can offset ordinary (W-2) income if you actively participate and your MAGI is under $100k (phasing out to $0 by $150k); unused losses carry forward. On sale, claimed depreciation is recaptured at up to 25%, and gains may owe capital-gains tax (a 1031 exchange can defer both). Figures are a year-1 estimate at your 24.0% rate — not tax advice; consult a CPA.
Schools (NCES district)
- District
- Miami-Dade
- NCES district ID
- 1200390
- Math proficiency
- 45% ▼ -16.00%
- Reading proficiency
- 54% ▼ -5.00%
- Median HH income
- $43,928
- Composite
- 41.76/100
- National rank
- #3397
- State rank
- #40 of 73 in FL
Livability — Miami
- Score
- 78/100
- State rank
- #177
- US rank
- #2724
Category grades
Schools grade is shown separately in the Schools card above.
Census & demographics
- Census place
- Miami, FL
- County
- Miami-Dade County · 2,697,751 people
- City population
- 827,308
- Metro
- Miami-Fort Lauderdale-Pompano Beach, FL
- Population (ZIP)
- 23,095
- Household income
- $144,138
- Rent vs Own
- Severe rent burden
- 1866.0
Population outlook (Miami-Dade County) Hauer SSP2
- Today (2025)
- 3,126,439 people
- By 2030
- 3,325,765 · +6.4%
- By 2040
- 3,697,561 · +18.3%
- By 2050
- 4,012,134 · +28.3%
- By 2075
- 4,605,612 · +47.3%
- By 2100
- 4,866,598 · +55.7%
Race, ethnicity, and origin ACS 2023
- Neighborhood character
- Diverse neighborhood (Simpson 0.61)
- Race & ethnicity
- Hispanic / Latino 52% Two or more races 35% White 33% Asian 4% Black 4%
- Hispanic origin (detail)
- Mexican 4% Puerto Rican 4% Cuban 8% Dominican 1% Salvadoran 3%
- Common ancestry
- Romanian 2% Scotch-Irish 2% Estonian 2%
- Foreign-born
- 54% · Canada, Jamaica, Dominican Republic
- Languages at home
- 30% English-only · Spanish 53% Other Indo-European 6% French/Haitian/Cajun 4%
Political lean MEDSL · Miami-Dade
- 2024 margin
- R (+11.4) · D 43.9% · R 55.4%
- 2008→2024 swing
- -27.6pp toward R · 2008: 16.1pp · 2024: -11.4pp
- All cycles
- 2024: R+11.4 2020: D+7.3 2016: D+29.6 2012: D+23.7 2008: D+16.1
Not yet ingested
- Civics
- —
Market trends
- HPI YoY
- ▼ -2.09%
- Current HPI
- 281.1156
- Rent YoY
- ▲ 2.04%
- Metro
- Miami-Fort Lauderdale-Pompano Beach, FL
- State GDP YoY
- ▲ 3.28%
- F500 in state
- 36
Industry mix (Fortune 500 HQ in FL)
| Industry | F500 HQs | Revenue |
|---|---|---|
| Industrial Technology | 2 | $29B |
|
||
| Insurance | 2 | $17B |
|
||
| Retail | 1 | $60B |
|
||
| Technology Distribution | 1 | $58B |
|
||
| Homebuilding | 1 | $35B |
|
||
| Technology Manufacturing | 1 | $35B |
|
||
Price history
-6.3% since first listed15 events — show timeline
- 2026-04-14 Price Changed $304,500 Beaches MLS
- 2026-03-06 Rental Removed $2,250 GFLMLS
- 2026-03-06 Listed for Rent $2,250 GFLMLS
- 2025-11-13 Listed $309,500 Beaches MLS
- 2025-11-07 Listing Removed — Beaches MLS
- 2025-03-11 Rental Removed $2,200 VLS
- 2025-01-22 Rental Removed $2,200 GFLMLS
- 2024-12-28 Price Changed $2,200 GFLMLS
- 2024-12-19 Listed for Rent $2,250 VLS
- 2024-12-07 Rental Removed $2,250 VLS
- 2024-12-03 Listed for Rent $2,250 GFLMLS
- 2024-11-19 Listed for Rent $2,400 VLS
- 2024-11-19 Rental Removed $2,400 GFLMLS
- 2024-11-14 Listed for Rent $2,400 GFLMLS
- 2024-11-14 Listed $324,900 Beaches MLS
Property tax history
+38.7%/yrLatest (2025): $4,573 · +5.0% YoY. Source: county tax records.
Cash-flow waterfall
monthlySold comps — $/sqft
last 12 mo · ≤1 miLoading sold comps…