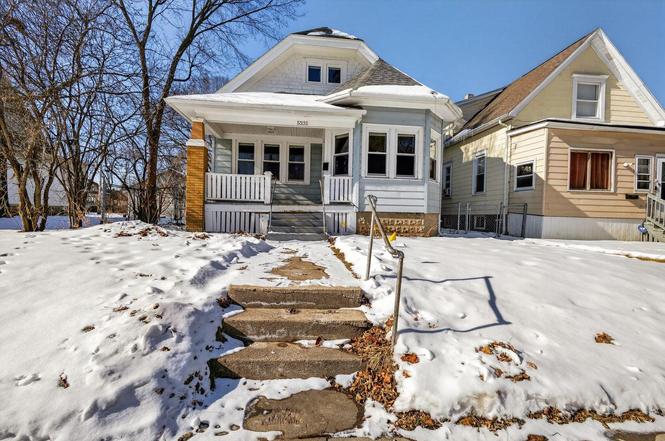
5331 N 37th St · Milwaukee, WI
Flood risk 1/10 · Minimal
- FEMA flood zone
- X (unshaded)
- Chance of flooding over 30 yrs
- 0.0%
- Est. flood insurance / yr
- $473 – $860
Fire risk 1/10 · Minimal
- Est. fire insurance / yr
- $636 – $1,182
Heat risk 2/10 · Minimal
- Hot days now (above 98°F)
- 7 days/yr
- Hot days in 30 yrs
- 13 days/yr
Wind risk 2/10 · Minimal
- Chance of severe wind over 30 yrs
- —
Air-quality risk 2/10 · Minimal
- Unhealthy air days now
- 2 days/yr
- Unhealthy air days in 30 yrs
- 2 days/yr
Risk factors via First Street. Map © Google.
Why this score? — see what drove the D grade
The composite is a weighted blend of 9 inputs, each scored 0–100. Each bar is that input's sub-score; the figure is the points it added to the 100-point composite (weight × sub-score).
- Cash flow +11.8/30.0
- ARV discount +6.9/15.0
- 1% rule +6.2/10.0
- Rent growth +4.7/5.0
- Livability +4.0/5.0
- DSCR +3.5/10.0
- Condition / age +2.5/5.0
- Schools +1.2/10.0
- Appreciation +0.0/10.0
$134,900
🖨 Deal sheet (PDF) 📄 Offer letter ✓ Due diligence
Listing remarks MLS
Great home for a growing family! Same owner for many years. Beautiful BICC, HWF's--lot's of uncovered potential just waiting for your cosmetic upgrades! Two bedrooms upstairs are walk-throughs. Attic storage and very functional basement too! This estate sale also includes a stove, refrigerator, washer, dryer, pool table, and ping-pong table. THIS IS A STEAL!! MUST SELL--MAKE OFFER--INSTANT EQUITY!
Key facts
- Spacious pantry
- Arched doorways
- Updated kitchen
Tags
Neighborhood map
What this means for you Summary
Snapshot
- This is a 3-bed/1.0-bath single-family listed at $135k.
Deal economics
- At list price, monthly cash flow is $-37 ($-440/yr) — negative.
- To cash-flow at today's rent, offer at most $128k (4.8% below list).
- Meets the 1% rule at list price ($2k rent vs $135k).
- Recommended offer: $127k (6.0% below list) — sets the bar for market timing.
Location & tenants
- Location reads 81/100 on livability (#55 in WI, #1,534 nationally) — a professional / high-income tenant draw. Strengths: amenities A+, commute A+, cost of living A+; Watch: employment D+, schools F, crime F.
- Milwaukee School District (urban): math 10% / reading 18% proficiency, ranked #337 of 342 in WI (top 98%) — low school quality limits family demand, transient renter base, plan for 1-2y turnover; 77% free/reduced lunch — lower-income household profile, screen leases tightly.
- Market conditions: Rents rising fast (+8.6%/yr); 168 active listings in the ZIP; 20 comparable units currently listed for rent nearby; rentals at typical pace (median 25d on market — plan ~3-4 weeks tenant-placement turnaround); 1,017 units permitted in Milwaukee County in 2024 (803 in 5+ unit buildings).
- This rent runs 37% of the median local income ($48k/yr) — at the standard rent-burdened threshold; future hikes will face affordability resistance.
Forward outlook
- Local home prices are declining (-3.0%/yr); year-one equity from $933 of loan paydown is wiped out by about $4k of value loss. Plan a longer hold.
- Milwaukee County population projected at +4% by 2050 — modest demand growth; plan on rents tracking national, not racing it.
Negotiation context
- It's been on market 70 days — a 6% lower offer ($127k) is reasonable based on typical stale-listing flexibility.
- Current owner paid $75k; list at $135k implies a 80% gain — meaningful room to come down on a strong offer.
Risks & watch-outs
- Watch-outs: property tax is 4.2% of price; built in 1929 — expect roof / HVAC / electrical / plumbing capex.
Questions for the listing agent
- What do current leases actually rent for vs. the listed asking? Can we see a recent rent roll and the last 12 months of T-12 income?
- It's been on market 70 days. Have you received any prior offers? Is the seller open to a 6% concession, seller financing, or rate buy-down credit?
- Built in 1929 — when were the roof, HVAC, electrical panel, plumbing, and water heater last replaced?
- Property tax is high relative to price — has the assessment been appealed recently, and will the sale trigger a re-assessment?
- Why hasn't it sold? Are there any deal-killer items the seller is aware of (foundation, flood, title, zoning, code violations)?
- Is there a deadline driving the sale (1031 exchange, divorce, estate, relocation)? That informs how much negotiation room exists.
- Schools are F-rated, which usually means shorter tenancies and higher turnover. Who's the typical renter profile here, and what's been the actual vacancy rate?
- Crime grade is F in this area — have there been break-ins, vandalism, or insurance claims at this property in the last 3 years? What carrier currently insures it and at what premium?
- The area grade is low — what's the realistic commute time and amenity access for the typical tenant pool here? Any planned neighborhood developments (good or bad) we should know about?
- What's the average days-on-market for RENTAL listings here right now (not sales)? A rising rental-DOM trend means longer vacancies and softer asking-rent achievability than the comps imply.
- What's the recent tenant-quality profile in this submarket — average credit score on applications, eviction rate, late-payment / NSF rate, and stable-employment percentage? A property-management company in the area should have these aggregated.
- How much new for-sale + rental construction is in the pipeline within 1–3 miles? Heavy new supply typically softens prices + rents 12–24 months out; constrained supply supports both.
Investment metrics
- 1% rule
- 1.12% ✓
- Cap rate
- 5.97%
- Cash-on-cash
- -1.16%
- DSCR
- 0.95
- GRM
- 7.4
CMA / ARV
- ARV (on-the-fly)
- $133,212
- Comps found
- 12
Show comp detail 12 sales within ~0.75 mi
| Address | Dist | Beds/Ba | Sqft | Sold | Price | $/sf | Match |
|---|---|---|---|---|---|---|---|
| 5331 N 37th St | 0.00mi | 3/1.0 | 1,306 (0%) | 0mo | $133,000 | $102 | 100 |
| 5324 N 34th St | 0.21mi | 4/1.0 (+1) | 1,324 (+1%) | 2mo | $75,000 | $57 | 81 |
| 5378 N 36th St | 0.11mi | 4/2.0 (+1) | 1,345 (+3%) | 1mo | $165,000 | $123 | 80 |
| 5460 N 37th St | 0.17mi | 3/1.0 | 1,436 (+10%) | 2mo | $125,000 | $87 | 74 |
| 4926 N 37th St | 0.51mi | 3/1.0 | 1,357 (+4%) | 2mo | $138,500 | $102 | 68 |
| 5549 N 33rd St | 0.37mi | 3/2.5 | 1,241 (-5%) | 3mo | $176,000 | $142 | 66 |
| 3223 W Fairmount Ave | 0.52mi | 4/1.0 (+1) | 1,358 (+4%) | 3mo | $124,000 | $91 | 61 |
| 5403 N 37th St | 0.09mi | 4/1.5 (+1) | 1,498 (+15%) | 4mo | $129,000 | $86 | 61 |
| 5324 N 49th St | 0.73mi | 3/1.0 | 1,269 (-3%) | 1mo | $130,000 | $102 | 61 |
| 5730 N 35th St | 0.55mi | 2/1.0 (-1) | 1,216 (-7%) | 4mo | $162,000 | $133 | 55 |
| 5876 N 42nd St | 0.74mi | 4/1.5 (+1) | 1,283 (-2%) | 4mo | $140,000 | $109 | 52 |
| 3207 W Oriole Dr | 0.69mi | 3/1.0 | 1,194 (-9%) | 4mo | $179,000 | $150 | 50 |
Match score weights: distance 35% · size 25% · config 20% · recency 20%. Top-matched comps best support the ARV.
Projected returns pro-forma
-3.0% appreciation · 8.0% rent growth · sell at horizon
- IRR
- -11.0%
- Equity multiple
- 0.58×
- Total profit
- $-15,981
- Equity at exit
- $20,114
- IRR
- 5.7%
- Equity multiple
- 1.54×
- Total profit
- $20,356
- Equity at exit
- $11,664
Cash invested: $37,772 (down + closing). Projections, not guarantees.
Landlord ↔ Tenant lean methodology
- Overall (STATE)
- 73 Landlord-Friendly
- State Wisconsin
- 73 Landlord-Friendly · R+2
- County
- — inherits STATE
- City
- — inherits STATE
ZIP-level market 53209
- Rents YoY
- 8.6%
- Active inventory
- 168
- Price-to-rent
- 7.4×
Monthly cashflow live
- Estimated rent
- $1,515 high interval (Pro) →
- Mortgage (P&I)
- −$707
- Tax from tax record
- −$470 /mo · $5,635/yr
- Insurance
- −$56
- HOA
- −$0
- Vacancy / Maint / Mgmt
- −$318
- Net cashflow
- $-37
Break-even live
Sensitivity live
| Price | -10% $40 | -5% $2 | +0% $-37 | +5% $-75 | +10% $-113 |
|---|---|---|---|---|---|
| Rent | -10% $-156 | -5% $-96 | +0% $-37 | +5% $23 | +10% $83 |
| Rate | -1.0pp $31 | -0.5pp $-2 | base $-37 | +0.5pp $-72 | +1.0pp $-107 |
UW: 25.0% down · 7.5% · 30yr · 1.5% tax · 5.0% vac · 8.0% maint · 8.0% mgmt
Financing live
Cash to close
- Down payment
- $33,725
- Closing costs
- $4,047
- Reserves months
- —
- Total cash needed
- —
Loan-product check · same deal, 3 products live
Conventional
25% down · 7.5% · 30yr
- Down + closing
- —
- Monthly P&I
- —
- Monthly cashflow
- —
- DSCR
- —
- Eligible?
- —
Personal DTI + credit; lowest rate.
DSCR
20% down · 8.5% · 30yr
- Down + closing
- —
- Monthly P&I
- —
- Monthly cashflow
- —
- DSCR
- —
- Eligible?
- —
No personal income docs; deal must DSCR.
Hard money
10% down · 12.0% · 12mo
- Down + closing
- —
- Monthly P&I
- —
- Monthly cashflow
- —
- DSCR
- —
- Eligible?
- —
Short-term bridge; refi at stabilization.
Rent comps 20 comps
| Address | Beds | Baths | Sqft | Rent | $/sqft | DOM | Units | Dist |
|---|---|---|---|---|---|---|---|---|
| 5237 N 34th St Unit 5237 Lower Milwaukee, WI | 2.0 | 1.0 | 956 | $1,350 | $1.41 | 24d | 1 | 0.20mi |
| 5541 N 35th St #5543 Milwaukee, WI | 3.0 | 1.0 | 1130 | $1,195 | $1.06 | 5d | 1 | 0.33mi |
| 5032 N 32nd St Milwaukee, WI | 3.0 | 2.0 | 1089 | $1,750 | $1.61 | 13d | 1 | 0.47mi |
| 4334 W Eggert Pl Milwaukee, WI | 4.0 | 1.0 | 1077 | $1,695 | $1.57 | 24d | 1 | 0.48mi |
| 4340 W Eggert Pl Milwaukee, WI | 4.0 | 1.0 | 1066 | $1,695 | $1.59 | 24d | 1 | 0.49mi |
| 5165-5167 N 45th St Unit 5165 Milwaukee, WI | 3.0 | 1.0 | 1020 | $1,200 | $1.18 | 17d | 1 | 0.55mi |
| 5696 N 42nd St Milwaukee, WI | 4.0 | 1.0 | 1023 | $1,495 | $1.46 | 24d | 1 | 0.57mi |
| 5050 N 47th St Milwaukee, WI | 2.0 | 1.0 | 1092 | $1,700 | $1.56 | 44d | 1 | 0.69mi |
| 5884 N 35th St Milwaukee, WI | 2.0 | 1.0 | 1200 | $1,500 | $1.25 | 44d | 1 | 0.76mi |
| 5073 N 48th St Milwaukee, WI | 4.0 | 1.0 | 1152 | $1,595 | $1.38 | 15d | 1 | 0.76mi |
| 4661 N 38th St Unit 4661 Milwaukee, WI | 2.0 | 1.0 | 1000 | $845 | $0.84 | 15d | 1 | 0.82mi |
| 4702 N 44th St Milwaukee, WI | 3.0 | 2.0 | 1050 | $1,850 | $1.76 | 44d | 1 | 0.90mi |
| 4703 N 45th St Milwaukee, WI | 3.0 | 1.0 | 1031 | $1,695 | $1.64 | 24d | 1 | 0.94mi |
| 4727 N 46th St Milwaukee, WI | 3.0 | 1.0 | 936 | $1,700 | $1.82 | 44d | 1 | 0.95mi |
| 3931 W Kaul Ave Milwaukee, WI | 3.0 | 1.0 | 1400 | $1,695 | $1.21 | 44d | 1 | 1.03mi |
| 4479A N 44th St Milwaukee, WI | 2.0 | 1.0 | 1000 | $895 | $0.90 | 44d | 1 | 1.15mi |
| 4640 N 51st Blvd Milwaukee, WI | 2.0 | 1.0 | 1075 | $1,275 | $1.19 | 44d | 1 | 1.23mi |
| 4355 N 28th St Milwaukee, WI | 2.0 | 1.0 | 1118 | $975 | $0.87 | 22d | 1 | 1.33mi |
| 4900 N 58th St Milwaukee, WI | 3.0 | 1.0 | 1455 | $1,450 | $1.00 | 5d | 1 | 1.40mi |
| 5657 N 60th St #5659 Milwaukee, WI | 3.0 | 1.0 | 878 | $995 | $1.13 | 17d | 1 | 1.47mi |
Listing history 9 events
-
2026-04-22status Pending
-
2026-04-02price $134,900
-
2026-03-27price $139,900
-
2026-03-06price $144,900
-
2026-02-10$149,900 Active
-
2021-08-16soldstatus $75,000
-
2007-10-05soldstatus $74,000
-
2007-10-03soldstatus $74,000 400-char remark
Show marketing remark (400 chars)
Great home for a growing family! Same owner for many years. Beautiful BICC, HWF's--lot's of uncovered potential just waiting for your cosmetic upgrades! Two bedrooms upstairs are walk-throughs. Attic storage and very functional basement too! This estate sale also includes a stove, refrigerator, washer, dryer, pool table, and ping-pong table. THIS IS A STEAL!! MUST SELL--MAKE OFFER--INSTANT EQUITY!
-
2006-12-15soldstatus $108,900 324-char remark
Show marketing remark (324 chars)
Charming bungalow with sunroom, hardwood floors, and builtin china cabinet in dining room. Estate sale. Sold as is. Seller will leave stove, refrigerator, washer, dryer, pool table, and pingpong table. Two walk through bedrooms upstairs. Lots of attic storage. Room sizes are estimated. Seller may assist with closing costs.
ⓘ Source: listings_history table (triggers on properties + properties_extension) + one-shot
backfill from property_details.listing_events for pre-trigger history.
Tax reassessment forecast WI · Partial reset (capped growth)
- Current annual tax
- $5,635 · $470/mo
- Projected year-2 tax
- $5,635 · $470/mo
- Expected delta
- $0/yr ($0/mo · 0.0%)
ⓘ Screening estimate from a state-policy table — verify with the county assessor before closing.
Climate risk First Street
- Flood 1/10 Low FEMA zone X (unshaded) · 0% chance over 30 yrs
- Wildfire 1/10 Low
- Heat 2/10 Low 7 d/yr ≥98°F today · 13 d/yr by 30 yrs out
- Wind 2/10 Low
- Air quality 2/10 Low 2 unhealthy d/yr today · 2 by 30 yrs out
Nearby sold comps map
Loading sold comps map…
Walkable amenities ~0.75 mi
Loading nearby amenities…
Taxation est. · year 1
- Rental income
- $18,176
- − Mortgage interest
- −$7,556
- − Property taxes
- −$5,635
- − Insurance
- −$674
- − Repairs & maintenance
- −$1,454
- − Management
- −$1,454
- − Depreciation
- −$3,924
- Taxable loss
- −$2,523
- Est. tax savings @ 24.0%
- +$605
- After-tax cash flow
- $166/yr
For passive investors: Depreciation is non-cash, so a rental often shows a tax loss while cash-flowing — sheltering income. Rental losses are passive: they offset passive income freely, and up to $25,000/yr can offset ordinary (W-2) income if you actively participate and your MAGI is under $100k (phasing out to $0 by $150k); unused losses carry forward. On sale, claimed depreciation is recaptured at up to 25%, and gains may owe capital-gains tax (a 1031 exchange can defer both). Figures are a year-1 estimate at your 24.0% rate — not tax advice; consult a CPA.
Schools (NCES district)
- District
- Milwaukee School District
- NCES district ID
- 5509600
- Math proficiency
- 10% ▼ -5.00%
- Reading proficiency
- 18% ▬ 0.00%
- Median HH income
- $36,339
- Composite
- 11.61/100
- National rank
- #9696
- State rank
- #337 of 342 in WI
Livability — Milwaukee
- Score
- 81/100
- State rank
- #55
- US rank
- #1534
Category grades
Schools grade is shown separately in the Schools card above.
Census & demographics
- Census place
- Milwaukee, WI
- County
- Milwaukee County · 926,379 people
- City population
- 573,768
- Metro
- Milwaukee-Waukesha, WI
- Population (ZIP)
- 45,170
- Household income
- $48,486
- Rent vs Own
- Severe rent burden
- 3390.0
Population outlook (Milwaukee County) Hauer SSP2
- Today (2025)
- 995,758 people
- By 2030
- 1,009,124 · +1.3%
- By 2040
- 1,028,128 · +3.3%
- By 2050
- 1,040,066 · +4.4%
- By 2075
- 1,057,849 · +6.2%
- By 2100
- 1,039,774 · +4.4%
Race, ethnicity, and origin ACS 2023
- Neighborhood character
- Predominantly Black (66%)
- Race & ethnicity
- Black 66% White 22% Hispanic / Latino 5% Two or more races 5% Asian 2%
- Hispanic origin (detail)
- Mexican 2% Puerto Rican 3%
- Common ancestry
- Romanian 3% Portuguese 1% Iranian 1%
- Foreign-born
- 3% · Canada
- Languages at home
- 92% English-only · Spanish 4% Other Asian/Pacific 1% Russian/Polish/Slavic 1%
Political lean MEDSL · Milwaukee
- 2024 margin
- Solid D (+38.5) · D 68.3% · R 29.8% · Other 1.8%
- 2008→2024 swing
- +2.7pp toward D · 2008: 35.9pp · 2024: 38.5pp
- All cycles
- 2024: D+38.5 2020: D+39.9 2016: D+37.5 2012: D+34.6 2008: D+35.9
Not yet ingested
- Civics
- —
Market trends
- HPI YoY
- ▼ -194.98%
- Current HPI
- 172.4275
- Rent YoY
- ▲ 8.61%
- Metro
- Milwaukee-Waukesha, WI
- State GDP YoY
- ▲ 2.10%
- F500 in state
- 20
Industry mix (Fortune 500 HQ in WI)
| Industry | F500 HQs | Revenue |
|---|---|---|
| Industrial Machinery | 4 | $23B |
|
||
| Industrial Technology | 2 | $36B |
|
||
| Insurance | 1 | $36B |
|
||
| Professional Services | 1 | $19B |
|
||
| Utilities | 1 | $9B |
|
||
| Consumer Goods | 1 | $3B |
|
||
Price history
+23.9% since first listed9 events — show timeline
- 2026-04-22 Pending — METROMLS
- 2026-04-02 Price Changed $134,900 METROMLS
- 2026-03-27 Price Changed $139,900 METROMLS
- 2026-03-06 Price Changed $144,900 METROMLS
- 2026-02-10 Listed $149,900 METROMLS
- 2021-08-16 Sold (Public Records) $75,000 Public Records
- 2007-10-05 Sold (Public Records) $74,000 Public Records
- 2007-10-03 Sold (MLS) $74,000 METROMLS
- 2006-12-15 Sold (MLS) $108,900 METROMLS
Property tax history
+12.5%/yrLatest (2024): $5,635 · +150.5% YoY. Source: county tax records.
Cash-flow waterfall
monthlySold comps — $/sqft
last 12 mo · ≤1 miLoading sold comps…