 Multi-family
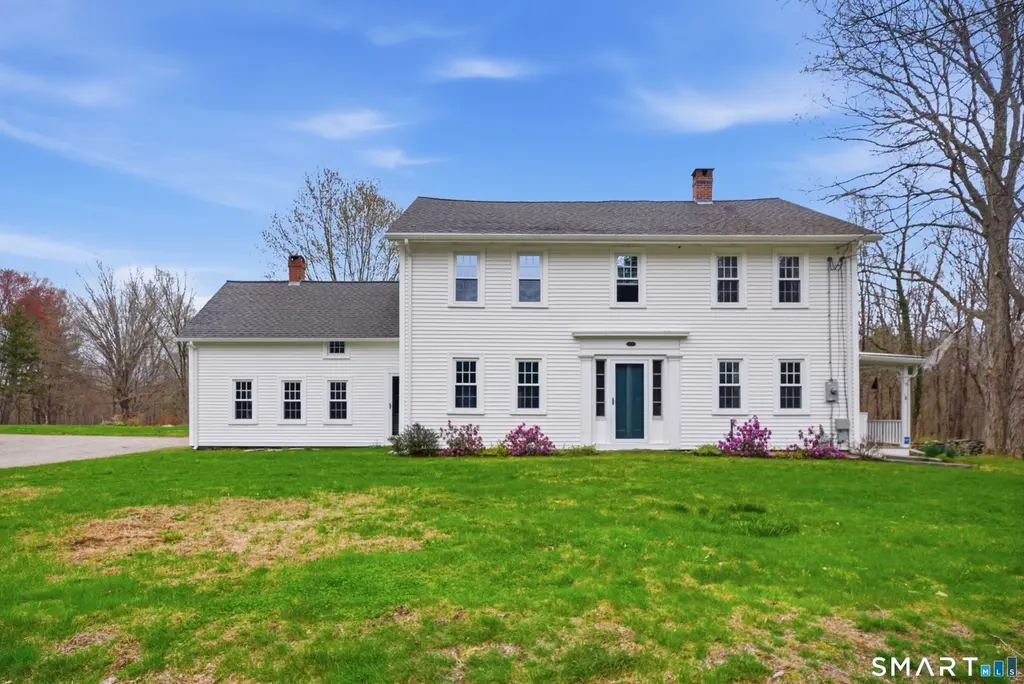
18 Bates Rd · Mansfield Center, CT
Flood risk 1/10 · Minimal
- FEMA flood zone
- X
- Chance of flooding over 30 yrs
- 0.0%
- Est. flood insurance / yr
- $507 – $1,088
Fire risk 4/10 · Minor
- Est. fire insurance / yr
- $829 – $1,539
Heat risk 4/10 · Minor
- Hot days now (above 95°F)
- 7 days/yr
- Hot days in 30 yrs
- 15 days/yr
Wind risk 6/10 · Moderate
- Chance of severe wind over 30 yrs
- 50.0%
Air-quality risk 3/10 · Minor
- Unhealthy air days now
- 3 days/yr
- Unhealthy air days in 30 yrs
- 4 days/yr
Risk factors via First Street. Map © Google.
Why this score? — see what drove the C grade
The composite is a weighted blend of 9 inputs, each scored 0–100. Each bar is that input's sub-score; the figure is the points it added to the 100-point composite (weight × sub-score).
- Cash flow +17.7/30.0
- ARV discount +7.5/15.0
- Appreciation +6.9/10.0
- DSCR +5.5/10.0
- 1% rule +5.0/10.0
- Schools +4.8/10.0
- Livability +3.8/5.0
- Rent growth +2.5/5.0
- Condition / age +2.5/5.0
$539,000
🖨 Deal sheet 📄 Offer letter ✓ Due diligence
Multi-family units
County records classify this as Multi-Family (2-4 Unit). Listing-text estimate: 1 unit. estimate disagrees with records
Listing remarks
Step into history with this beautifully updated antique Colonial, originally built in 1785, offering timeless charm with modern updates throughout. A standout feature is the fully equipped in-law suite, complete with its own kitchen, living room, bedroom, full bathroom, and washer/dryer- perfect for multigenerational living, guests, or potential rental income. The property also features a new detached 2 car garage, an insulated barn with electricity, and an additional large barn with newer roof ready for your finishing touches. Enjoy the peaceful setting surrounded by non-buildable land and scenic river views from your back porch.
Key facts
- 1.6 acre lot
- 2 garage spots
- Built 1785
Neighborhood map
What this means for you Summary
Snapshot
- This is a 5-bed/3.5-bath multifamily listed at $539k.
Deal economics
- At list price, monthly cash flow is $432 ($5k/yr) — positive.
- The deal already cash-flows at list — no discount required.
- To meet the 1% rule (rent ≥ 1% of price), the offer needs to be $538k (0.2% below list).
- Recommended offer: $538k (0.2% below list) — sets the bar for 1% rule.
Location & tenants
- Location reads 76/100 on livability (#54 in CT, #3,465 nationally) — a middle-class / working-renter tenant base. Strengths: crime A+, employment A+, housing A+; Watch: health & safety D+, amenities F.
- Regional School District 11 (rural): math 40% / reading 65% proficiency, ranked #118 of 192 in CT (top 62%) — acceptable for families but not a draw, mixed tenant base, ~2y average lease.
- Zoned schools: Parish Hill High School (math 47% / reading 62%, grade C-, #63 of 194 statewide, top 39%, 220 students, 38% FRL) — zoned schools average 38% FRL vs 22% district-wide (16 pts higher); higher-poverty schools than district average — tighter screening recommended.
- Market conditions: 13 active listings in the ZIP; 149 units permitted in Northeastern Connecticut Planning Region in 2024 (0 in 5+ unit buildings).
Forward outlook
- In year one you build about $25k of equity ($4k loan paydown + $21k appreciation (3.9% local appreciation)).
- At projected returns (3.9% appreciation + 3.0% rent growth), your $151k cash investment doubles in ~5 years — after that, you're playing with house money.
- By year 2, paydown + projected appreciation supports a ~$40k cash-out refi (75% LTV) — recoverable capital for the next deal without selling this one.
Negotiation context
- Only 5 days on market — expect competitive offers; lowballing is unlikely to land.
Risks & watch-outs
- Watch-outs: built in 1785 — expect roof / HVAC / electrical / plumbing capex.
- Climate carrying-cost: major wind risk, 50% chance of damaging wind over 30y — expect insurance premiums to compound above CPI over the hold.
Questions for the listing agent
- Built in 1785 — when were the roof, HVAC, electrical panel, plumbing, and water heater last replaced?
- Is there a deadline driving the sale (1031 exchange, divorce, estate, relocation)? That informs how much negotiation room exists.
- Schools are A-rated — typically a magnet for longer-tenancy family renters. What's the average tenant stay here, and is there a school-zone premium baked into asking?
- What's the average days-on-market for RENTAL listings here right now (not sales)? A rising rental-DOM trend means longer vacancies and softer asking-rent achievability than the comps imply.
- What's the recent tenant-quality profile in this submarket — average credit score on applications, eviction rate, late-payment / NSF rate, and stable-employment percentage? A property-management company in the area should have these aggregated.
- How much new apartment / multifamily construction is in the pipeline within 1–3 miles? Heavy new supply (>2% of stock underway) typically softens rents 12–24 months out; light construction supports rent growth.
Investment metrics
- 1% rule
- 1.00% ✗
- Cap rate
- 7.25%
- Cash-on-cash
- 3.43%
- DSCR
- 1.15
- GRM
- 8.4
CMA / ARV
No comps found within radius.
Projected returns pro-forma
3.88% appreciation · 3.0% rent growth · sell at horizon
- IRR
- 13.0%
- Equity multiple
- 1.78×
- Total profit
- $118,101
- Equity at exit
- $269,513
- IRR
- 14.5%
- Equity multiple
- 3.33×
- Total profit
- $351,751
- Equity at exit
- $437,832
Cash invested: $150,920 (down + closing). Projections, not guarantees.
Landlord ↔ Tenant lean methodology
- Overall (STATE)
- 27 Tenant-Leaning
- State Connecticut
- 27 Tenant-Leaning · D+7
- County
- — inherits STATE
- City
- — inherits STATE
ZIP-level market 06235
- Home prices YoY
- 1.4%
- Active inventory
- 13
- Price-to-rent
- 25.1×
Monthly cashflow live
- Estimated rent
- $5,378 medium interval (Pro) →
- Mortgage (P&I)
- −$2,827
- Tax from tax record
- −$766 /mo · $9,187/yr
- Insurance
- −$225
- HOA
- −$0
- Vacancy / Maint / Mgmt
- −$1,129
- Net cashflow
- $432
Break-even live
3-unit breakdown (identical units grouped — click to expand)
| Units | Beds | Baths | Est. rent |
|---|---|---|---|
| 3× units | 2 | 1 | $5,379 |
| #1 | 2 | 1 | $1,793 |
| #2 | 2 | 1 | $1,793 |
| #3 | 2 | 1 | $1,793 |
| Total (3 units) | $5,378 | ||
UW: 25.0% down · 7.5% · 30yr · 1.5% tax · 5.0% vac · 8.0% maint · 8.0% mgmt
Financing live
Cash to close
- Down payment
- $134,750
- Closing costs
- $16,170
- Reserves months
- —
- Total cash needed
- —
Loan-product check · same deal, 3 products live
Conventional
25% down · 7.5% · 30yr
- Down + closing
- —
- Monthly P&I
- —
- Monthly cashflow
- —
- DSCR
- —
- Eligible?
- —
Personal DTI + credit; lowest rate.
DSCR
20% down · 8.5% · 30yr
- Down + closing
- —
- Monthly P&I
- —
- Monthly cashflow
- —
- DSCR
- —
- Eligible?
- —
No personal income docs; deal must DSCR.
Hard money
10% down · 12.0% · 12mo
- Down + closing
- —
- Monthly P&I
- —
- Monthly cashflow
- —
- DSCR
- —
- Eligible?
- —
Short-term bridge; refi at stabilization.
Listing history 3 events
-
2026-04-28status Under Contract
-
2026-04-24$539,000 Active
-
2026-04-21historical $539,000
ⓘ Source: listings_history table (triggers on properties + properties_extension) + one-shot
backfill from property_details.listing_events for pre-trigger history.
Tax reassessment forecast CT · Partial reset (capped growth)
- Current annual tax
- $9,187 · $766/mo
- Projected year-2 tax
- $10,361 · $863/mo
- Expected delta
- +$1,174/yr (+$98/mo · 12.8%)
ⓘ Screening estimate from a state-policy table — verify with the county assessor before closing.
Climate risk First Street
- Flood 1/10 Low FEMA zone X · 0% chance over 30 yrs
- Wildfire 4/10 Moderate
- Heat 4/10 Moderate 7 d/yr ≥95°F today · 15 d/yr by 30 yrs out
- Wind 6/10 Major 50% chance of damaging wind over 30 yrs
- Air quality 3/10 Moderate 3 unhealthy d/yr today · 4 by 30 yrs out
Nearby sold comps map
Loading sold comps map…
Walkable amenities ~0.75 mi
Loading nearby amenities…
Taxation est. · year 1
- Rental income
- $64,536
- − Mortgage interest
- −$30,192
- − Property taxes
- −$9,187
- − Insurance
- −$2,695
- − Repairs & maintenance
- −$5,163
- − Management
- −$5,163
- − Depreciation
- −$15,680
- Taxable loss
- −$3,544
- Est. tax savings @ 24.0%
- +$851
- After-tax cash flow
- $6,033/yr
For passive investors: Depreciation is non-cash, so a rental often shows a tax loss while cash-flowing — sheltering income. Rental losses are passive: they offset passive income freely, and up to $25,000/yr can offset ordinary (W-2) income if you actively participate and your MAGI is under $100k (phasing out to $0 by $150k); unused losses carry forward. On sale, claimed depreciation is recaptured at up to 25%, and gains may owe capital-gains tax (a 1031 exchange can defer both). Figures are a year-1 estimate at your 24.0% rate — not tax advice; consult a CPA.
Schools (NCES district)
- District
- Regional School District 11
- NCES district ID
- 0903570
- Math proficiency
- 40% ▲ 5.00%
- Reading proficiency
- 65% ▲ 5.00%
- Median HH income
- $68,240
- Composite
- 48.47/100
- National rank
- #4638
- State rank
- #118 of 192 in CT
Livability — Mansfield Center
- Score
- 76/100
- State rank
- #54
- US rank
- #3465
Category grades
Schools grade is shown separately in the Schools card above.
Census & demographics
- City population
- 4,780
- Population (ZIP)
- 2,116
Population outlook (Northeastern Connecticut County) Hauer SSP2
- By 2040
- 104,160
Race, ethnicity, and origin ACS 2023
- Neighborhood character
- Predominantly White (87%)
- Race & ethnicity
- White 87% Two or more races 8% Hispanic / Latino 4% Asian 1%
- Common ancestry
- Lithuanian 18% Romanian 9% German 4%
- Foreign-born
- 3% · Canada, Dominican Republic
- Languages at home
- 95% English-only · Spanish 3% Other Indo-European 1% Russian/Polish/Slavic 1%
Political lean MEDSL · Northeastern Connecticut
- 2024 margin
- R (+15.4) · D 41.5% · R 57.0% · Other 1.5%
- All cycles
- 2024: R+15.4
Not yet ingested
- Civics
- —
Market trends
- HPI YoY
- ▲ 3.88%
- Current HPI
- 289.1609
- Rent YoY
- —
- Metro
- —
- State GDP YoY
- ▲ 1.06%
- F500 in state
- 38
Industry mix (Fortune 500 HQ in CT)
| Industry | F500 HQs | Revenue |
|---|---|---|
| Industrial Machinery | 4 | $38B |
|
||
| Insurance | 3 | $71B |
|
||
| Financial Services | 2 | $25B |
|
||
| Transportation / Logistics | 2 | $18B |
|
||
| Healthcare | 1 | $247B |
|
||
| Telecommunications | 1 | $55B |
|
||
Price history
+0.0% since first listed3 events — show timeline
- 2026-04-28 Pending — Smart MLS
- 2026-04-24 Listed $539,000 Smart MLS
- 2026-04-21 Coming Soon $539,000 Smart MLS
Property tax history
+0.6%/yrLatest (2023): $9,187 · +2.9% YoY. Source: county tax records.
Cash-flow waterfall
monthlySold comps — $/sqft
last 12 mo · ≤1 miLoading sold comps…