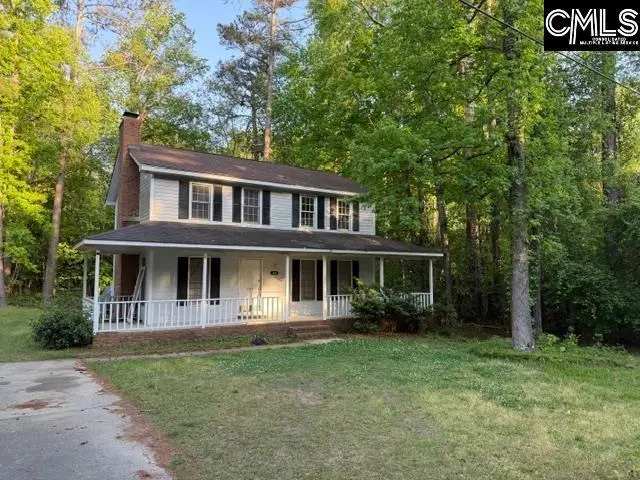
7504 Teague Rd · Capitol View, SC
Flood risk 1/10 · Minimal
- FEMA flood zone
- X (unshaded)
- Chance of flooding over 30 yrs
- 0.0%
- Est. flood insurance / yr
- $507 – $1,088
Fire risk 4/10 · Minor
- Est. fire insurance / yr
- $783 – $1,453
Heat risk 6/10 · Moderate
- Hot days now (above 108°F)
- 7 days/yr
- Hot days in 30 yrs
- 15 days/yr
Wind risk 7/10 · Major
- Chance of severe wind over 30 yrs
- 78.0%
Air-quality risk 3/10 · Minor
- Unhealthy air days now
- 2 days/yr
- Unhealthy air days in 30 yrs
- 2 days/yr
Risk factors via First Street. Map © Google.
Why this score? — see what drove the C grade
The composite is a weighted blend of 9 inputs, each scored 0–100. Each bar is that input's sub-score; the figure is the points it added to the 100-point composite (weight × sub-score).
- Cash flow +24.0/30.0
- ARV discount +8.1/15.0
- DSCR +7.7/10.0
- 1% rule +5.6/10.0
- Rent growth +3.0/5.0
- Schools +2.6/10.0
- Livability +2.5/5.0
- Condition / age +2.5/5.0
- Appreciation +0.0/10.0
$175,000
🖨 Deal sheet 📄 Offer letter ✓ Due diligence
Listing remarks
Looking for the right home that needs the right touch? Look no further than 7504 Teague Road in Southeast Columbia. This home is crawling with potential. If you are an investor looking for an opportunity to find the right home in a good market this is the one you need to check out. * * * * * * * * * * * * * * * * * * * * * * NOTE * * * * * * * * * * * * * * * * * * * * * * * * * * * * * * * * * * * * * * * * * THIS IS AN AS-IS SALE Disclaimer: CMLS has not reviewed and, therefore, does not endorse vendors who may appear in listings.
Key facts
- 0.32 acre lot
- Built 1988
- Listed 62 days
Property features AI
Exterior
- Utilities: Public water; Public sewer
- Home design: Two-story home
- Construction: Crawlspace foundation
- Exterior features: Wood Fiber-Masonite exterior finish; Paved road access
Interior
- Bedrooms: Primary bedroom on the main level
- Bathrooms: Two full bathrooms (one on the main level)
- Heating & cooling: Central cooling; Electric heating
- Interior features: One fireplace
Neighborhood map
What this means for you Summary
Snapshot
- This is a 3-bed/2.0-bath single-family listed at $175k.
Deal economics
- At list price, monthly cash flow is $343 ($4k/yr) — positive.
- The deal already cash-flows at list — no discount required.
- Meets the 1% rule at list price ($2k rent vs $175k).
- Recommended offer: $164k (6.0% below list) — sets the bar for market timing.
Location & tenants
- Location reads: area grade C — affects rentability + tenant quality, not the cash-flow math above.
- Richland 01 (urban): math 26% / reading 36% proficiency, ranked #54 of 80 in SC (top 68%) — families likely to look elsewhere, expect single-tenant / working-renter base with shorter leases; 64% free/reduced lunch — lower-income household profile, screen leases tightly.
- Zoned schools: Caughman Road Elementary (math 22% / reading 27%, grade F, #452 of 597 statewide, top 78%, 707 students, 100% FRL); Lower Richland High (math 5% / reading 64%, grade F, #185 of 196 statewide, top 94%, 1,244 students, 100% FRL) — zoned schools average 100% FRL vs 64% district-wide (36 pts higher); higher-poverty schools than district average — tighter screening recommended.
- Market conditions: Rents rising (+2.1%/yr); 295 active listings in the ZIP; 13 comparable units currently listed for rent nearby; rentals at typical pace (median 14d on market — plan ~3-4 weeks tenant-placement turnaround); 3,472 units permitted in Richland County in 2024 (1,096 in 5+ unit buildings).
- This rent runs 38% of the median local income ($59k/yr) — at the standard rent-burdened threshold; future hikes will face affordability resistance.
Forward outlook
- Local home prices are declining (-3.0%/yr); year-one equity from $1k of loan paydown is wiped out by about $5k of value loss. Plan a longer hold.
- Richland County population projected at +30% by 2050 — long-run rental-demand tailwind backs the buy-and-hold thesis.
Negotiation context
- It's been on market 62 days — a 6% lower offer ($164k) is reasonable based on typical stale-listing flexibility.
Risks & watch-outs
- Climate carrying-cost: major wind risk, 78% chance of damaging wind over 30y; extreme-heat days projected 7→15/yr by 2055 (HVAC capex compounding) — expect insurance premiums to compound above CPI over the hold.
Questions for the listing agent
- It's been on market 62 days. Have you received any prior offers? Is the seller open to a 6% concession, seller financing, or rate buy-down credit?
- Why hasn't it sold? Are there any deal-killer items the seller is aware of (foundation, flood, title, zoning, code violations)?
- Is there a deadline driving the sale (1031 exchange, divorce, estate, relocation)? That informs how much negotiation room exists.
- What's the average days-on-market for RENTAL listings here right now (not sales)? A rising rental-DOM trend means longer vacancies and softer asking-rent achievability than the comps imply.
- What's the recent tenant-quality profile in this submarket — average credit score on applications, eviction rate, late-payment / NSF rate, and stable-employment percentage? A property-management company in the area should have these aggregated.
- How much new for-sale + rental construction is in the pipeline within 1–3 miles? Heavy new supply typically softens prices + rents 12–24 months out; constrained supply supports both.
Investment metrics
- 1% rule
- 1.06% ✓
- Cap rate
- 8.64%
- Cash-on-cash
- 8.39%
- DSCR
- 1.37
- GRM
- 7.8
CMA / ARV
- ARV (on-the-fly)
- $177,408
- Comps found
- 3
Show comp detail 3 sales within ~0.75 mi
| Address | Dist | Beds/Ba | Sqft | Sold | Price | $/sf | Match |
|---|---|---|---|---|---|---|---|
| 3200 Downes | 0.31mi | 3/2.0 | 1,811 (+1%) | 21mo | $215,000 | $119 | 67 |
| 7901 Tradd St | 0.41mi | 3/2.5 | 1,612 (-10%) | 1mo | $160,000 | $99 | 62 |
| 10 Shadow Creek Ct | 0.65mi | 3/3.0 | 1,944 (+8%) | 7mo | $130,000 | $67 | 45 |
Match score weights: distance 35% · size 25% · config 20% · recency 20%. Top-matched comps best support the ARV.
Projected returns pro-forma
-3.0% appreciation · 2.08% rent growth · sell at horizon
- IRR
- -4.6%
- Equity multiple
- 0.83×
- Total profit
- $-8,260
- Equity at exit
- $26,093
- IRR
- 4.1%
- Equity multiple
- 1.28×
- Total profit
- $13,944
- Equity at exit
- $15,131
Cash invested: $49,000 (down + closing). Projections, not guarantees.
Landlord ↔ Tenant lean methodology
- Overall (STATE)
- 90 Strongly Landlord-Friendly
- State South Carolina
- 90 Strongly Landlord-Friendly · R+6
- County
- — inherits STATE
- City
- — inherits STATE
ZIP-level market 29209
- Rents YoY
- 2.1%
- Active inventory
- 295
- Price-to-rent
- 7.8×
Monthly cashflow live
- Estimated rent
- $1,863 high interval (Pro) →
- Mortgage (P&I)
- −$918
- Tax from tax record
- −$139 /mo · $1,664/yr
- Insurance
- −$73
- HOA
- −$0
- Vacancy / Maint / Mgmt
- −$391
- Net cashflow
- $343
Break-even live
UW: 25.0% down · 7.5% · 30yr · 1.5% tax · 5.0% vac · 8.0% maint · 8.0% mgmt
Financing live
Cash to close
- Down payment
- $43,750
- Closing costs
- $5,250
- Reserves months
- —
- Total cash needed
- —
Loan-product check · same deal, 3 products live
Conventional
25% down · 7.5% · 30yr
- Down + closing
- —
- Monthly P&I
- —
- Monthly cashflow
- —
- DSCR
- —
- Eligible?
- —
Personal DTI + credit; lowest rate.
DSCR
20% down · 8.5% · 30yr
- Down + closing
- —
- Monthly P&I
- —
- Monthly cashflow
- —
- DSCR
- —
- Eligible?
- —
No personal income docs; deal must DSCR.
Hard money
10% down · 12.0% · 12mo
- Down + closing
- —
- Monthly P&I
- —
- Monthly cashflow
- —
- DSCR
- —
- Eligible?
- —
Short-term bridge; refi at stabilization.
Rent comps 13 comps
| Address | Beds | Baths | Sqft | Rent | $/sqft | DOM | Units | Dist |
|---|---|---|---|---|---|---|---|---|
| 149 Moores Creek Dr Columbia, SC | 3.0 | 2.0 | 1600 | $2,069 | $1.29 | 14d | 1 | 0.64mi |
| 2769 Prince Charles Ct Columbia, SC | 3.0 | 2.5 | 1617 | $1,850 | $1.14 | 11d | 1 | 0.65mi |
| 4022 Ulmer Rd Columbia, SC | 2.0–3.0 | 1.0–2.0 | 1202 | $1,322 | $1.10 | 19d | 1 | 0.74mi |
| 2705 Prince Charles Ct Columbia, SC | 4.0 | 2.0 | 1466 | $1,906 | $1.30 | 23d | 1 | 0.77mi |
| 7015 Mirror Lake Rd Columbia, SC | 3.0 | 2.0 | 2043 | $1,800 | $0.88 | 23d | 1 | 0.83mi |
| 2011 Dominion Dr Columbia, SC | 3.0 | 2.0 | 1625 | $1,595 | $0.98 | 23d | 1 | 0.95mi |
| 1727 Sandra Dr Columbia, SC | 4.0 | 2.5 | 1750 | $1,900 | $1.09 | 11d | 1 | 1.01mi |
| 1912 Dominion Dr Columbia, SC | 4.0 | 2.0 | 1614 | $2,300 | $1.43 | 23d | 1 | 1.05mi |
| 1101 Hallbrook Dr Columbia, SC | 1.0–3.0 | 1.0–2.0 | 1050 | $1,229 | $1.17 | 14d | 1 | 1.13mi |
| 352 Sandbach Rd Columbia, SC | 4.0 | 2.5 | 1976 | $2,300 | $1.16 | 14d | 1 | 1.28mi |
| 457 Delahays Rd Columbia, SC | 3.0 | 2.0 | 1704 | $2,000 | $1.17 | 14d | 1 | 1.28mi |
| 440 Delahays Rd Columbia, SC | 3.0 | 2.5 | 1704 | $1,900 | $1.12 | 14d | 1 | 1.30mi |
| 305 Shoreditch Dr Columbia, SC | 3.0 | 1.5 | 1378 | $1,586 | $1.15 | 19d | 1 | 1.47mi |
Listing history 20 events
-
2026-06-17status $175,000 Pending 62 DOM
-
2026-06-17days on market $175,000 Active 62 DOM
-
2026-06-16days on market $175,000 Active 61 DOM
-
2026-06-15days on market $175,000 Active 60 DOM
-
2026-06-14days on market $175,000 Active 58 DOM
-
2026-06-10days on market $175,000 Active 55 DOM
-
2026-06-09days on market $175,000 Active 54 DOM
-
2026-06-08days on market $175,000 Active 53 DOM
-
2026-06-07days on market $175,000 Active 52 DOM
-
2026-06-03pricedays on market $175,000 Active 48 DOM
-
2026-06-03days on market $180,000 Active 47 DOM
-
2026-06-01days on market $180,000 Active 46 DOM
-
2026-05-31days on market $180,000 Active 45 DOM
-
2026-05-02price $180,000
-
2026-04-16$195,000 Active
-
2021-10-15soldstatus $167,000
-
1996-02-28soldstatus $92,500
-
1992-04-09soldstatus $91,500
-
1988-10-01soldstatus $79,900
-
1988-05-01soldstatus $67,500
ⓘ Source: listings_history table (triggers on properties + properties_extension) + one-shot
backfill from property_details.listing_events for pre-trigger history.
Tax reassessment forecast SC · Resets to sale price
- Current annual tax
- $1,664 · $139/mo
- Projected year-2 tax
- $1,664 · $139/mo
- Expected delta
- $0/yr ($0/mo · 0.0%)
ⓘ Screening estimate from a state-policy table — verify with the county assessor before closing.
Climate risk First Street
- Flood 1/10 Low FEMA zone X (unshaded) · 0% chance over 30 yrs
- Wildfire 4/10 Moderate
- Heat 6/10 Major 7 d/yr ≥108°F today · 15 d/yr by 30 yrs out
- Wind 7/10 Severe 78% chance of damaging wind over 30 yrs
- Air quality 3/10 Moderate 2 unhealthy d/yr today · 2 by 30 yrs out
Nearby sold comps map
Loading sold comps map…
Walkable amenities ~0.75 mi
Loading nearby amenities…
Taxation est. · year 1
- Rental income
- $22,360
- − Mortgage interest
- −$9,803
- − Property taxes
- −$1,664
- − Insurance
- −$875
- − Repairs & maintenance
- −$1,789
- − Management
- −$1,789
- − Depreciation
- −$5,091
- Taxable income
- $1,350
- Est. tax owed @ 24.0%
- −$324
- After-tax cash flow
- $3,789/yr
For passive investors: Depreciation is non-cash, so a rental often shows a tax loss while cash-flowing — sheltering income. Rental losses are passive: they offset passive income freely, and up to $25,000/yr can offset ordinary (W-2) income if you actively participate and your MAGI is under $100k (phasing out to $0 by $150k); unused losses carry forward. On sale, claimed depreciation is recaptured at up to 25%, and gains may owe capital-gains tax (a 1031 exchange can defer both). Figures are a year-1 estimate at your 24.0% rate — not tax advice; consult a CPA.
Schools (NCES district)
- District
- Richland 01
- NCES district ID
- 4503360
- Math proficiency
- 26% ▼ -7.00%
- Reading proficiency
- 36% ▼ -5.00%
- Median HH income
- $38,931
- Composite
- 25.94/100
- National rank
- #7335
- State rank
- #54 of 80 in SC
Livability — Capitol View
No livability data for this city. (Only ~50 U.S. cities are tracked.)
Census & demographics
- County
- Richland County · 389,530 people
- City population
- 335,994
- Metro
- Columbia, SC
- Population (ZIP)
- 38,041
- Household income
- $58,772
- Rent vs Own
- Severe rent burden
- 1716.0
Population outlook (Richland County) Hauer SSP2
- Today (2025)
- 459,667 people
- By 2030
- 487,524 · +6.1%
- By 2040
- 542,035 · +17.9%
- By 2050
- 595,371 · +29.5%
- By 2075
- 732,998 · +59.5%
- By 2100
- 820,415 · +78.5%
Race, ethnicity, and origin ACS 2023
- Neighborhood character
- Diverse neighborhood (Simpson 0.62)
- Race & ethnicity
- Black 48% White 39% Two or more races 6% Hispanic / Latino 6% Asian 2%
- Hispanic origin (detail)
- Mexican 3% Puerto Rican 2%
- Common ancestry
- Slovak 2% Serbian 2% Italian 1%
- Foreign-born
- 6% · Canada, Jamaica
- Languages at home
- 93% English-only · Spanish 3% Arabic 1% Other Indo-European 1%
Political lean MEDSL · Richland
- 2024 margin
- Solid D (+34.6) · D 66.4% · R 31.8% · Other 1.8%
- 2008→2024 swing
- +5.7pp toward D · 2008: 28.9pp · 2024: 34.6pp
- All cycles
- 2024: D+34.6 2020: D+38.3 2016: D+32.9 2012: D+33.3 2008: D+28.9
Not yet ingested
- Civics
- —
Market trends
- HPI YoY
- ▼ -142.10%
- Current HPI
- 205.5679
- Rent YoY
- ▲ 2.08%
- Metro
- Columbia, SC
- State GDP YoY
- ▲ 4.51%
- F500 in state
- 2
Industry mix (Fortune 500 HQ in SC)
| Industry | F500 HQs | Revenue |
|---|---|---|
| Packaging | 1 | $7B |
|
||
Price history
+166.7% since first listed7 events — show timeline
- 2026-05-02 Price Changed $180,000 Consolidated MLS
- 2026-04-16 Listed $195,000 Consolidated MLS
- 2021-10-15 Sold (Public Records) $167,000 Public Records
- 1996-02-28 Sold (Public Records) $92,500 Public Records
- 1992-04-09 Sold (Public Records) $91,500 Public Records
- 1988-10-01 Sold (Public Records) $79,900 Public Records
- 1988-05-01 Sold (Public Records) $67,500 Public Records
Property tax history
+4.3%/yrLatest (2025): $1,664 · +4.3% YoY. Source: county tax records.
Cash-flow waterfall
monthlySold comps — $/sqft
last 12 mo · ≤1 miLoading sold comps…