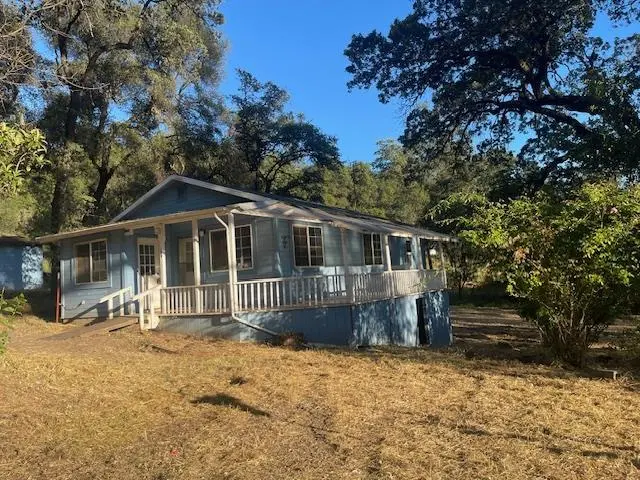
18910 Bumpy Rd · Alta Sierra, CA
Flood risk 1/10 · Minimal
- FEMA flood zone
- X (unshaded)
- Chance of flooding over 30 yrs
- 0.0%
- Est. flood insurance / yr
- $473 – $860
Fire risk 9/10 · Severe
- Est. fire insurance / yr
- $659 – $1,223
Heat risk 6/10 · Moderate
- Hot days now (above 98°F)
- 7 days/yr
- Hot days in 30 yrs
- 16 days/yr
Wind risk 1/10 · Minimal
- Chance of severe wind over 30 yrs
- —
Air-quality risk 10/10 · Severe
- Unhealthy air days now
- 31 days/yr
- Unhealthy air days in 30 yrs
- 40 days/yr
Risk factors via First Street. Map © Google.
Why this score? — see what drove the C grade
The composite is a weighted blend of 9 inputs, each scored 0–100. Each bar is that input's sub-score; the figure is the points it added to the 100-point composite (weight × sub-score).
- Cash flow +20.6/30.0
- ARV discount +15.0/15.0
- DSCR +6.5/10.0
- 1% rule +4.1/10.0
- Schools +3.8/10.0
- Livability +3.0/5.0
- Rent growth +2.5/5.0
- Condition / age +2.5/5.0
- Appreciation +0.0/10.0
$314,900
🖨 Deal sheet (PDF) 📄 Offer letter ✓ Due diligence
Listing remarks
Single-level fixer with great upside in the Oaks and natural setting Grass Valley, just minutes from convenient Highway 49 access and with paved access. This approximately 1,100+ sq ft two-bedroom, one-bath home offers a functional floor plan with living room, dining area, and kitchen plus a dedicated laundry space, all on one level for easy living. Interior features include wood floors, dual pane windows, a composition roof, and a water softener, with additional storage available in the sub-area and a detached storage shed for tools, toys, or hobby space. The property is serviced by a well, septic, and propane, giving you more independence and control over utilities, and the usable lot is
Key facts
- Wood floors
- Paved access
- Natural setting
Tags
Property features AI
Finance
- Other: Property marketed as residential on a 1.02-acre parcel; Located on a corner lot at 18910 Bumpy Rd, Grass Valley, CA
- HOA & community: No homeowners association; Not a senior community
Exterior
- Parking: Gravel driveway and sidewalks
- Utilities: 220-volt electric service; Well water; Septic with pump; No irrigation system
- Home design: Detached single-family home; One story; Built in 1952; Fixer condition
- Construction: Composition roof; Established foundation (partial basement)
- Exterior features: Wire fencing; Storage building and outbuilding; Irregular-shaped lot; No pool or spa
Interior
- Kitchen: Free-standing gas range; Hood over range; Garbage disposal; Laminate countertops
- Bedrooms: Two bedrooms (main level)
- Flooring: Wood flooring
- Bathrooms: One full bathroom (main level)
- Heating & cooling: Central heating; Central cooling with ceiling fan(s)
- Interior features: Tile bath with tub and window; Front porch and covered patio; Partial basement (approximately 200 sq ft); Dual-pane partial windows; Seven total rooms including living room with view and workshop
- Laundry & utility: Laundry located inside the house
Neighborhood map
What this means for you Summary
Snapshot
- This is a 3-bed/1.0-bath single-family listed at $315k.
Deal economics
- At list price, monthly cash flow is $419 ($5k/yr) — positive.
- The deal already cash-flows at list — no discount required.
- To meet the 1% rule (rent ≥ 1% of price), the offer needs to be $288k (8.6% below list).
- Recommended offer: $288k (8.6% below list) — sets the bar for 1% rule.
- Cap rate 7.9% vs local median 3.4% in Alta Sierra — top-decile yield for the area; either an underpriced asset or a hidden risk that comps aren't pricing in. Stress-test before assuming the spread holds.
Location & tenants
- Location reads 59/100 on livability (#662 in CA) — a working-class tenant base; expect higher turnover. Strengths: employment A+, housing A+; Watch: crime C-, amenities F, commute F.
- Nevada Joint Union High (town): math 25% / reading 61% proficiency, ranked #201 of 517 in CA (top 39%) — families likely to look elsewhere, expect single-tenant / working-renter base with shorter leases.
- Zoned schools: Cottage Hill Elementary (math 32% / reading 42%, grade F, #671 of 1,571 statewide, top 44%, 455 students, 32% FRL); Magnolia Intermediate (math 24% / reading 51%, grade F, #166 of 498 statewide, top 34%, 379 students, 35% FRL).
- Market conditions: 256 active listings in the ZIP; 2 comparable units currently listed for rent nearby; solid renter incomes; 215 units permitted in Nevada County in 2024 (0 in 5+ unit buildings).
- This rent runs 35% of the median local income ($98k/yr) — at the standard rent-burdened threshold; future hikes will face affordability resistance.
Forward outlook
- Local home prices are declining (-3.0%/yr); year-one equity from $2k of loan paydown is wiped out by about $9k of value loss. Plan a longer hold.
- Nevada County population projected at -14% by 2050 — secular population decline; favor cash flow + early exit over multi-decade hold.
Negotiation context
- It's been on market 16 days — a 2% lower offer ($310k) is reasonable based on typical stale-listing flexibility.
Risks & watch-outs
- Watch-outs: built in 1952 — expect roof / HVAC / electrical / plumbing capex.
- Climate carrying-cost: severe wildfire risk; extreme-heat days projected 7→16/yr by 2055 (HVAC capex compounding) — expect insurance premiums to compound above CPI over the hold.
Questions for the listing agent
- Built in 1952 — when were the roof, HVAC, electrical panel, plumbing, and water heater last replaced?
- Is there a deadline driving the sale (1031 exchange, divorce, estate, relocation)? That informs how much negotiation room exists.
- Schools are D-rated, which usually means shorter tenancies and higher turnover. Who's the typical renter profile here, and what's been the actual vacancy rate?
- What's the average days-on-market for RENTAL listings here right now (not sales)? A rising rental-DOM trend means longer vacancies and softer asking-rent achievability than the comps imply.
- What's the recent tenant-quality profile in this submarket — average credit score on applications, eviction rate, late-payment / NSF rate, and stable-employment percentage? A property-management company in the area should have these aggregated.
- How much new for-sale + rental construction is in the pipeline within 1–3 miles? Heavy new supply typically softens prices + rents 12–24 months out; constrained supply supports both.
Investment metrics
- 1% rule
- 0.91% ✗
- Cap rate
- 7.89%
- Cash-on-cash
- 5.70%
- DSCR
- 1.25
- GRM
- 9.1
CMA / ARV
- ARV (on-the-fly)
- $462,162
- Comps found
- 1
Show comp detail 1 sale within ~0.75 mi
| Address | Dist | Beds/Ba | Sqft | Sold | Price | $/sf | Match |
|---|---|---|---|---|---|---|---|
| 19120 Cherry Creek Rd | 0.10mi | 3/2.0 | 1,088 (-8%) | 7mo | $425,000 | $391 | 72 |
Match score weights: distance 35% · size 25% · config 20% · recency 20%. Top-matched comps best support the ARV.
Projected returns pro-forma
-3.0% appreciation · 3.0% rent growth · sell at horizon
- IRR
- -7.5%
- Equity multiple
- 0.72×
- Total profit
- $-24,498
- Equity at exit
- $46,953
- IRR
- 2.0%
- Equity multiple
- 1.14×
- Total profit
- $12,401
- Equity at exit
- $27,227
Cash invested: $88,172 (down + closing). Projections, not guarantees.
Landlord ↔ Tenant lean methodology
- Overall (STATE)
- 18 Strongly Tenant-Friendly
- State California
- 18 Strongly Tenant-Friendly · D+13
- County
- — inherits STATE
- City
- — inherits STATE
ZIP-level market 95949
- Home prices YoY
- -34.7%
- Active inventory
- 256
- Price-to-rent
- 9.1×
Monthly cashflow live
- Estimated rent
- $2,879 medium interval (Pro) →
- Mortgage (P&I)
- −$1,651
- Tax from tax record
- −$73 /mo · $873/yr
- Insurance
- −$131
- HOA
- −$0
- Vacancy / Maint / Mgmt
- −$605
- Net cashflow
- $419
Break-even live
Sensitivity live
| Price | -10% $597 | -5% $508 | +0% $419 | +5% $330 | +10% $241 |
|---|---|---|---|---|---|
| Rent | -10% $192 | -5% $305 | +0% $419 | +5% $533 | +10% $646 |
| Rate | -1.0pp $578 | -0.5pp $499 | base $419 | +0.5pp $337 | +1.0pp $254 |
UW: 25.0% down · 7.5% · 30yr · 1.5% tax · 5.0% vac · 8.0% maint · 8.0% mgmt
Financing live
Cash to close
- Down payment
- $78,725
- Closing costs
- $9,447
- Reserves months
- —
- Total cash needed
- —
Loan-product check · same deal, 3 products live
Conventional
25% down · 7.5% · 30yr
- Down + closing
- —
- Monthly P&I
- —
- Monthly cashflow
- —
- DSCR
- —
- Eligible?
- —
Personal DTI + credit; lowest rate.
DSCR
20% down · 8.5% · 30yr
- Down + closing
- —
- Monthly P&I
- —
- Monthly cashflow
- —
- DSCR
- —
- Eligible?
- —
No personal income docs; deal must DSCR.
Hard money
10% down · 12.0% · 12mo
- Down + closing
- —
- Monthly P&I
- —
- Monthly cashflow
- —
- DSCR
- —
- Eligible?
- —
Short-term bridge; refi at stabilization.
Rent comps 2 comps
| Address | Beds | Baths | Sqft | Rent | $/sqft | DOM | Units | Dist |
|---|---|---|---|---|---|---|---|---|
| 11292 Old Pond Ln Grass Valley, CA | 2.0 | 2.0 | 1001 | $2,450 | $2.45 | 14d | 1 | 1.24mi |
| 17434 Virginia Way Grass Valley, CA | 3.0 | 2.0 | 1226 | $2,700 | $2.20 | 25d | 1 | 1.33mi |
Listing history 13 events
-
2026-06-21days on market $314,900 Active 16 DOM
-
2026-06-19days on market $314,900 Active 14 DOM
-
2026-06-18days on market $314,900 Active 13 DOM
-
2026-06-17days on market $314,900 Active 12 DOM
-
2026-06-16days on market $314,900 Active 11 DOM
-
2026-06-15days on market $314,900 Active 10 DOM
-
2026-06-13days on market $314,900 Active 8 DOM
-
2026-06-13days on market $314,900 Active 7 DOM
-
2026-06-10days on market $314,900 Active 5 DOM
-
2026-06-09days on market $314,900 Active 4 DOM
-
2026-06-08days on market $314,900 Active 3 DOM
-
2026-06-07remarks 699-char remark
-
2026-06-07$314,900 Active 2 DOM
ⓘ Source: listings_history table (triggers on properties + properties_extension) + one-shot
backfill from property_details.listing_events for pre-trigger history.
Tax reassessment forecast CA · Resets to sale price
- Current annual tax
- $873 · $73/mo
- Projected year-2 tax
- $2,393 · $199/mo
- Expected delta
- +$1,520/yr (+$127/mo · 174.2%)
ⓘ Screening estimate from a state-policy table — verify with the county assessor before closing.
Climate risk First Street
- Flood 1/10 Low FEMA zone X (unshaded) · 0% chance over 30 yrs
- Wildfire 9/10 Extreme
- Heat 6/10 Major 7 d/yr ≥98°F today · 16 d/yr by 30 yrs out
- Wind 1/10 Low
- Air quality 10/10 Extreme 31 unhealthy d/yr today · 40 by 30 yrs out
Nearby sold comps map
Loading sold comps map…
Walkable amenities ~0.75 mi
Loading nearby amenities…
Taxation est. · year 1
- Rental income
- $34,546
- − Mortgage interest
- −$17,639
- − Property taxes
- −$873
- − Insurance
- −$1,574
- − Repairs & maintenance
- −$2,764
- − Management
- −$2,764
- − Depreciation
- −$9,161
- Taxable loss
- −$229
- Est. tax savings @ 24.0%
- +$55
- After-tax cash flow
- $5,082/yr
For passive investors: Depreciation is non-cash, so a rental often shows a tax loss while cash-flowing — sheltering income. Rental losses are passive: they offset passive income freely, and up to $25,000/yr can offset ordinary (W-2) income if you actively participate and your MAGI is under $100k (phasing out to $0 by $150k); unused losses carry forward. On sale, claimed depreciation is recaptured at up to 25%, and gains may owe capital-gains tax (a 1031 exchange can defer both). Figures are a year-1 estimate at your 24.0% rate — not tax advice; consult a CPA.
Schools (NCES district)
- District
- Nevada Joint Union High
- NCES district ID
- 0626880
- Math proficiency
- 25% ▼ -14.00%
- Reading proficiency
- 61% ▼ -7.00%
- Median HH income
- $57,336
- Composite
- 37.53/100
- National rank
- #4393
- State rank
- #201 of 517 in CA
Livability — Alta Sierra
- Score
- 59/100
- State rank
- #662
- US rank
- #20497
Category grades
Schools grade is shown separately in the Schools card above.
Census & demographics
- County
- Nevada County · 85,339 people
- Metro
- Truckee-Grass Valley, CA
- Population (ZIP)
- 20,552
- Household income
- $98,181
- Rent vs Own
- Severe rent burden
- 181.0
Population outlook (Nevada County) Hauer SSP2
- Today (2025)
- 98,490 people
- By 2030
- 97,295 · -1.2%
- By 2040
- 92,041 · -6.5%
- By 2050
- 85,164 · -13.5%
- By 2075
- 68,436 · -30.5%
- By 2100
- 49,536 · -49.7%
Race, ethnicity, and origin ACS 2023
- Neighborhood character
- Predominantly White (84%)
- Race & ethnicity
- White 84% Hispanic / Latino 8% Two or more races 8% Native American 1%
- Hispanic origin (detail)
- Mexican 6%
- Common ancestry
- Lithuanian 4% Italian 4% Slovak 2%
- Foreign-born
- 4% · Canada
- Languages at home
- 94% English-only · Spanish 3% Other Indo-European 1%
Political lean MEDSL · Nevada
- 2024 margin
- D (+12.2) · D 54.4% · R 42.1% · Other 3.5%
- 2008→2024 swing
- +6.9pp toward D · 2008: 5.3pp · 2024: 12.2pp
- All cycles
- 2024: D+12.2 2020: D+14.8 2016: D+4.5 2012: R+4.7 2008: D+5.3
Not yet ingested
- Civics
- —
Market trends
- HPI YoY
- ▼ -122.41%
- Current HPI
- 230.2373
- Rent YoY
- —
- Metro
- Truckee-Grass Valley, CA
- State GDP YoY
- ▲ 3.21%
- F500 in state
- 116
Industry mix (Fortune 500 HQ in CA)
| Industry | F500 HQs | Revenue |
|---|---|---|
| Technology | 27 | $1,492B |
|
||
| Financial Services | 3 | $174B |
|
||
| Retail | 3 | $44B |
|
||
| Insurance | 3 | $26B |
|
||
| Media / Entertainment | 2 | $115B |
|
||
| Pharmaceuticals / Biotech | 2 | $62B |
|
||
Property tax history
+4.1%/yrLatest (2025): $873 · +2.3% YoY. Source: county tax records.
Cash-flow waterfall
monthlySold comps — $/sqft
last 12 mo · ≤1 miLoading sold comps…