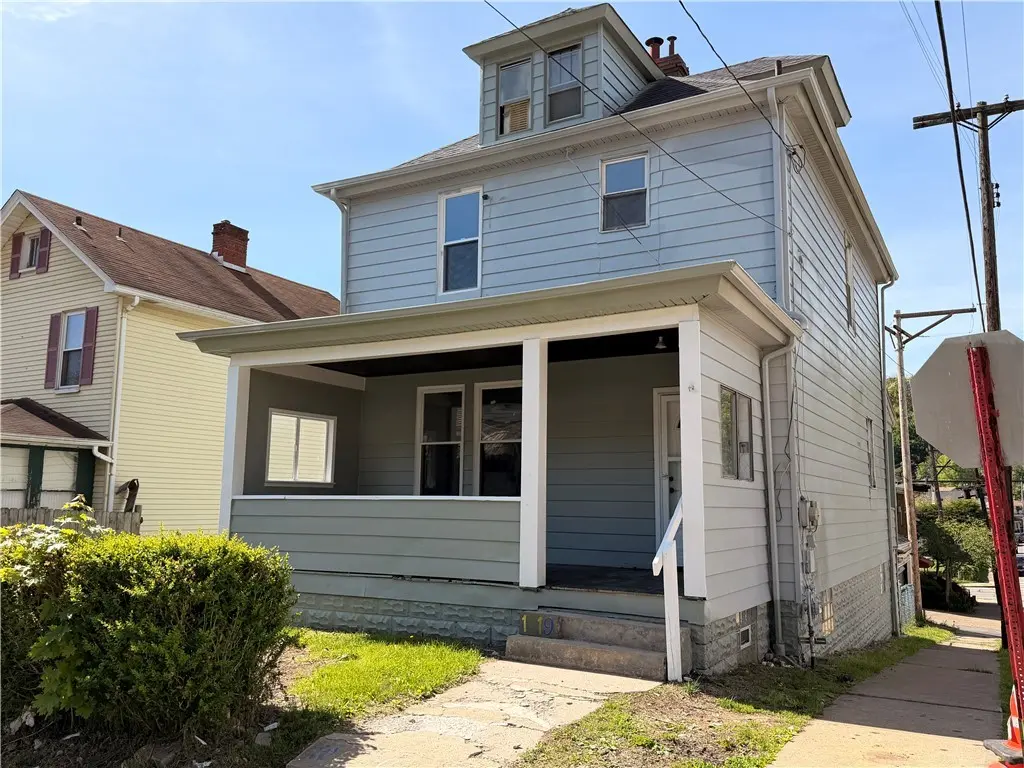
1219 Woodward Ave · McKees Rocks, PA
Flood risk 1/10 · Minimal
- FEMA flood zone
- X (unshaded)
- Chance of flooding over 30 yrs
- 0.0%
- Est. flood insurance / yr
- $473 – $860
Fire risk 1/10 · Minimal
- Est. fire insurance / yr
- $511 – $949
Heat risk 4/10 · Minor
- Hot days now (above 98°F)
- 7 days/yr
- Hot days in 30 yrs
- 18 days/yr
Wind risk 2/10 · Minimal
- Chance of severe wind over 30 yrs
- —
Air-quality risk 3/10 · Minor
- Unhealthy air days now
- 3 days/yr
- Unhealthy air days in 30 yrs
- 3 days/yr
Risk factors via First Street. Map © Google.
Why this score? — see what drove the D grade
The composite is a weighted blend of 9 inputs, each scored 0–100. Each bar is that input's sub-score; the figure is the points it added to the 100-point composite (weight × sub-score).
- Cash flow +15.9/30.0
- ARV discount +7.3/15.0
- Rent growth +5.0/5.0
- DSCR +4.9/10.0
- 1% rule +4.5/10.0
- Livability +4.1/5.0
- Condition / age +2.5/5.0
- Schools +0.9/10.0
- Appreciation +0.0/10.0
$145,000
🖨 Deal sheet (PDF) 📄 Offer letter ✓ Due diligence
Listing remarks
Welcome to this Woodward Ave home situated on a corner lot in Stowe Twp. Step inside to find a spacious living area filled with natural light, perfect for relaxing or entertaining. The layout of this charming home flows seamlessly into a functional dining space and kitchen. Both offering plenty of space to prepare delicious homemade meals to enjoy with family and friends. Generous room sizes throughout provide flexibility for today's lifestyle, whether you're working from home or hosting guests. Upstairs, you'll find comfortable bedrooms with ample closet space, along with a full bath designed for both functionality and ease. Outside, enjoy a manageable yard, ideal for summer gatherings, ga
Key facts
- Manageable yard
- Back door entrance
- Natural light
Tags
Property features AI
Finance
- HOA & community: Public transportation nearby
Exterior
- Parking: Detached garage (2 parking spaces total)
- Utilities: Public water; Public sewer
- Home design: Two-story frame home; Asphalt roof; Resale property
- Construction: Frame construction; Asphalt roof
- Exterior features: Public water; Public sewer; Lot approximately 0.086 acres
Interior
- Kitchen: Main-level kitchen (approx. 14x9)
- Bedrooms: Upper-level bedrooms (3 total) — approximate dimensions: 14x12, 13x13, 11x9
- Flooring: Carpet; Vinyl
- Bathrooms: 2 full bathrooms
- Heating & cooling: Gas heating
- Interior features: Carpet and vinyl flooring; Full basement with walk-up access; 7 total rooms
Neighborhood map
What this means for you Summary
Snapshot
- This is a 3-bed/2.0-bath single-family listed at $145k.
Deal economics
- At list price, monthly cash flow is $68 ($816/yr) — positive.
- The deal already cash-flows at list — no discount required.
- To meet the 1% rule (rent ≥ 1% of price), the offer needs to be $137k (5.5% below list).
- Recommended offer: $137k (5.5% below list) — sets the bar for 1% rule.
- Cap rate 6.9% vs local median 10.0% in McKees Rocks — below-typical yield; the buyer is paying a premium for something (appreciation thesis, condition, location) that the cap rate doesn't capture.
Location & tenants
- Location reads 82/100 on livability (#143 in PA, #1,154 nationally) — a professional / high-income tenant draw. Strengths: amenities A+, commute A+, cost of living A+; Watch: employment F.
- Sto-Rox SD (suburban): math 4% / reading 18% proficiency, ranked #532 of 539 in PA (top 99%) — low school quality limits family demand, transient renter base, plan for 1-2y turnover; 77% free/reduced lunch — lower-income household profile, screen leases tightly.
- Zoned schools: Sto-Rox Primary Ctr (math 8% / reading 27%, grade F, #1,295 of 1,518 statewide, top 86%, 328 students, 100% FRL); Sto-Rox Upper El Sch (math 3% / reading 20%, grade F, #492 of 512 statewide, top 96%, 218 students, 100% FRL); Sto-Rox Jshs (math 2% / reading 2%, grade F, #437 of 437 statewide, top 100%, 517 students, 92% FRL) — zoned schools average 98% FRL vs 77% district-wide (20 pts higher); higher-poverty schools than district average — tighter screening recommended.
- Market conditions: Rents rising fast (+13.1%/yr); 125 active listings in the ZIP; 20 comparable units currently listed for rent nearby; rentals at typical pace (median 26d on market — plan ~3-4 weeks tenant-placement turnaround); 2,996 units permitted in Allegheny County in 2024 (1,588 in 5+ unit buildings).
Forward outlook
- Local home prices are declining (-3.0%/yr); year-one equity from $1k of loan paydown is wiped out by about $4k of value loss. Plan a longer hold.
Negotiation context
- It's been on market 56 days — a 3% lower offer ($141k) is reasonable based on typical stale-listing flexibility.
- Current owner paid $47k; list at $145k implies a 209% gain — meaningful room to come down on a strong offer.
Risks & watch-outs
- Watch-outs: built in 1910 — expect roof / HVAC / electrical / plumbing capex.
Questions for the listing agent
- It's been on market 56 days. Have you received any prior offers? Is the seller open to a 5% concession, seller financing, or rate buy-down credit?
- Built in 1910 — when were the roof, HVAC, electrical panel, plumbing, and water heater last replaced?
- Is there a deadline driving the sale (1031 exchange, divorce, estate, relocation)? That informs how much negotiation room exists.
- Schools are F-rated, which usually means shorter tenancies and higher turnover. Who's the typical renter profile here, and what's been the actual vacancy rate?
- The area grade is low — what's the realistic commute time and amenity access for the typical tenant pool here? Any planned neighborhood developments (good or bad) we should know about?
- What's the average days-on-market for RENTAL listings here right now (not sales)? A rising rental-DOM trend means longer vacancies and softer asking-rent achievability than the comps imply.
- What's the recent tenant-quality profile in this submarket — average credit score on applications, eviction rate, late-payment / NSF rate, and stable-employment percentage? A property-management company in the area should have these aggregated.
- How much new for-sale + rental construction is in the pipeline within 1–3 miles? Heavy new supply typically softens prices + rents 12–24 months out; constrained supply supports both.
Investment metrics
- 1% rule
- 0.95% ✗
- Cap rate
- 6.86%
- Cash-on-cash
- 2.01%
- DSCR
- 1.09
- GRM
- 8.8
CMA / ARV
- ARV (median comp)
- $144,225
- List price
- $145,000
- Delta
- 0.54%
- Verdict
- FAIR
- Comps
- 20 within 1.0 mi
Show comp detail 12 sales within ~0.75 mi
| Address | Dist | Beds/Ba | Sqft | Sold | Price | $/sf | Match |
|---|---|---|---|---|---|---|---|
| 1212 Woodward Ave | 0.03mi | 2/1.0 (-1) | 1,794 (+6%) | 0mo | $68,500 | $38 | 79 |
| 902 Woodward Ave | 0.18mi | 4/1.5 (+1) | 1,664 (-2%) | 10mo | $142,500 | $86 | 73 |
| 211 Hester Ave | 0.28mi | 3/2.0 | 1,611 (-5%) | 9mo | $225,000 | $140 | 71 |
| 557 Hillcrest Ave | 0.37mi | 3/2.5 | 1,610 (-5%) | 4mo | $235,000 | $146 | 69 |
| 104 Thorncrest Dr | 0.58mi | 3/2.0 | 1,625 (-4%) | 6mo | $311,001 | $191 | 61 |
| 67 Rosamond St | 0.53mi | 3/2.0 | 1,545 (-9%) | 0mo | $128,000 | $83 | 61 |
| 1170 Dohrman St | 0.37mi | 3/2.0 | 1,521 (-10%) | 7mo | $125,000 | $82 | 60 |
| 334 Russellwood Ave | 0.70mi | 4/1.5 (+1) | 1,616 (-4%) | 8mo | $149,000 | $92 | 47 |
| 618 Broadway Ave Unit MC | 0.47mi | 3/3.0 | 1,516 (-10%) | 12mo | $287,670 | $190 | 46 |
| 27 Highland Ave | 0.69mi | 3/1.0 | 1,488 (-12%) | 5mo | $66,000 | $44 | 39 |
| 234 Greydon Ave | 0.70mi | 3/1.0 | 1,488 (-12%) | 8mo | $75,000 | $50 | 37 |
| 19 Shaw Ave | 0.63mi | 4/1.0 (+1) | 1,485 (-12%) | 6mo | $95,000 | $64 | 36 |
Match score weights: distance 35% · size 25% · config 20% · recency 20%. Top-matched comps best support the ARV.
Projected returns pro-forma
-3.0% appreciation · 8.0% rent growth · sell at horizon
- IRR
- -7.6%
- Equity multiple
- 0.71×
- Total profit
- $-11,894
- Equity at exit
- $21,620
- IRR
- 7.5%
- Equity multiple
- 1.70×
- Total profit
- $28,302
- Equity at exit
- $12,537
Cash invested: $40,600 (down + closing). Projections, not guarantees.
Landlord ↔ Tenant lean methodology
- Overall (STATE)
- 62 Landlord-Friendly
- State Pennsylvania
- 62 Landlord-Friendly · EVEN
- County
- — inherits STATE
- City
- — inherits STATE
ZIP-level market 15136
- Home prices YoY
- -30.4%
- Rents YoY
- 13.1%
- Active inventory
- 125
- Price-to-rent
- 8.8×
Monthly cashflow live
- Estimated rent
- $1,371 high interval (Pro) →
- Mortgage (P&I)
- −$760
- Tax from tax record
- −$194 /mo · $2,328/yr
- Insurance
- −$60
- HOA
- −$0
- Lot rent
- −$0
- Vacancy / Maint / Mgmt
- −$288
- Net cashflow
- $68
Break-even live
Sensitivity live
| Price | -10% $150 | -5% $109 | +0% $68 | +5% $27 | +10% $-14 |
|---|---|---|---|---|---|
| Rent | -10% $-40 | -5% $14 | +0% $68 | +5% $122 | +10% $176 |
| Rate | -1.0pp $141 | -0.5pp $105 | base $68 | +0.5pp $30 | +1.0pp $-8 |
UW: 25.0% down · 7.5% · 30yr · 1.5% tax · 5.0% vac · 8.0% maint · 8.0% mgmt
Financing live
Cash to close
- Down payment
- $36,250
- Closing costs
- $4,350
- Reserves months
- —
- Total cash needed
- —
Loan-product check · same deal, 3 products live
Conventional
25% down · 7.5% · 30yr
- Down + closing
- —
- Monthly P&I
- —
- Monthly cashflow
- —
- DSCR
- —
- Eligible?
- —
Personal DTI + credit; lowest rate.
DSCR
20% down · 8.5% · 30yr
- Down + closing
- —
- Monthly P&I
- —
- Monthly cashflow
- —
- DSCR
- —
- Eligible?
- —
No personal income docs; deal must DSCR.
Hard money
10% down · 12.0% · 12mo
- Down + closing
- —
- Monthly P&I
- —
- Monthly cashflow
- —
- DSCR
- —
- Eligible?
- —
Short-term bridge; refi at stabilization.
Rent comps 20 comps
| Address | Beds | Baths | Sqft | Rent | $/sqft | DOM | Units | Dist |
|---|---|---|---|---|---|---|---|---|
| 802 13th St Unit 2 McKees Rocks, PA | 2.0 | 1.0 | 1100 | $920 | $0.84 | 46d | 1 | 0.08mi |
| 933 Woodward Ave Unit NA McKees Rocks, PA | 2.0 | 1.0 | 1100 | $1,400 | $1.27 | 22d | 1 | 0.09mi |
| 933 Woodward Ave Unit MC McKees Rocks, PA | 2.0 | 1.0 | 1100 | $1,400 | $1.27 | 26d | 1 | 0.09mi |
| 915 Woodward Ave Mc Kees Rocks, PA | 3.0 | 1.0 | 1224 | $1,399 | $1.14 | 46d | 1 | 0.13mi |
| 27 Rudolph St Mc Kees Rocks, PA | 3.0 | 1.0 | 1084 | $1,100 | $1.01 | 4d | 1 | 0.19mi |
| 27 Rudolph St Mc Kees Rocks, PA | 3.0 | 1.0 | 1084 | $1,100 | $1.01 | 0d | 1 | 0.19mi |
| 1124a Dohrman St McKees Rocks, PA | 3.0 | 1.0 | 1150 | $1,250 | $1.09 | 26d | 1 | 0.28mi |
| 1126 Dohrman St Unit MC McKees Rocks, PA | 2.0 | 1.0 | 1200 | $1,250 | $1.04 | 46d | 1 | 0.29mi |
| 705 Russellwood Ave Apt 2nd Floor McKees Rocks, PA | 4.0 | 1.0 | 1100 | $2,195 | $2.00 | 4d | 1 | 0.33mi |
| 705 Russellwood Ave Unit 2ndFL McKees Rocks, PA | 4.0 | 1.0 | 1100 | $2,250 | $2.05 | 4d | 1 | 0.33mi |
| 135 Dunn St Mc Kees Rocks, PA | 3.0 | 2.0 | 1600 | $1,599 | $1.00 | 22d | 1 | 0.44mi |
| 500 Marwood Ave Unit NA McKees Rocks, PA | 3.0 | 2.0 | 2040 | $1,500 | $0.74 | 26d | 1 | 0.50mi |
| 500 Marwood Ave Mc Kees Rocks, PA | 3.0 | 2.0 | 2040 | $1,600 | $0.78 | 26d | 1 | 0.50mi |
| 71 McKinnie Ave Mc Kees Rocks, PA | 2.0 | 1.0 | 1176 | $1,100 | $0.94 | 26d | 1 | 0.56mi |
| 207 Singer Ave Mc Kees Rocks, PA | 3.0 | 2.0 | 1728 | $1,700 | $0.98 | 46d | 1 | 0.57mi |
| 22 Harlem Ave #1 McKees Rocks, PA | 2.0 | 1.0 | 1944 | $745 | $0.38 | 23d | 1 | 0.61mi |
| 504 Fair Oaks St Mc Kees Rocks, PA | 4.0 | 1.0 | 1480 | $1,195 | $0.81 | 26d | 1 | 0.65mi |
| 27 Highland Ave Mc Kees Rocks, PA | 3.0 | 1.0 | 1488 | $1,425 | $0.96 | 26d | 1 | 0.67mi |
| 10 Highland Dr Mc Kees Rocks, PA | 2.0 | 1.0 | 1188 | $1,300 | $1.09 | 46d | 1 | 0.71mi |
| 720 Mary St Mc Kees Rocks, PA | 4.0 | 2.0 | 1800 | $1,795 | $1.00 | 10d | 1 | 1.09mi |
Listing history 17 events
-
2026-06-22days on market $145,000 Active 56 DOM
-
2026-06-21days on market $145,000 Active 55 DOM
-
2026-06-18days on market $145,000 Active 52 DOM
-
2026-06-17days on market $145,000 Active 51 DOM
-
2026-06-16days on market $145,000 Active 50 DOM
-
2026-06-15days on market $145,000 Active 49 DOM
-
2026-06-13days on market $145,000 Active 47 DOM
-
2026-06-09days on market $145,000 Active 43 DOM
-
2026-06-08days on market $145,000 Active 42 DOM
-
2026-06-07days on market $145,000 Active 41 DOM
-
2026-06-05days on market $145,000 Active 38 DOM
-
2026-06-03days on market $145,000 Active 37 DOM
-
2026-06-02days on market $145,000 Active 36 DOM
-
2026-06-01days on market $145,000 Active 35 DOM
-
2026-05-31days on market $145,000 Active 34 DOM
-
2026-04-27$145,000 Active 1163-char remark
-
2001-10-03soldstatus $47,000
ⓘ Source: listings_history table (triggers on properties + properties_extension) + one-shot
backfill from property_details.listing_events for pre-trigger history.
Tax reassessment forecast PA · Partial reset (capped growth)
- Current annual tax
- $2,328 · $194/mo
- Projected year-2 tax
- $2,328 · $194/mo
- Expected delta
- $0/yr ($0/mo · 0.0%)
ⓘ Screening estimate from a state-policy table — verify with the county assessor before closing.
Climate risk First Street
- Flood 1/10 Low FEMA zone X (unshaded) · 0% chance over 30 yrs
- Wildfire 1/10 Low
- Heat 4/10 Moderate 7 d/yr ≥98°F today · 18 d/yr by 30 yrs out
- Wind 2/10 Low
- Air quality 3/10 Moderate 3 unhealthy d/yr today · 3 by 30 yrs out
Nearby sold comps map
Loading sold comps map…
Walkable amenities ~0.75 mi
Loading nearby amenities…
Taxation est. · year 1
- Rental income
- $16,447
- − Mortgage interest
- −$8,122
- − Property taxes
- −$2,328
- − Insurance
- −$725
- − Repairs & maintenance
- −$1,316
- − Management
- −$1,316
- − Depreciation
- −$4,218
- Taxable loss
- −$1,577
- Est. tax savings @ 24.0%
- +$379
- After-tax cash flow
- $1,194/yr
For passive investors: Depreciation is non-cash, so a rental often shows a tax loss while cash-flowing — sheltering income. Rental losses are passive: they offset passive income freely, and up to $25,000/yr can offset ordinary (W-2) income if you actively participate and your MAGI is under $100k (phasing out to $0 by $150k); unused losses carry forward. On sale, claimed depreciation is recaptured at up to 25%, and gains may owe capital-gains tax (a 1031 exchange can defer both). Figures are a year-1 estimate at your 24.0% rate — not tax advice; consult a CPA.
Schools (NCES district)
- District
- Sto-Rox SD
- NCES district ID
- 4222830
- Math proficiency
- 4% ▼ -5.00%
- Reading proficiency
- 18% ▼ -4.00%
- Median HH income
- $30,268
- Composite
- 8.51/100
- National rank
- #9904
- State rank
- #532 of 539 in PA
Livability — McKees Rocks
- Score
- 82/100
- State rank
- #143
- US rank
- #1154
Category grades
Schools grade is shown separately in the Schools card above.
Census & demographics
- County
- Allegheny County · 1,022,028 people
- City population
- 22,623
- Metro
- Pittsburgh, PA
- Population (ZIP)
- 22,623
- Household income
- $69,099
- Rent vs Own
- Severe rent burden
- 768.0
Population outlook (Allegheny County) Hauer SSP2
- Today (2025)
- 1,250,282 people
- By 2030
- 1,256,482 · +0.5%
- By 2040
- 1,256,318 · +0.5%
- By 2050
- 1,244,169 · -0.5%
- By 2075
- 1,197,693 · -4.2%
- By 2100
- 1,093,187 · -12.6%
Race, ethnicity, and origin ACS 2023
- Neighborhood character
- Predominantly White (75%)
- Race & ethnicity
- White 75% Black 18% Two or more races 4% Hispanic / Latino 2%
- Common ancestry
- Romanian 10% Subsaharan African 3% Scotch-Irish 2%
- Foreign-born
- 3% · Canada
- Languages at home
- 96% English-only · Spanish 1% Other Indo-European 1%
Political lean MEDSL · Allegheny
- 2024 margin
- Strong D (+20.3) · D 59.7% · R 39.4%
- 2008→2024 swing
- +4.8pp toward D · 2008: 15.5pp · 2024: 20.3pp
- All cycles
- 2024: D+20.3 2020: D+20.4 2016: D+16.4 2012: D+14.4 2008: D+15.5
Not yet ingested
- Civics
- —
Market trends
- HPI YoY
- ▼ -107.07%
- Current HPI
- 244.6934
- Rent YoY
- ▲ 13.12%
- Metro
- Pittsburgh, PA
- State GDP YoY
- ▲ 1.68%
- F500 in state
- 34
Industry mix (Fortune 500 HQ in PA)
| Industry | F500 HQs | Revenue |
|---|---|---|
| Healthcare | 2 | $309B |
|
||
| Insurance | 2 | $27B |
|
||
| Telecommunications / Media | 1 | $124B |
|
||
| Industrial Distribution | 1 | $22B |
|
||
| Financial Services | 1 | $20B |
|
||
| Chemicals / Materials | 1 | $18B |
|
||
Price history
+208.5% since first listed2 events — show timeline
- 2026-04-27 Listed $145,000 West Penn MLS
- 2001-10-03 Sold (Public Records) $47,000 Public Records
Property tax history
+2.2%/yrLatest (2026): $2,328 · +4.0% YoY. Source: county tax records.
Cash-flow waterfall
monthlySold comps — $/sqft
last 12 mo · ≤1 miLoading sold comps…