6100 E Rancier Ave #384 · Killeen, TX
Flood risk 1/10 · Minimal
- FEMA flood zone
- X (unshaded)
- Chance of flooding over 30 yrs
- 0.0%
- Est. flood insurance / yr
- $507 – $1,088
Fire risk 5/10 · Moderate
- Est. fire insurance / yr
- $1,222 – $2,270
Heat risk 8/10 · Major
- Hot days now (above 107°F)
- 7 days/yr
- Hot days in 30 yrs
- 25 days/yr
Wind risk 6/10 · Moderate
- Chance of severe wind over 30 yrs
- 62.0%
Air-quality risk 1/10 · Minimal
- Unhealthy air days now
- 0 days/yr
- Unhealthy air days in 30 yrs
- 0 days/yr
Risk factors via First Street. Map © Google.
Why this score? — see what drove the C+ grade
The composite is a weighted blend of 9 inputs, each scored 0–100. Each bar is that input's sub-score; the figure is the points it added to the 100-point composite (weight × sub-score).
- Cash flow +28.1/30.0
- DSCR +10.0/10.0
- ARV discount +7.5/15.0
- 1% rule +7.1/10.0
- Condition / age +3.8/5.0
- Livability +3.2/5.0
- Schools +3.0/10.0
- Rent growth +2.1/5.0
- Appreciation +0.0/10.0
$127,000
🖨 Deal sheet (PDF) 📄 Offer letter ✓ Due diligence
Listing remarks MLS
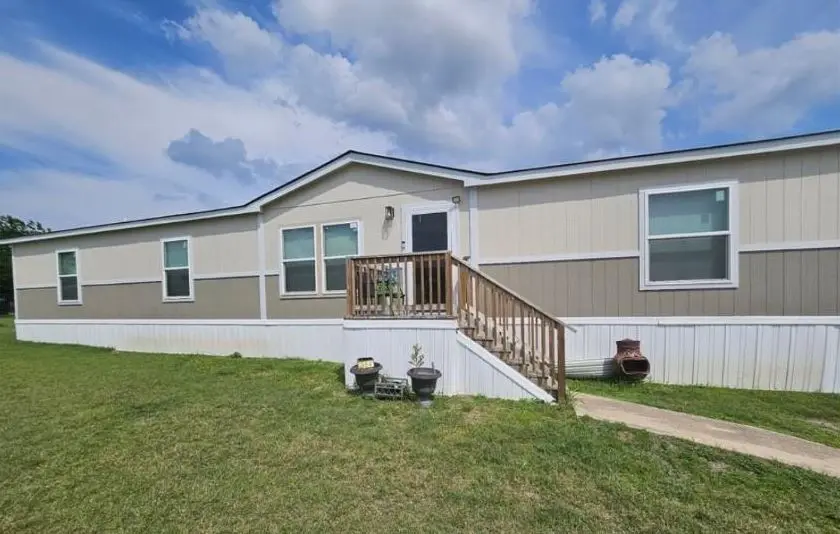
Step inside to an open-concept layout featuring a gourmet kitchen with all stainless-steel appliances and a central island bar-perfect for cooking and entertaining. The spacious living areas provide plenty of room for relaxation and family time. Recent upgrades include newly completed front and back decks, offering the perfect spots for outdoor dining or enjoying the Texas breeze. A sliding glass door at the rear opens directly to the backyard, enhancing your indoor-outdoor lifestyle. Located near shopping, schools, and dining, this home is ideal for families, first-time buyers! For Key Features: 4 Bedrooms, 2 Bathrooms Gourmet Kitchen with Island Bar & Stainless Steel Appliances Newly Built Front & Back Decks Sliding Glass Door Leading to Backyard Brand-New Skirting Around Entire Home Prime Central Location with Easy Highway Access! Don't miss your chance to own this fantastic home! Schedule your showing today!
Key facts
- Gourmet kitchen
- Sliding glass door
- Open-concept layout
Tags
Neighborhood map
What this means for you Summary
Snapshot
- This is a 4-bed/2.0-bath manufactured listed at $127k. Condition is rated good.
Deal economics
- At list price, monthly cash flow is $400 ($5k/yr) — positive.
- The deal already cash-flows at list — no discount required.
- Meets the 1% rule at list price ($2k rent vs $127k).
- Recommended offer: $116k (9.0% below list) — sets the bar for market timing.
- Cap rate 10.1% vs local median 3.9% in Killeen — top-decile yield for the area; either an underpriced asset or a hidden risk that comps aren't pricing in. Stress-test before assuming the spread holds.
Location & tenants
- Location reads 63/100 on livability (#853 in TX) — a middle-class / working-renter tenant base. Strengths: cost of living A+, housing A+; Watch: schools D+, amenities D, employment D.
- Killeen ISD (urban): math 31% / reading 38% proficiency, ranked #524 of 826 in TX (top 63%) — families likely to look elsewhere, expect single-tenant / working-renter base with shorter leases.
- Market conditions: Rents soft (-1.5%/yr); 230 active listings in the ZIP; 33 comparable units currently listed for rent nearby; rentals at typical pace (median 24d on market — plan ~3-4 weeks tenant-placement turnaround); 48% of comp listings sitting > 30 days — soft ceiling on asking rent; 3,222 units permitted in Bell County in 2024 (246 in 5+ unit buildings).
- This rent runs 38% of the median local income ($49k/yr) — at the standard rent-burdened threshold; future hikes will face affordability resistance.
Forward outlook
- Local home prices are declining (-3.0%/yr); year-one equity from $878 of loan paydown is wiped out by about $4k of value loss. Plan a longer hold.
- Bell County population projected at +21% by 2050 — long-run rental-demand tailwind backs the buy-and-hold thesis.
Negotiation context
- It's been on market 113 days — a 9% lower offer ($116k) is reasonable based on typical stale-listing flexibility.
- 4 sale attempts with the ask held roughly flat each time — persistent listings suggest the price (not the market) is what's stuck; bring a comps-based counter.
Risks & watch-outs
- Climate carrying-cost: major wind risk, 62% chance of damaging wind over 30y; moderate wildfire risk; extreme-heat days projected 7→25/yr by 2055 (HVAC capex compounding) — expect insurance premiums to compound above CPI over the hold.
Questions for the listing agent
- It's been on market 113 days. Have you received any prior offers? Is the seller open to a 9% concession, seller financing, or rate buy-down credit?
- Why hasn't it sold? Are there any deal-killer items the seller is aware of (foundation, flood, title, zoning, code violations)?
- Is there a deadline driving the sale (1031 exchange, divorce, estate, relocation)? That informs how much negotiation room exists.
- Schools are D-rated, which usually means shorter tenancies and higher turnover. Who's the typical renter profile here, and what's been the actual vacancy rate?
- Crime grade is D in this area — have there been break-ins, vandalism, or insurance claims at this property in the last 3 years? What carrier currently insures it and at what premium?
- What's the average days-on-market for RENTAL listings here right now (not sales)? A rising rental-DOM trend means longer vacancies and softer asking-rent achievability than the comps imply.
- What's the recent tenant-quality profile in this submarket — average credit score on applications, eviction rate, late-payment / NSF rate, and stable-employment percentage? A property-management company in the area should have these aggregated.
- How much new for-sale + rental construction is in the pipeline within 1–3 miles? Heavy new supply typically softens prices + rents 12–24 months out; constrained supply supports both.
Investment metrics
- 1% rule
- 1.21% ✓
- Cap rate
- 10.07%
- Cash-on-cash
- 13.49%
- DSCR
- 1.60
- GRM
- 6.9
CMA / ARV
No comps found within radius.
Projected returns pro-forma
-3.0% appreciation · 0.0% rent growth · sell at horizon
- IRR
- 0.3%
- Equity multiple
- 1.01×
- Total profit
- $360
- Equity at exit
- $18,936
- IRR
- 6.7%
- Equity multiple
- 1.44×
- Total profit
- $15,632
- Equity at exit
- $10,981
Cash invested: $35,560 (down + closing). Projections, not guarantees.
Landlord ↔ Tenant lean methodology
- Overall (STATE)
- 87 Strongly Landlord-Friendly
- State Texas
- 87 Strongly Landlord-Friendly · R+5
- County
- — inherits STATE
- City
- — inherits STATE
ZIP-level market 76543
- Rents YoY
- -1.5%
- Active inventory
- 230
- Price-to-rent
- 6.9×
Monthly cashflow live
- Estimated rent
- $1,536 high interval (Pro) →
- Mortgage (P&I)
- −$666
- Tax from tax record
- −$95 /mo · $1,138/yr
- Insurance
- −$53
- HOA
- −$0
- Vacancy / Maint / Mgmt
- −$323
- Net cashflow
- $400
Break-even live
Sensitivity live
| Price | -10% $472 | -5% $436 | +0% $400 | +5% $364 | +10% $328 |
|---|---|---|---|---|---|
| Rent | -10% $278 | -5% $339 | +0% $400 | +5% $460 | +10% $521 |
| Rate | -1.0pp $464 | -0.5pp $432 | base $400 | +0.5pp $367 | +1.0pp $333 |
UW: 25.0% down · 7.5% · 30yr · 1.5% tax · 5.0% vac · 8.0% maint · 8.0% mgmt
Financing live
Cash to close
- Down payment
- $31,750
- Closing costs
- $3,810
- Reserves months
- —
- Total cash needed
- —
Loan-product check · same deal, 3 products live
Conventional
25% down · 7.5% · 30yr
- Down + closing
- —
- Monthly P&I
- —
- Monthly cashflow
- —
- DSCR
- —
- Eligible?
- —
Personal DTI + credit; lowest rate.
DSCR
20% down · 8.5% · 30yr
- Down + closing
- —
- Monthly P&I
- —
- Monthly cashflow
- —
- DSCR
- —
- Eligible?
- —
No personal income docs; deal must DSCR.
Hard money
10% down · 12.0% · 12mo
- Down + closing
- —
- Monthly P&I
- —
- Monthly cashflow
- —
- DSCR
- —
- Eligible?
- —
Short-term bridge; refi at stabilization.
Rent comps 33 comps
| Address | Beds | Baths | Sqft | Rent | $/sqft | DOM | Units | Dist |
|---|---|---|---|---|---|---|---|---|
| 6100 E Rancier Ave Killeen, TX | 3.0 | 2.0 | 1512 | $1,175 | $0.78 | 24d | 1 | 0.02mi |
| 6001 Amelia Earhart Blvd Killeen, TX | 3.0 | 2.0 | 1231 | $1,495 | $1.21 | 44d | 1 | 0.12mi |
| 6011 Amelia Earhart Blvd Unit B Killeen, TX | 3.0 | 2.0 | 1300 | $1,325 | $1.02 | 24d | 1 | 0.12mi |
| 6105 Amelia Earhart Blvd Unit A Killeen, TX | 3.0 | 2.0 | 1300 | $1,395 | $1.07 | 44d | 1 | 0.15mi |
| 6008 Amelia Earhart Blvd Killeen, TX | 4.0 | 2.0 | 1611 | $2,000 | $1.24 | 44d | 1 | 0.15mi |
| 6109 Amelia Earhart Blvd Unit B Killeen, TX | 3.0 | 2.0 | 1300 | $1,300 | $1.00 | 44d | 1 | 0.16mi |
| 6116 Amelia Earhart Blvd Killeen, TX | 4.0 | 2.0 | 1605 | $1,695 | $1.06 | 24d | 1 | 0.20mi |
| 6114 Sally Ride Ln Killeen, TX | 3.0 | 2.0 | 1373 | $1,600 | $1.17 | 44d | 1 | 0.24mi |
| 6113 Harriet Tubman Ave Killeen, TX | 4.0 | 2.5 | 2267 | $2,200 | $0.97 | 14d | 1 | 0.25mi |
| 6008 Harriet Tubman Ave Unit B Killeen, TX | 3.0 | 2.0 | 1295 | $1,350 | $1.04 | 24d | 1 | 0.26mi |
| 1004 Barbara Jordan St Unit B Killeen, TX | 3.0 | 2.0 | 1296 | $1,250 | $0.96 | 24d | 1 | 0.27mi |
| 5814 Harriet Tubman Ave Unit B Killeen, TX | 3.0 | 2.0 | 1354 | $1,350 | $1.00 | 44d | 1 | 0.28mi |
| 6106 Harriet Tubman Ave Unit B Killeen, TX | 3.0 | 2.0 | 1295 | $1,250 | $0.97 | 24d | 1 | 0.28mi |
| 1002 Barbara Jordan St Killeen, TX | 3.0 | 2.0 | 1300 | $1,345 | $1.03 | 21d | 1 | 0.28mi |
| 1002 Barbara Jordan St Unit B Killeen, TX | 3.0 | 2.0 | 1300 | $1,345 | $1.03 | 44d | 1 | 0.28mi |
| 6203 Twistleaf Ln Killeen, TX | 3.0 | 2.0 | 1351 | $1,400 | $1.04 | 14d | 1 | 0.32mi |
| 5407 Two Brothers Ln Killeen, TX | 4.0 | 2.0 | 2010 | $2,295 | $1.14 | 14d | 1 | 0.33mi |
| 907 Lasso Dr Unit A Killeen, TX | 3.0 | 2.0 | 1267 | $1,250 | $0.99 | 44d | 1 | 0.43mi |
| 901 Lasso Dr Unit B Killeen, TX | 3.0 | 2.0 | 1248 | $1,195 | $0.96 | 44d | 1 | 0.46mi |
| 2009 Starlight Dr Killeen, TX | 4.0 | 2.0 | 1481 | $1,600 | $1.08 | 44d | 1 | 0.54mi |
| 1803 Cedarhill Dr Killeen, TX | 3.0 | 2.5 | 1260 | $850 | $0.67 | 44d | 1 | 0.73mi |
| 1904 Stardust St Killeen, TX | 3.0 | 2.0 | 1692 | $1,400 | $0.83 | 14d | 1 | 1.04mi |
| 2402 Lazy Ridge Dr Killeen, TX | 3.0 | 2.0 | 1337 | $1,400 | $1.05 | 44d | 1 | 1.09mi |
| 2001 Kenyon St Killeen, TX | 4.0 | 2.0 | 1543 | $1,225 | $0.79 | 24d | 1 | 1.19mi |
| 1700 Standridge St Killeen, TX | 3.0 | 2.0 | 1568 | $1,550 | $0.99 | 14d | 1 | 1.23mi |
| 2306 Hunt Dr Killeen, TX | 3.0 | 2.0 | 1287 | $1,250 | $0.97 | 21d | 1 | 1.27mi |
| 237 N Mary Jo Dr Harker Heights, TX | 3.0 | 2.0 | 2402 | $1,150 | $0.48 | 44d | 1 | 1.37mi |
| 1711 Godman St Killeen, TX | 3.0 | 2.0 | 1498 | $1,195 | $0.80 | 24d | 1 | 1.37mi |
| 4508 Tanglewood Cir Killeen, TX | 3.0 | 2.0 | 1311 | $1,295 | $0.99 | 24d | 1 | 1.38mi |
| 230 N Mary Jo Dr Apt A Harker Heights, TX | 3.0 | 2.5 | 1329 | $1,550 | $1.17 | 44d | 1 | 1.41mi |
| 2108 Acron Dr Killeen, TX | 3.0 | 2.0 | 1713 | $1,500 | $0.88 | 44d | 1 | 1.45mi |
| 1911 Hill St Killeen, TX | 3.0 | 2.0 | 1467 | $1,550 | $1.06 | 44d | 1 | 1.45mi |
| 1806 Kangaroo Ave Killeen, TX | 4.0 | 2.0 | 1543 | $1,595 | $1.03 | 24d | 1 | 1.46mi |
Listing history 24 events
-
2026-06-18days on market $127,000 Active 113 DOM
-
2026-06-17days on market $127,000 Active 112 DOM
-
2026-06-16days on market $127,000 Active 111 DOM
-
2026-06-15days on market $127,000 Active 110 DOM
-
2026-06-14days on market $127,000 Active 108 DOM
-
2026-06-13days on market $127,000 Active 107 DOM
-
2026-06-10days on market $127,000 Active 105 DOM
-
2026-06-09days on market $127,000 Active 104 DOM
-
2026-06-08days on market $127,000 Active 103 DOM
-
2026-06-07days on market $127,000 Active 102 DOM
-
2026-06-03days on market $127,000 Active 98 DOM
-
2026-06-02days on market $127,000 Active 97 DOM
-
2026-06-01days on market $127,000 Active 96 DOM
-
2026-05-31days on market $127,000 Active 95 DOM
-
2026-05-30days on market $127,000 Active 94 DOM
-
2026-02-27historical
-
2026-02-25$127,000 Active 937-char remark
Show marketing remark (937 chars)
Step inside to an open-concept layout featuring a gourmet kitchen with all stainless-steel appliances and a central island bar-perfect for cooking and entertaining. The spacious living areas provide plenty of room for relaxation and family time. Recent upgrades include newly completed front and back decks, offering the perfect spots for outdoor dining or enjoying the Texas breeze. A sliding glass door at the rear opens directly to the backyard, enhancing your indoor-outdoor lifestyle. Located near shopping, schools, and dining, this home is ideal for families, first-time buyers! For Key Features: 4 Bedrooms, 2 Bathrooms Gourmet Kitchen with Island Bar & Stainless Steel Appliances Newly Built Front & Back Decks Sliding Glass Door Leading to Backyard Brand-New Skirting Around Entire Home Prime Central Location with Easy Highway Access! Don't miss your chance to own this fantastic home! Schedule your showing today!
-
2026-02-22$127,000 Active
-
2025-11-07historical Active Under Contract
-
2025-08-30$145,000 Active
-
2025-07-24historical
-
2025-05-28price $145,000
-
2025-05-23price $165,000
-
2025-05-22$165 Active
ⓘ Source: listings_history table (triggers on properties + properties_extension) + one-shot
backfill from property_details.listing_events for pre-trigger history.
Tax reassessment forecast TX · Resets to sale price
- Current annual tax
- $1,138 · $95/mo
- Projected year-2 tax
- $2,324 · $194/mo
- Expected delta
- +$1,186/yr (+$99/mo · 104.2%)
ⓘ Screening estimate from a state-policy table — verify with the county assessor before closing.
Climate risk First Street
- Flood 1/10 Low FEMA zone X (unshaded) · 0% chance over 30 yrs
- Wildfire 5/10 Major
- Heat 8/10 Severe 7 d/yr ≥107°F today · 25 d/yr by 30 yrs out
- Wind 6/10 Major 62% chance of damaging wind over 30 yrs
- Air quality 1/10 Low 0 unhealthy d/yr today · 0 by 30 yrs out
Nearby sold comps map
Loading sold comps map…
Walkable amenities ~0.75 mi
Loading nearby amenities…
Taxation est. · year 1
- Rental income
- $18,432
- − Mortgage interest
- −$7,114
- − Property taxes
- −$1,138
- − Insurance
- −$635
- − Repairs & maintenance
- −$1,475
- − Management
- −$1,475
- − Depreciation
- −$3,695
- Taxable income
- $2,902
- Est. tax owed @ 24.0%
- −$696
- After-tax cash flow
- $4,100/yr
For passive investors: Depreciation is non-cash, so a rental often shows a tax loss while cash-flowing — sheltering income. Rental losses are passive: they offset passive income freely, and up to $25,000/yr can offset ordinary (W-2) income if you actively participate and your MAGI is under $100k (phasing out to $0 by $150k); unused losses carry forward. On sale, claimed depreciation is recaptured at up to 25%, and gains may owe capital-gains tax (a 1031 exchange can defer both). Figures are a year-1 estimate at your 24.0% rate — not tax advice; consult a CPA.
Condition & rehab AI · 6 photos
This manufactured home is in good condition with recent updates, including new decks and stainless steel appliances. Minor maintenance and cosmetic updates could further enhance its value.
Value-add opportunities
- Both Paint exterior and interior walls — Fresh paint enhances curb appeal and interior aesthetics
- Both Replace deck railings — Weathered railings can be a safety hazard and detract from curb appeal
- Both Replace outdoor lighting — Older or damaged lighting can be replaced with modern fixtures to improve curb appeal and safety
Renovation cost estimate screening
Value-add ROI direction
- Both Paint exterior and interior walls — Fresh paint enhances curb appeal and interior aesthetics ↑
- Both Replace deck railings — Weathered railings can be a safety hazard and detract from curb appeal ↑
- Both Replace outdoor lighting — Older or damaged lighting can be replaced with modern fixtures to improve curb appeal and safety ↑
ⓘ Cost ranges are severity-bucket heuristics (US national rule-of-thumb). Get contractor quotes + a written scope before underwriting a rehab budget.
Schools (NCES district)
- District
- Killeen ISD
- NCES district ID
- 4825660
- Math proficiency
- 31% ▼ -16.00%
- Reading proficiency
- 38% ▼ -3.00%
- Median HH income
- $47,665
- Composite
- 29.69/100
- National rank
- #6458
- State rank
- #524 of 826 in TX
Livability — Killeen
- Score
- 63/100
- State rank
- #853
- US rank
- #15359
Category grades
Schools grade is shown separately in the Schools card above.
Census & demographics
- Census place
- Killeen, TX
- County
- Bell County · 345,090 people
- City population
- 163,398
- Metro
- Killeen-Temple, TX
- Population (ZIP)
- 34,457
- Household income
- $48,564
- Rent vs Own
- Severe rent burden
- 2423.0
Population outlook (Bell County) Hauer SSP2
- Today (2025)
- 371,114 people
- By 2030
- 389,104 · +4.8%
- By 2040
- 420,592 · +13.3%
- By 2050
- 447,779 · +20.7%
- By 2075
- 499,130 · +34.5%
- By 2100
- 505,680 · +36.3%
Race, ethnicity, and origin ACS 2023
- Neighborhood character
- Highly diverse neighborhood (Simpson 0.71)
- Race & ethnicity
- Black 36% Hispanic / Latino 29% White 26% Two or more races 12% Asian 3%
- Hispanic origin (detail)
- Mexican 15% Puerto Rican 9% Dominican 1%
- Common ancestry
- Italian 2% Lithuanian 1% Portuguese 1%
- Foreign-born
- 8% · Canada, South Korea, Vietnam
- Languages at home
- 77% English-only · Spanish 16% Other Asian/Pacific 2% German/W. Germanic 1%
Political lean MEDSL · Bell
- 2024 margin
- R (+16.2) · D 41.3% · R 57.6% · Other 1.1%
- 2008→2024 swing
- -6.5pp toward R · 2008: -9.8pp · 2024: -16.2pp
- All cycles
- 2024: R+16.2 2020: R+8.5 2016: R+15.1 2012: R+16.4 2008: R+9.8
Not yet ingested
- Civics
- —
Market trends
- HPI YoY
- ▼ -178.13%
- Current HPI
- 184.405
- Rent YoY
- ▼ -1.49%
- Metro
- Killeen-Temple, TX
- State GDP YoY
- ▲ 3.95%
- F500 in state
- 110
Industry mix (Fortune 500 HQ in TX)
| Industry | F500 HQs | Revenue |
|---|---|---|
| Energy | 16 | $1,198B |
|
||
| Technology | 5 | $198B |
|
||
| Engineering / Construction | 4 | $72B |
|
||
| Energy Services | 3 | $60B |
|
||
| Utilities | 3 | $41B |
|
||
| Healthcare | 2 | $330B |
|
||
Price history
-23.0% since first listed9 events — show timeline
- 2026-02-27 Listing Removed — CTXMLS
- 2026-02-25 Listed $127,000 Unlock MLS
- 2026-02-22 Listed $127,000 CTXMLS
- 2025-11-07 Contingent — HARMLS
- 2025-08-30 Listed $145,000 HARMLS
- 2025-07-24 Listing Removed — CTXMLS
- 2025-05-28 Price Changed $145,000 CTXMLS
- 2025-05-23 Price Changed $165,000 CTXMLS
- 2025-05-22 Listed $165 CTXMLS
Property tax history
-1.3%/yrLatest (2025): $1,138 · -1.3% YoY. Source: county tax records.
Cash-flow waterfall
monthlySold comps — $/sqft
last 12 mo · ≤1 miLoading sold comps…