 🏗️ New Construction
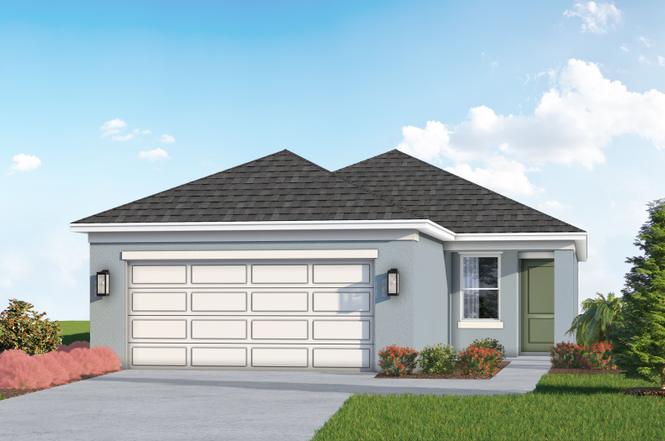
Cassia Plan · Lakewood Ranch, FL
Flood risk No data
- FEMA flood zone
- —
- Chance of flooding over 30 yrs
- —
- Est. flood insurance / yr
- —
Fire risk No data
- Est. fire insurance / yr
- —
Heat risk No data
- Hot days now (above threshold)
- —
- Hot days in 30 yrs
- —
Wind risk No data
- Chance of severe wind over 30 yrs
- —
Air-quality risk No data
- Unhealthy air days now
- —
- Unhealthy air days in 30 yrs
- —
Risk factors via First Street. Map © Google.
Why this score? — see what drove the D- grade
The composite is a weighted blend of 9 inputs, each scored 0–100. Each bar is that input's sub-score; the figure is the points it added to the 100-point composite (weight × sub-score).
- Cash flow +11.3/30.0
- ARV discount +7.5/15.0
- Schools +4.4/10.0
- 1% rule +3.7/10.0
- DSCR +3.3/10.0
- Livability +2.5/5.0
- Condition / age +2.5/5.0
- Rent growth +2.3/5.0
- Appreciation +0.0/10.0
$290,999
🖨 Deal sheet 📄 Offer letter ✓ Due diligence
Key facts
- 2 parking spots
- Listed 413 days
Property features AI
Finance
- Financial info: - List price approximately $290,999
- HOA & community: - Association fee approximately $113.74
Exterior
- Utilities: - Electric heating; - Central air conditioning
- Home design: - Plan name: Cassia; - New construction plan
- Construction: - Living area approximately 1312; - Composition roof (repeated for clarity)
- Exterior features: - Composition roof
Interior
- Bedrooms: - Two bedrooms
- Bathrooms: - Two bathrooms
- Heating & cooling: - Electric heating; - Central air conditioning
- Interior features: - 2 total bathrooms; - 2 total bedrooms
Neighborhood map
What this means for you Summary
Snapshot
- This is a 2-bed/2.0-bath single-family listed at $291k.
Deal economics
- At list price, monthly cash flow is $-113 ($-1k/yr) — negative.
- The deal already cash-flows at list — no discount required.
- To meet the 1% rule (rent ≥ 1% of price), the offer needs to be $271k (6.9% below list).
- Recommended offer: $256k (12.0% below list) — sets the bar for market timing.
- Cap rate 5.9% vs local median 3.3% in Lakewood Ranch — top-decile yield for the area; either an underpriced asset or a hidden risk that comps aren't pricing in. Stress-test before assuming the spread holds.
Location & tenants
- Location reads: area grade D — affects rentability + tenant quality, not the cash-flow math above.
- Manatee (suburban): math 54% / reading 50% proficiency, ranked #26 of 73 in FL (top 36%) — acceptable for families but not a draw, mixed tenant base, ~2y average lease.
- Market conditions: Rents soft (-0.9%/yr); 2170 active listings in the ZIP; 6 comparable units currently listed for rent nearby; rentals at typical pace (median 24d on market — plan ~3-4 weeks tenant-placement turnaround); high-income renter base; 7,472 units permitted in Manatee County in 2024 (1,782 in 5+ unit buildings).
Forward outlook
- Local home prices are declining (-3.0%/yr); year-one equity from $2k of loan paydown is wiped out by about $9k of value loss. Plan a longer hold.
- Manatee County population projected at +43% by 2050 — long-run rental-demand tailwind backs the buy-and-hold thesis.
Negotiation context
- It's been on market 413 days — a 12% lower offer ($256k) is reasonable based on typical stale-listing flexibility.
Questions for the listing agent
- What do current leases actually rent for vs. the listed asking? Can we see a recent rent roll and the last 12 months of T-12 income?
- It's been on market 413 days. Have you received any prior offers? Is the seller open to a 12% concession, seller financing, or rate buy-down credit?
- What does the HOA fee cover, when was the last increase, and are there any pending special assessments or reserve-fund shortfalls?
- Why hasn't it sold? Are there any deal-killer items the seller is aware of (foundation, flood, title, zoning, code violations)?
- Is there a deadline driving the sale (1031 exchange, divorce, estate, relocation)? That informs how much negotiation room exists.
- The area grade is low — what's the realistic commute time and amenity access for the typical tenant pool here? Any planned neighborhood developments (good or bad) we should know about?
- What's the average days-on-market for RENTAL listings here right now (not sales)? A rising rental-DOM trend means longer vacancies and softer asking-rent achievability than the comps imply.
- What's the recent tenant-quality profile in this submarket — average credit score on applications, eviction rate, late-payment / NSF rate, and stable-employment percentage? A property-management company in the area should have these aggregated.
- How much new for-sale + rental construction is in the pipeline within 1–3 miles? Heavy new supply typically softens prices + rents 12–24 months out; constrained supply supports both.
Investment metrics
- 1% rule
- 0.87% ✗
- Cap rate
- 5.85%
- Cash-on-cash
- -1.57%
- DSCR
- 0.93
- GRM
- 9.5
CMA / ARV
- ARV (on-the-fly)
- $309,632
- Comps found
- 12
Show comp detail 12 sales within ~0.75 mi
| Address | Dist | Beds/Ba | Sqft | Sold | Price | $/sf | Match |
|---|---|---|---|---|---|---|---|
| 13047 Bayberry Way | 0.23mi | 2/2.0 | 1,312 (0%) | 5mo | $297,220 | $227 | 85 |
| 13114 Sassafras Trl | 0.26mi | 2/2.0 | 1,312 (0%) | 3mo | $300,156 | $229 | 85 |
| 13147 Sassafras Trl | 0.31mi | 2/2.0 | 1,312 (0%) | 4mo | $313,000 | $239 | 82 |
| 4410 Hawthorn Ave | 0.29mi | 3/2.0 (+1) | 1,275 (-3%) | 2mo | $301,306 | $236 | 76 |
| 13131 Sassafras Trl | 0.30mi | 2/2.0 | 1,241 (-5%) | 2mo | $313,399 | $253 | 75 |
| 4429 Boxelder Ave | 0.23mi | 3/2.0 (+1) | 1,275 (-3%) | 6mo | $299,323 | $235 | 75 |
| 13142 Cedar Elm Ln | 0.17mi | 3/2.0 (+1) | 1,405 (+7%) | 3mo | $307,500 | $219 | 73 |
| 13253 Sassafras Trl | 0.37mi | 3/2.0 (+1) | 1,275 (-3%) | 2mo | $316,423 | $248 | 71 |
| 13105 Bayberry Way | 0.23mi | 3/2.0 (+1) | 1,400 (+7%) | 6mo | $309,469 | $221 | 68 |
| 13142 Sassafras Trl | 0.28mi | 3/2.0 (+1) | 1,400 (+7%) | 4mo | $318,756 | $228 | 68 |
| 13139 Sassafras Trl | 0.31mi | 3/2.0 (+1) | 1,400 (+7%) | 2mo | $337,668 | $241 | 68 |
| 4254 Golden Creek Ter | 0.61mi | 2/2.0 | 1,479 (+13%) | 6mo | $368,000 | $249 | 46 |
Match score weights: distance 35% · size 25% · config 20% · recency 20%. Top-matched comps best support the ARV.
Projected returns pro-forma
-3.0% appreciation · 0.0% rent growth · sell at horizon
- IRR
- -22.5%
- Equity multiple
- 0.25×
- Total profit
- $-65,226
- Equity at exit
- $46,167
- IRR
- -27.5%
- Equity multiple
- -0.11×
- Total profit
- $-96,326
- Equity at exit
- $26,771
Cash invested: $86,697 (down + closing). Projections, not guarantees.
Landlord ↔ Tenant lean methodology
- Overall (STATE)
- 87 Strongly Landlord-Friendly
- State Florida
- 87 Strongly Landlord-Friendly · R+3
- County
- — inherits STATE
- City
- — inherits STATE
ZIP-level market 34219
- Home prices YoY
- -23.7%
- Rents YoY
- -0.9%
- Active inventory
- 2170
- Price-to-rent
- 9.0×
Monthly cashflow live
- Estimated rent
- $2,708 high interval (Pro) →
- Mortgage (P&I)
- −$1,624
- Tax est. 1.5%
- −$387 /mo · $4,644/yr
- Insurance
- −$129
- HOA
- −$113
- Vacancy / Maint / Mgmt
- −$569
- Net cashflow
- $-113
Break-even live
UW: 25.0% down · 7.5% · 30yr · 1.5% tax · 5.0% vac · 8.0% maint · 8.0% mgmt
Financing live
Cash to close
- Down payment
- $77,408
- Closing costs
- $9,289
- Reserves months
- —
- Total cash needed
- —
Loan-product check · same deal, 3 products live
Conventional
25% down · 7.5% · 30yr
- Down + closing
- —
- Monthly P&I
- —
- Monthly cashflow
- —
- DSCR
- —
- Eligible?
- —
Personal DTI + credit; lowest rate.
DSCR
20% down · 8.5% · 30yr
- Down + closing
- —
- Monthly P&I
- —
- Monthly cashflow
- —
- DSCR
- —
- Eligible?
- —
No personal income docs; deal must DSCR.
Hard money
10% down · 12.0% · 12mo
- Down + closing
- —
- Monthly P&I
- —
- Monthly cashflow
- —
- DSCR
- —
- Eligible?
- —
Short-term bridge; refi at stabilization.
Rent comps 6 comps
| Address | Beds | Baths | Sqft | Rent | $/sqft | DOM | Units | Dist |
|---|---|---|---|---|---|---|---|---|
| 13832 Old Creek Ct Parrish, FL | 2.0 | 2.0 | 1641 | $2,700 | $1.65 | 24d | 1 | 0.46mi |
| 4723 Willow Bend Ave Parrish, FL | 2.0 | 2.0 | 1524 | $2,800 | $1.84 | 24d | 1 | 1.00mi |
| 4213 Berkeley Dr Parrish, FL | 3.0 | 2.0 | 1749 | $2,485 | $1.42 | 2d | 1 | 1.23mi |
| 3511 Wild Blossom Pl Parrish, FL | 3.0 | 2.0 | 1692 | $2,500 | $1.48 | 12d | 1 | 1.24mi |
| 11835 Crawford Parrish Ln Parrish, FL | 2.0 | 2.0 | 1156 | $2,800 | $2.42 | 24d | 1 | 1.28mi |
| 2910 122nd Ter E Parrish, FL | 3.0 | 2.0 | 1830 | $3,300 | $1.80 | 24d | 1 | 1.42mi |
HOA detail
- Monthly dues
- $113 · $1,356/yr
Listing history 14 events
-
2026-06-18days on market $290,999 Active 413 DOM
-
2026-06-17days on market $290,999 Active 412 DOM
-
2026-06-16days on market $290,999 Active 411 DOM
-
2026-06-15days on market $290,999 Active 410 DOM
-
2026-06-13days on market $290,999 Active 408 DOM
-
2026-06-13days on market $290,999 Active 407 DOM
-
2026-06-10days on market $290,999 Active 405 DOM
-
2026-06-09days on market $290,999 Active 404 DOM
-
2026-06-08days on market $290,999 Active 403 DOM
-
2026-06-08days on market $290,999 Active 402 DOM
-
2026-06-03days on market $290,999 Active 398 DOM
-
2026-06-02days on market $290,999 Active 397 DOM
-
2026-06-01days on market $290,999 Active 396 DOM
-
2026-05-31days on market $290,999 Active 395 DOM
ⓘ Source: listings_history table (triggers on properties + properties_extension) + one-shot
backfill from property_details.listing_events for pre-trigger history.
Nearby sold comps map
Loading sold comps map…
Walkable amenities ~0.75 mi
Loading nearby amenities…
Taxation est. · year 1
- Rental income
- $32,496
- − Mortgage interest
- −$17,344
- − Property taxes
- −$4,644
- − Insurance
- −$1,548
- − Repairs & maintenance
- −$2,600
- − Management
- −$2,600
- − HOA
- −$1,356
- − Depreciation
- −$9,007
- Taxable loss
- −$6,604
- Est. tax savings @ 24.0%
- +$1,585
- After-tax cash flow
- $223/yr
For passive investors: Depreciation is non-cash, so a rental often shows a tax loss while cash-flowing — sheltering income. Rental losses are passive: they offset passive income freely, and up to $25,000/yr can offset ordinary (W-2) income if you actively participate and your MAGI is under $100k (phasing out to $0 by $150k); unused losses carry forward. On sale, claimed depreciation is recaptured at up to 25%, and gains may owe capital-gains tax (a 1031 exchange can defer both). Figures are a year-1 estimate at your 24.0% rate — not tax advice; consult a CPA.
Schools (NCES district)
- District
- Manatee
- NCES district ID
- 1201230
- Math proficiency
- 54% ▼ -6.00%
- Reading proficiency
- 50% ▼ -2.00%
- Median HH income
- $49,607
- Composite
- 44.43/100
- National rank
- #2806
- State rank
- #26 of 73 in FL
Livability — Lakewood Ranch
No livability data for this city. (Only ~50 U.S. cities are tracked.)
Census & demographics
- County
- Manatee County · 416,364 people
- City population
- 33,319
- Metro
- North Port-Sarasota-Bradenton, FL
- Population (ZIP)
- 33,296
- Household income
- $113,773
- Rent vs Own
- Severe rent burden
- 219.0
Population outlook (Manatee County) Hauer SSP2
- Today (2025)
- 447,342 people
- By 2030
- 488,911 · +9.3%
- By 2040
- 567,934 · +27.0%
- By 2050
- 637,995 · +42.6%
- By 2075
- 781,970 · +74.8%
- By 2100
- 848,272 · +89.6%
Race, ethnicity, and origin ACS 2023
- Neighborhood character
- Predominantly White (75%)
- Race & ethnicity
- White 75% Hispanic / Latino 11% Two or more races 8% Black 8% Asian 2%
- Hispanic origin (detail)
- Mexican 2% Puerto Rican 3%
- Common ancestry
- Romanian 4% Hispanic 2% Russian 2%
- Foreign-born
- 10% · Canada, Dominican Republic, Jamaica
- Languages at home
- 88% English-only · Spanish 7% French/Haitian/Cajun 2% Other Asian/Pacific 1%
Political lean MEDSL · Manatee
- 2024 margin
- Strong R (+23.5) · D 37.9% · R 61.4%
- 2008→2024 swing
- -16.5pp toward R · 2008: -7.0pp · 2024: -23.5pp
- All cycles
- 2024: R+23.5 2020: R+16.1 2016: R+17.1 2012: R+12.5 2008: R+7.0
Not yet ingested
- Civics
- —
Market trends
- HPI YoY
- ▼ -84.45%
- Current HPI
- 271.7131
- Rent YoY
- ▼ -0.95%
- Metro
- North Port-Sarasota-Bradenton, FL
- State GDP YoY
- ▲ 3.28%
- F500 in state
- 36
Industry mix (Fortune 500 HQ in FL)
| Industry | F500 HQs | Revenue |
|---|---|---|
| Industrial Technology | 2 | $29B |
|
||
| Insurance | 2 | $17B |
|
||
| Retail | 1 | $60B |
|
||
| Technology Distribution | 1 | $58B |
|
||
| Homebuilding | 1 | $35B |
|
||
| Technology Manufacturing | 1 | $35B |
|
||
Cash-flow waterfall
monthlySold comps — $/sqft
last 12 mo · ≤1 miLoading sold comps…