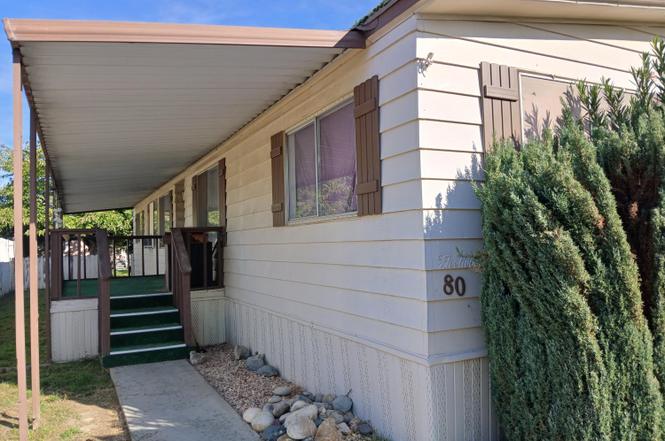
5505 W Tulare Ave #80 · Visalia, CA
Flood risk 1/10 · Minimal
- FEMA flood zone
- X (shaded)
- Chance of flooding over 30 yrs
- 0.0%
- Est. flood insurance / yr
- $507 – $1,088
Fire risk 5/10 · Moderate
- Est. fire insurance / yr
- $659 – $1,223
Heat risk 8/10 · Major
- Hot days now (above 105°F)
- 7 days/yr
- Hot days in 30 yrs
- 17 days/yr
Wind risk 1/10 · Minimal
- Chance of severe wind over 30 yrs
- —
Air-quality risk 10/10 · Severe
- Unhealthy air days now
- 37 days/yr
- Unhealthy air days in 30 yrs
- 39 days/yr
Risk factors via First Street. Map © Google.
Why this score? — see what drove the C- grade
The composite is a weighted blend of 9 inputs, each scored 0–100. Each bar is that input's sub-score; the figure is the points it added to the 100-point composite (weight × sub-score).
- Cash flow +15.0/30.0
- ARV discount +15.0/15.0
- 1% rule +5.0/10.0
- DSCR +5.0/10.0
- Livability +3.6/5.0
- Rent growth +3.3/5.0
- Schools +3.0/10.0
- Condition / age +2.5/5.0
- Appreciation +0.0/10.0
$45,000
🖨 Deal sheet 📄 Offer letter ✓ Due diligence
Listing remarks
GREAT OPPORTUNITY to own your own home in a family community located close to schools and shopping! This 3 bedroom and 2 bath home has a split floor plan and is close to the park amenities that include a clubhouse, a pool and basketball court. Please call to view home
Key facts
- Close to schools
- Clubhouse
- Split floor plan
Tags
Neighborhood map
What this means for you Summary
Snapshot
- This is a 3-bed/2.0-bath manufactured listed at $45k.
Deal economics
- At list price, monthly cash flow is $1k ($15k/yr) — positive.
- The deal already cash-flows at list — no discount required.
- Meets the 1% rule at list price ($2k rent vs $45k).
- Recommended offer: $40k (12.0% below list) — sets the bar for market timing.
- Cap rate 40.0% vs local median 3.3% in Visalia — top-decile yield for the area; either an underpriced asset or a hidden risk that comps aren't pricing in. Stress-test before assuming the spread holds.
Location & tenants
- Location reads 72/100 on livability (#196 in CA) — a middle-class / working-renter tenant base. Strengths: commute A+, housing A+, employment B; Watch: amenities D, crime D-, cost of living F.
- Visalia Unified (urban): math 30% / reading 40% proficiency, ranked #273 of 517 in CA (top 53%) — families likely to look elsewhere, expect single-tenant / working-renter base with shorter leases.
- Market conditions: Rents rising (+3.3%/yr); 233 active listings in the ZIP; 25 comparable units currently listed for rent nearby; rentals lingering (median 44d on market — plan ~5-8 weeks vacancy on turnover, expect pricing pressure); 60% of comp listings sitting > 30 days — soft ceiling on asking rent; solid renter incomes; 1,447 units permitted in Tulare County in 2024 (307 in 5+ unit buildings).
Forward outlook
- Local home prices are declining (-3.0%/yr); year-one equity from $311 of loan paydown is wiped out by about $1k of value loss. Plan a longer hold.
- Tulare County population projected at +10% by 2050 — modest demand growth; plan on rents tracking national, not racing it.
- At projected returns (-3.0% appreciation + 3.3% rent growth), your $13k cash investment doubles in ~1 year — after that, you're playing with house money.
Negotiation context
- It's been on market 124 days — a 12% lower offer ($40k) is reasonable based on typical stale-listing flexibility.
- 3 sale attempts; this cycle's ask has dropped $4k (8%) from the opening price — seller is motivated, your offer sets the floor, not the list.
Risks & watch-outs
- Climate carrying-cost: moderate wildfire risk; extreme-heat days projected 7→17/yr by 2055 (HVAC capex compounding) — expect insurance premiums to compound above CPI over the hold.
Questions for the listing agent
- It's been on market 124 days. Have you received any prior offers? Is the seller open to a 12% concession, seller financing, or rate buy-down credit?
- Built in 1976 — when were the roof, HVAC, electrical panel, plumbing, and water heater last replaced?
- Why hasn't it sold? Are there any deal-killer items the seller is aware of (foundation, flood, title, zoning, code violations)?
- Is there a deadline driving the sale (1031 exchange, divorce, estate, relocation)? That informs how much negotiation room exists.
- Crime grade is D in this area — have there been break-ins, vandalism, or insurance claims at this property in the last 3 years? What carrier currently insures it and at what premium?
- What's the average days-on-market for RENTAL listings here right now (not sales)? A rising rental-DOM trend means longer vacancies and softer asking-rent achievability than the comps imply.
- What's the recent tenant-quality profile in this submarket — average credit score on applications, eviction rate, late-payment / NSF rate, and stable-employment percentage? A property-management company in the area should have these aggregated.
- How much new for-sale + rental construction is in the pipeline within 1–3 miles? Heavy new supply typically softens prices + rents 12–24 months out; constrained supply supports both.
Investment metrics
- 1% rule
- 4.43% ✓
- Cap rate
- 40.01%
- Cash-on-cash
- 120.41%
- DSCR
- 6.36
- GRM
- 1.9
CMA / ARV
- ARV (on-the-fly)
- $77,760
- Comps found
- 9
Show comp detail 9 sales within ~0.75 mi
| Address | Dist | Beds/Ba | Sqft | Sold | Price | $/sf | Match |
|---|---|---|---|---|---|---|---|
| 5505 W Tulare Ave #80 | 0.00mi | 3/2.0 | 1,440 (0%) | 1mo | $45,000 | $31 | 100 |
| 5505 W Tulare Ave #406 | 0.02mi | 3/2.0 | 1,440 (0%) | 7mo | $63,000 | $44 | 94 |
| 5505 W Tulare Ave #337 | 0.02mi | 3/2.0 | 1,400 (-3%) | 4mo | $75,000 | $54 | 91 |
| 5505 W Tulare Ave W #246 | 0.02mi | 3/2.0 | 1,400 (-3%) | 6mo | $58,720 | $42 | 90 |
| 5505 W Tulare Ave #330 | 0.08mi | 3/2.0 | 1,344 (-7%) | 1mo | $105,000 | $78 | 84 |
| 5505 W Tulare Ave #317 | 0.02mi | 3/3.0 | 1,440 (0%) | 22mo | $78,000 | $54 | 77 |
| 5505 W Tulare Ave #339 | 0.02mi | 3/2.0 | 1,248 (-13%) | 9mo | $117,000 | $94 | 70 |
| 5505 W Tulare Ave #47 | 0.08mi | 2/2.0 (-1) | 1,344 (-7%) | 15mo | $53,000 | $39 | 68 |
| 5505 W Tulare Ave #402 | 0.08mi | 3/2.0 | 1,608 (+12%) | 21mo | $169,000 | $105 | 60 |
Match score weights: distance 35% · size 25% · config 20% · recency 20%. Top-matched comps best support the ARV.
Projected returns pro-forma
-3.0% appreciation · 3.32% rent growth · sell at horizon
- IRR
- —
- Equity multiple
- 6.87×
- Total profit
- $73,909
- Equity at exit
- $6,710
- IRR
- —
- Equity multiple
- 14.56×
- Total profit
- $170,831
- Equity at exit
- $3,891
Cash invested: $12,600 (down + closing). Projections, not guarantees.
Landlord ↔ Tenant lean methodology
- Overall (STATE)
- 18 Strongly Tenant-Friendly
- State California
- 18 Strongly Tenant-Friendly · D+13
- County
- — inherits STATE
- City
- — inherits STATE
ZIP-level market 93277
- Rents YoY
- 3.3%
- Active inventory
- 233
- Price-to-rent
- 1.9×
Monthly cashflow live
- Estimated rent
- $1,994 high interval (Pro) →
- Mortgage (P&I)
- −$236
- Tax est. 1.5%
- −$56 /mo · $675/yr
- Insurance
- −$19
- HOA
- −$0
- Vacancy / Maint / Mgmt
- −$419
- Net cashflow
- $1,264
Break-even live
UW: 25.0% down · 7.5% · 30yr · 1.5% tax · 5.0% vac · 8.0% maint · 8.0% mgmt
Financing live
Cash to close
- Down payment
- $11,250
- Closing costs
- $1,350
- Reserves months
- —
- Total cash needed
- —
Loan-product check · same deal, 3 products live
Conventional
25% down · 7.5% · 30yr
- Down + closing
- —
- Monthly P&I
- —
- Monthly cashflow
- —
- DSCR
- —
- Eligible?
- —
Personal DTI + credit; lowest rate.
DSCR
20% down · 8.5% · 30yr
- Down + closing
- —
- Monthly P&I
- —
- Monthly cashflow
- —
- DSCR
- —
- Eligible?
- —
No personal income docs; deal must DSCR.
Hard money
10% down · 12.0% · 12mo
- Down + closing
- —
- Monthly P&I
- —
- Monthly cashflow
- —
- DSCR
- —
- Eligible?
- —
Short-term bridge; refi at stabilization.
Rent comps 25 comps
| Address | Beds | Baths | Sqft | Rent | $/sqft | DOM | Units | Dist |
|---|---|---|---|---|---|---|---|---|
| 4928 Westgate Ct Visalia, CA | 2.0 | 1.0 | 1069 | $2,200 | $2.06 | 21d | 1 | 0.34mi |
| 4845 W Cypress Ave Visalia, CA | 2.0 | 2.0 | 1027 | $1,650 | $1.61 | 43d | 1 | 0.49mi |
| 1849 S Noyes St Visalia, CA | 3.0 | 2.0 | 1497 | $2,250 | $1.50 | 43d | 1 | 0.63mi |
| 700 S Linwood St Unit 720 Visalia, CA | 2.0 | 1.0 | 1054 | $1,650 | $1.57 | 43d | 1 | 0.75mi |
| 1927 S Julieann Ct Visalia, CA | 3.0 | 2.0 | 1671 | $2,000 | $1.20 | 21d | 1 | 0.86mi |
| 5948 W Crowley Ave Visalia, CA | 3.0 | 2.0 | 1566 | $2,270 | $1.45 | 21d | 1 | 0.93mi |
| 5936 W Oak Ave Visalia, CA | 3.0 | 2.0 | 1679 | $1,950 | $1.16 | 43d | 1 | 0.97mi |
| 4052 W Meadow Ave Visalia, CA | 2.0 | 1.0 | 877 | $1,340 | $1.53 | 21d | 1 | 0.98mi |
| 3900-4054 W Meadow Ave Unit 4052 Visalia, CA | 2.0 | 1.0 | 877 | $1,340 | $1.53 | 21d | 1 | 1.00mi |
| 3900-4054 W Meadow Ave Unit 3936 Visalia, CA | 2.0 | 1.0 | 877 | $1,365 | $1.56 | 43d | 1 | 1.00mi |
| 3936 W Meadow Ave Visalia, CA | 2.0 | 1.0 | 877 | $1,365 | $1.56 | 43d | 1 | 1.00mi |
| 4731 W School Ave Visalia, CA | 3.0 | 2.0 | 1280 | $1,900 | $1.48 | 43d | 1 | 1.02mi |
| 201 N Bollinger St Visalia, CA | 3.0 | 2.0 | 1194 | $1,995 | $1.67 | 43d | 1 | 1.04mi |
| 5433 W La Vida Ct Visalia, CA | 4.0 | 2.5 | 1513 | $2,095 | $1.38 | 43d | 1 | 1.07mi |
| 537 N Tommy St Visalia, CA | 3.0 | 2.0 | 1706 | $2,995 | $1.76 | 43d | 1 | 1.09mi |
| 1021 W Payson Ave Visalia, CA | 4.0 | 3.0 | 1758 | $2,595 | $1.48 | 43d | 1 | 1.13mi |
| 815 S Demaree St Unit 33 Visalia, CA | 2.0 | 1.5 | 890 | $1,300 | $1.46 | 21d | 1 | 1.13mi |
| 815 S Demaree St Unit 11 Visalia, CA | 3.0 | 1.5 | 924 | $1,400 | $1.52 | 43d | 1 | 1.13mi |
| 815 S Demaree St Apt 40 Visalia, CA | 2.0 | 1.5 | 890 | $1,300 | $1.46 | 43d | 1 | 1.13mi |
| 1212 S Demaree St Visalia, CA | 4.0 | 2.0 | 1644 | $2,500 | $1.52 | 43d | 1 | 1.15mi |
| 4700 W Caldwell Ave Visalia, CA | 1.0–3.0 | 1.0–2.0 | 889 | $2,581 | $2.90 | 13d | 5 | 1.34mi |
| 3417 W Campus Ave Visalia, CA | 2.0 | 2.0 | 1050 | $1,450 | $1.38 | 13d | 1 | 1.37mi |
| 4905 W Hemlock Ave Visalia, CA | 3.0 | 2.0 | 1563 | $1,895 | $1.21 | 21d | 1 | 1.39mi |
| 3618 W Country Ave Visalia, CA | 3.0 | 2.0 | 1618 | $2,095 | $1.29 | 43d | 1 | 1.45mi |
| 4230 W Grove Ct Visalia, CA | 3.0 | 2.0 | 1734 | $2,300 | $1.33 | 21d | 1 | 1.46mi |
Listing history 7 events
-
2026-04-05status Pending
-
2026-03-23status Active
-
2026-03-05status Pending
-
2026-02-04status Active
-
2026-01-18historical Active Under Contract
-
2026-01-02price $45,000
-
2025-11-13$49,000 Active
ⓘ Source: listings_history table (triggers on properties + properties_extension) + one-shot
backfill from property_details.listing_events for pre-trigger history.
Climate risk First Street
- Flood 1/10 Low FEMA zone X (shaded) · 0% chance over 30 yrs
- Wildfire 5/10 Major
- Heat 8/10 Severe 7 d/yr ≥105°F today · 17 d/yr by 30 yrs out
- Wind 1/10 Low
- Air quality 10/10 Extreme 37 unhealthy d/yr today · 39 by 30 yrs out
Nearby sold comps map
Loading sold comps map…
Walkable amenities ~0.75 mi
Loading nearby amenities…
Taxation est. · year 1
- Rental income
- $23,929
- − Mortgage interest
- −$2,521
- − Property taxes
- −$675
- − Insurance
- −$225
- − Repairs & maintenance
- −$1,914
- − Management
- −$1,914
- − Depreciation
- −$1,309
- Taxable income
- $15,371
- Est. tax owed @ 24.0%
- −$3,689
- After-tax cash flow
- $11,483/yr
For passive investors: Depreciation is non-cash, so a rental often shows a tax loss while cash-flowing — sheltering income. Rental losses are passive: they offset passive income freely, and up to $25,000/yr can offset ordinary (W-2) income if you actively participate and your MAGI is under $100k (phasing out to $0 by $150k); unused losses carry forward. On sale, claimed depreciation is recaptured at up to 25%, and gains may owe capital-gains tax (a 1031 exchange can defer both). Figures are a year-1 estimate at your 24.0% rate — not tax advice; consult a CPA.
Schools (NCES district)
- District
- Visalia Unified
- NCES district ID
- 0641160
- Math proficiency
- 30% ▼ -3.00%
- Reading proficiency
- 40% ▼ -10.00%
- Median HH income
- $51,672
- Composite
- 30.47/100
- National rank
- #6223
- State rank
- #273 of 517 in CA
Livability — Visalia
- Score
- 72/100
- State rank
- #196
- US rank
- #6351
Category grades
Schools grade is shown separately in the Schools card above.
Census & demographics
- Census place
- Visalia, CA
- County
- Tulare County · 323,826 people
- City population
- 163,333
- Metro
- Visalia, CA
- Population (ZIP)
- 53,985
- Household income
- $80,548
- Rent vs Own
- Severe rent burden
- 1896.0
Population outlook (Tulare County) Hauer SSP2
- Today (2025)
- 484,681 people
- By 2030
- 496,241 · +2.4%
- By 2040
- 518,507 · +7.0%
- By 2050
- 534,920 · +10.4%
- By 2075
- 548,417 · +13.2%
- By 2100
- 513,085 · +5.9%
Race, ethnicity, and origin ACS 2023
- Neighborhood character
- Diverse neighborhood (Simpson 0.60)
- Race & ethnicity
- Hispanic / Latino 48% White 40% Two or more races 21% Asian 4% Black 2% Native American 2%
- Hispanic origin (detail)
- Mexican 44%
- Common ancestry
- Russian 3% Iranian 2% Italian 2%
- Foreign-born
- 12% · Canada, China
- Languages at home
- 73% English-only · Spanish 22% Chinese 2% Other Asian/Pacific 1%
Political lean MEDSL · Tulare
- 2024 margin
- Strong R (+20.7) · D 38.5% · R 59.2% · Other 2.3%
- 2008→2024 swing
- -5.4pp toward R · 2008: -15.3pp · 2024: -20.7pp
- All cycles
- 2024: R+20.7 2020: R+7.8 2016: R+12.1 2012: R+17.8 2008: R+15.3
Not yet ingested
- Civics
- —
Market trends
- HPI YoY
- ▼ -371.43%
- Current HPI
- 310.349
- Rent YoY
- ▲ 3.32%
- Metro
- Visalia, CA
- State GDP YoY
- ▲ 3.21%
- F500 in state
- 116
Industry mix (Fortune 500 HQ in CA)
| Industry | F500 HQs | Revenue |
|---|---|---|
| Technology | 27 | $1,492B |
|
||
| Financial Services | 3 | $174B |
|
||
| Retail | 3 | $44B |
|
||
| Insurance | 3 | $26B |
|
||
| Media / Entertainment | 2 | $115B |
|
||
| Pharmaceuticals / Biotech | 2 | $62B |
|
||
Price history
-8.2% since first listed7 events — show timeline
- 2026-04-05 Pending — TCMLS
- 2026-03-23 Relisted — TCMLS
- 2026-03-05 Pending — TCMLS
- 2026-02-04 Relisted — TCMLS
- 2026-01-18 Contingent — TCMLS
- 2026-01-02 Price Changed $45,000 TCMLS
- 2025-11-13 Listed $49,000 TCMLS
Cash-flow waterfall
monthlySold comps — $/sqft
last 12 mo · ≤1 miLoading sold comps…