513 Sandusky St · Catlin, IL
Flood risk 1/10 · Minimal
- FEMA flood zone
- X (unshaded)
- Chance of flooding over 30 yrs
- 0.0%
- Est. flood insurance / yr
- $473 – $860
Fire risk 1/10 · Minimal
- Est. fire insurance / yr
- $804 – $1,492
Heat risk 3/10 · Minor
- Hot days now (above 105°F)
- 7 days/yr
- Hot days in 30 yrs
- 18 days/yr
Wind risk 2/10 · Minimal
- Chance of severe wind over 30 yrs
- 1.0%
Air-quality risk 2/10 · Minimal
- Unhealthy air days now
- 1 days/yr
- Unhealthy air days in 30 yrs
- 2 days/yr
Risk factors via First Street. Map © Google.
Why this score? — see what drove the A grade
The composite is a weighted blend of 9 inputs, each scored 0–100. Each bar is that input's sub-score; the figure is the points it added to the 100-point composite (weight × sub-score).
- Cash flow +28.7/30.0
- ARV discount +15.0/15.0
- DSCR +10.0/10.0
- Appreciation +10.0/10.0
- 1% rule +8.0/10.0
- Schools +5.0/10.0
- Livability +3.4/5.0
- Rent growth +2.5/5.0
- Condition / age +2.5/5.0
$75,000
🖨 Deal sheet 📄 Offer letter ✓ Due diligence
Listing remarks
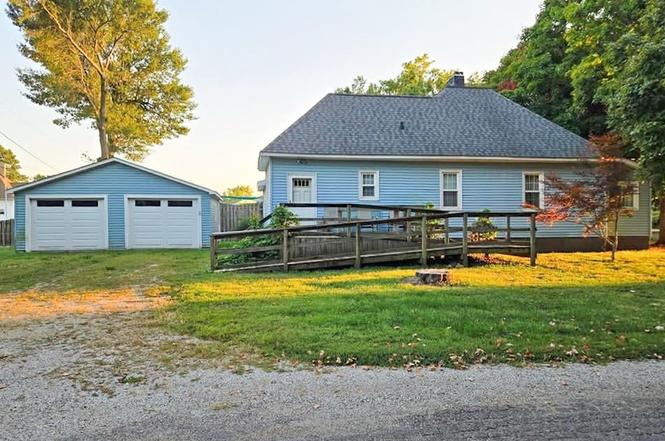
Welcome to this delightful 2-bedroom, 1-bath home nestled on a spacious corner lot in the peaceful Town of Catlin. Offering comfort, convenience, and flexibility, this property is perfect for first-time buyers, downsizers, or anyone looking to put their personal touch on a solid home. Step inside to find a warm and inviting layout, including a cozy den that can easily be converted into a third bedroom, home office, or creative space — the choice is yours! The home features a 2-car garage for added storage and convenience, as well as a side deck perfect for relaxing evenings or entertaining guests. Whether you're looking to move right in or make a few updates to make it your own, this
Key facts
- Cozy den
- Side deck
- Corner lot
Tags
Property features AI
Exterior
- Parking: Detached 2-car garage
- Utilities: Public and well water sources; Public sewer
- Home design: Single-family residence; One level / single-story
- Construction: Vinyl siding
- Exterior features: Gravel road access; Shingle roof
Interior
- Kitchen: Gas water heater
- Bedrooms: Rooms total: 7 (includes bedrooms and living spaces)
- Bathrooms: 1 full bathroom
- Heating & cooling: Central air conditioning; Natural gas heating with forced air and hot water components
- Interior features: One fireplace; Unfinished full basement
- Laundry & utility: Main-level laundry
Neighborhood map
What this means for you Summary
Snapshot
- This is a 2-bed/1.0-bath single-family listed at $75k.
Deal economics
- At list price, monthly cash flow is $250 ($3k/yr) — positive.
- The deal already cash-flows at list — no discount required.
- Meets the 1% rule at list price ($972 rent vs $75k).
- Recommended offer: $66k (12.0% below list) — sets the bar for market timing.
Location & tenants
- Location reads 67/100 on livability (#522 in IL) — a middle-class / working-renter tenant base. Strengths: crime A+, cost of living A+, housing A+; Watch: schools D+, amenities F, commute F.
- Market conditions: 14 active listings in the ZIP; 3 comparable units currently listed for rent nearby; rentals leasing fast (median 3d on market — plan ~1-2 weeks tenant-placement turnaround); 8 units permitted in Vermilion County in 2024 (0 in 5+ unit buildings).
Forward outlook
- In year one you build about $8k of equity ($519 loan paydown + $8k appreciation (10.0% local appreciation)).
- Vermilion County population projected at -24% by 2050 — secular population decline; favor cash flow + early exit over multi-decade hold.
- At projected returns (10.0% appreciation + 3.0% rent growth), your $21k cash investment doubles in ~2 years — after that, you're playing with house money.
- By year 5, paydown + projected appreciation supports a ~$37k cash-out refi (75% LTV) — recoverable capital for the next deal without selling this one.
Negotiation context
- It's been on market 257 days — a 12% lower offer ($66k) is reasonable based on typical stale-listing flexibility.
Risks & watch-outs
- Watch-outs: built in 1926 — expect roof / HVAC / electrical / plumbing capex.
Questions for the listing agent
- It's been on market 257 days. Have you received any prior offers? Is the seller open to a 12% concession, seller financing, or rate buy-down credit?
- Built in 1926 — when were the roof, HVAC, electrical panel, plumbing, and water heater last replaced?
- Why hasn't it sold? Are there any deal-killer items the seller is aware of (foundation, flood, title, zoning, code violations)?
- Is there a deadline driving the sale (1031 exchange, divorce, estate, relocation)? That informs how much negotiation room exists.
- Schools are D-rated, which usually means shorter tenancies and higher turnover. Who's the typical renter profile here, and what's been the actual vacancy rate?
- What's the average days-on-market for RENTAL listings here right now (not sales)? A rising rental-DOM trend means longer vacancies and softer asking-rent achievability than the comps imply.
- What's the recent tenant-quality profile in this submarket — average credit score on applications, eviction rate, late-payment / NSF rate, and stable-employment percentage? A property-management company in the area should have these aggregated.
- How much new for-sale + rental construction is in the pipeline within 1–3 miles? Heavy new supply typically softens prices + rents 12–24 months out; constrained supply supports both.
Investment metrics
- 1% rule
- 1.30% ✓
- Cap rate
- 10.28%
- Cash-on-cash
- 14.26%
- DSCR
- 1.63
- GRM
- 6.4
CMA / ARV
- ARV (on-the-fly)
- $149,056
- Comps found
- 4
Show comp detail 4 sales within ~0.75 mi
| Address | Dist | Beds/Ba | Sqft | Sold | Price | $/sf | Match |
|---|---|---|---|---|---|---|---|
| 103 W Center St | 0.07mi | 2/1.0 | 1,062 (-2%) | 22mo | $94,700 | $89 | 74 |
| 504 Walnut St | 0.21mi | 3/1.0 (+1) | 1,010 (-7%) | 20mo | $138,500 | $137 | 57 |
| 107 Burris St | 0.34mi | 3/1.0 (+1) | 1,000 (-8%) | 21mo | $155,000 | $155 | 48 |
| 102 State St | 0.58mi | 3/1.0 (+1) | 950 (-13%) | 7mo | $121,800 | $128 | 41 |
Match score weights: distance 35% · size 25% · config 20% · recency 20%. Top-matched comps best support the ARV.
Projected returns pro-forma
10.0% appreciation · 3.0% rent growth · sell at horizon
- IRR
- 34.8%
- Equity multiple
- 3.70×
- Total profit
- $56,752
- Equity at exit
- $67,566
- IRR
- 30.0%
- Equity multiple
- 8.36×
- Total profit
- $154,659
- Equity at exit
- $145,709
Cash invested: $21,000 (down + closing). Projections, not guarantees.
Landlord ↔ Tenant lean methodology
- Overall (STATE)
- 43 Moderately Tenant-Leaning
- State Illinois
- 43 Moderately Tenant-Leaning · D+7
- County
- — inherits STATE
- City
- — inherits STATE
ZIP-level market 61817
- Home prices YoY
- 10.2%
- Active inventory
- 14
- Price-to-rent
- 6.4×
Monthly cashflow live
- Estimated rent
- $972 medium interval (Pro) →
- Mortgage (P&I)
- −$393
- Tax est. 1.5%
- −$94 /mo · $1,125/yr
- Insurance
- −$31
- HOA
- −$0
- Vacancy / Maint / Mgmt
- −$204
- Net cashflow
- $250
Break-even live
UW: 25.0% down · 7.5% · 30yr · 1.5% tax · 5.0% vac · 8.0% maint · 8.0% mgmt
Financing live
Cash to close
- Down payment
- $18,750
- Closing costs
- $2,250
- Reserves months
- —
- Total cash needed
- —
Loan-product check · same deal, 3 products live
Conventional
25% down · 7.5% · 30yr
- Down + closing
- —
- Monthly P&I
- —
- Monthly cashflow
- —
- DSCR
- —
- Eligible?
- —
Personal DTI + credit; lowest rate.
DSCR
20% down · 8.5% · 30yr
- Down + closing
- —
- Monthly P&I
- —
- Monthly cashflow
- —
- DSCR
- —
- Eligible?
- —
No personal income docs; deal must DSCR.
Hard money
10% down · 12.0% · 12mo
- Down + closing
- —
- Monthly P&I
- —
- Monthly cashflow
- —
- DSCR
- —
- Eligible?
- —
Short-term bridge; refi at stabilization.
Rent comps 3 comps
| Address | Beds | Baths | Sqft | Rent | $/sqft | DOM | Units | Dist |
|---|---|---|---|---|---|---|---|---|
| 203 Wabash Ave Catlin, IL | 3.0 | 1.0 | 1150 | $950 | $0.83 | 44d | 1 | 0.60mi |
| 207 Martin Ct Catlin, IL | 2.0 | 1.5 | 850 | $999 | $1.18 | 2d | 1 | 0.68mi |
| 211 Martin Ct Apt A Catlin, IL | 2.0 | 1.5 | 990 | $975 | $0.98 | 2d | 1 | 0.71mi |
Listing history 18 events
-
2026-06-19days on market $75,000 Active 257 DOM
-
2026-06-18days on market $75,000 Active 256 DOM
-
2026-06-17days on market $75,000 Active 255 DOM
-
2026-06-16days on market $75,000 Active 254 DOM
-
2026-06-15days on market $75,000 Active 253 DOM
-
2026-06-14days on market $75,000 Active 251 DOM
-
2026-06-12days on market $75,000 Active 250 DOM
-
2026-06-09days on market $75,000 Active 247 DOM
-
2026-06-08days on market $75,000 Active 246 DOM
-
2026-06-07pricedays on market $75,000 Active 245 DOM
-
2026-06-03days on market $85,000 Active 241 DOM
-
2026-06-02days on market $85,000 Active 240 DOM
-
2026-06-01days on market $85,000 Active 239 DOM
-
2026-05-31days on market $85,000 Active 238 DOM
-
2026-05-30days on market $85,000 Active 237 DOM
-
2026-05-06price $85,000
-
2026-03-31price $100,000
-
2025-10-06$110,000 Active
ⓘ Source: listings_history table (triggers on properties + properties_extension) + one-shot
backfill from property_details.listing_events for pre-trigger history.
Climate risk First Street
- Flood 1/10 Low FEMA zone X (unshaded) · 0% chance over 30 yrs
- Wildfire 1/10 Low
- Heat 3/10 Moderate 7 d/yr ≥105°F today · 18 d/yr by 30 yrs out
- Wind 2/10 Low 100% chance of damaging wind over 30 yrs
- Air quality 2/10 Low 1 unhealthy d/yr today · 2 by 30 yrs out
Nearby sold comps map
Loading sold comps map…
Walkable amenities ~0.75 mi
Loading nearby amenities…
Taxation est. · year 1
- Rental income
- $11,663
- − Mortgage interest
- −$4,201
- − Property taxes
- −$1,125
- − Insurance
- −$375
- − Repairs & maintenance
- −$933
- − Management
- −$933
- − Depreciation
- −$2,182
- Taxable income
- $1,914
- Est. tax owed @ 24.0%
- −$459
- After-tax cash flow
- $2,535/yr
For passive investors: Depreciation is non-cash, so a rental often shows a tax loss while cash-flowing — sheltering income. Rental losses are passive: they offset passive income freely, and up to $25,000/yr can offset ordinary (W-2) income if you actively participate and your MAGI is under $100k (phasing out to $0 by $150k); unused losses carry forward. On sale, claimed depreciation is recaptured at up to 25%, and gains may owe capital-gains tax (a 1031 exchange can defer both). Figures are a year-1 estimate at your 24.0% rate — not tax advice; consult a CPA.
Schools (NCES district)
No district data.
Livability — Catlin
- Score
- 67/100
- State rank
- #522
- US rank
- #10766
Category grades
Schools grade is shown separately in the Schools card above.
Census & demographics
- Census place
- Catlin, IL
- Population (ZIP)
- 2,447
Population outlook (Vermilion County) Hauer SSP2
- Today (2025)
- 72,775 people
- By 2030
- 69,235 · -4.9%
- By 2040
- 62,360 · -14.3%
- By 2050
- 55,539 · -23.7%
- By 2075
- 40,606 · -44.2%
- By 2100
- 26,985 · -62.9%
Race, ethnicity, and origin ACS 2023
- Neighborhood character
- Predominantly White (92%)
- Race & ethnicity
- White 92% Hispanic / Latino 6% Two or more races 1% Black 1%
- Hispanic origin (detail)
- Mexican 4% Cuban 2%
- Common ancestry
- Slovak 5% Iranian 2% Lithuanian 1%
- Foreign-born
- 4% · Canada
- Languages at home
- 96% English-only · Spanish 4%
Political lean MEDSL · Vermilion
- 2024 margin
- Solid R (+35.7) · D 31.4% · R 67.0% · Other 1.6%
- 2008→2024 swing
- -36.2pp toward R · 2008: 0.6pp · 2024: -35.7pp
- All cycles
- 2024: R+35.7 2020: R+32.9 2016: R+29.2 2012: R+15.7 2008: D+0.6
Not yet ingested
- Civics
- —
Market trends
- HPI YoY
- ▲ 24.05%
- Current HPI
- 260.408
- Rent YoY
- —
- Metro
- —
- State GDP YoY
- ▲ 1.59%
- F500 in state
- 60
Industry mix (Fortune 500 HQ in IL)
| Industry | F500 HQs | Revenue |
|---|---|---|
| Insurance | 4 | $201B |
|
||
| Consumer Goods | 4 | $87B |
|
||
| Industrial Machinery | 3 | $64B |
|
||
| Healthcare | 2 | $55B |
|
||
| Retail / Pharmacy | 1 | $148B |
|
||
| Agriculture / Food | 1 | $86B |
|
||
Price history
-22.7% since first listed3 events — show timeline
- 2026-05-06 Price Changed $85,000 CIBR
- 2026-03-31 Price Changed $100,000 CIBR
- 2025-10-06 Listed $110,000 CIBR
Property tax history
-0.7%/yrLatest (2024): $75 · -3.7% YoY. Source: county tax records.
Cash-flow waterfall
monthlySold comps — $/sqft
last 12 mo · ≤1 miLoading sold comps…