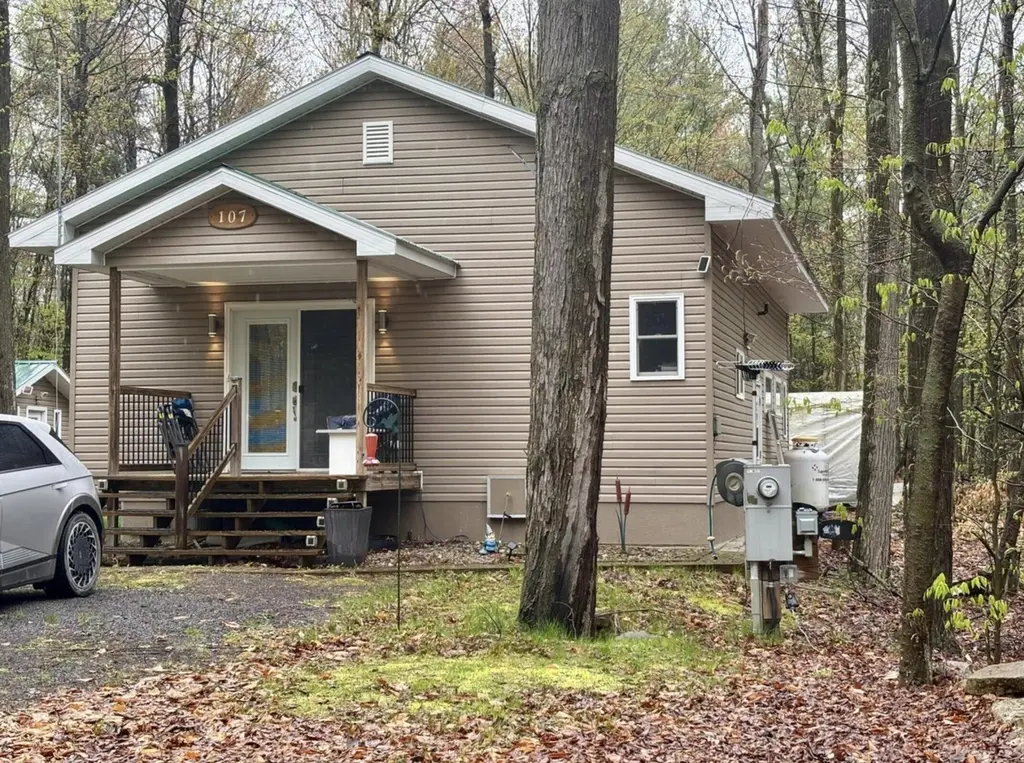
107 Pinewood Dr · Altona, NY
Flood risk 3/10 · Minor
- FEMA flood zone
- X (unshaded)
- Chance of flooding over 30 yrs
- 0.1%
- Est. flood insurance / yr
- $507 – $1,088
Fire risk 3/10 · Minor
- Est. fire insurance / yr
- $691 – $1,283
Heat risk 1/10 · Minimal
- Hot days now (above 92°F)
- 7 days/yr
- Hot days in 30 yrs
- 15 days/yr
Wind risk 1/10 · Minimal
- Chance of severe wind over 30 yrs
- 0.0%
Air-quality risk 2/10 · Minimal
- Unhealthy air days now
- 0 days/yr
- Unhealthy air days in 30 yrs
- 1 days/yr
Risk factors via First Street. Map © Google.
Why this score? — see what drove the A- grade
The composite is a weighted blend of 9 inputs, each scored 0–100. Each bar is that input's sub-score; the figure is the points it added to the 100-point composite (weight × sub-score).
- Cash flow +28.1/30.0
- ARV discount +15.0/15.0
- DSCR +10.0/10.0
- Appreciation +10.0/10.0
- 1% rule +8.9/10.0
- Schools +4.1/10.0
- Livability +2.6/5.0
- Rent growth +2.5/5.0
- Condition / age +2.5/5.0
$64,200
🖨 Deal sheet 📄 Offer letter ✓ Due diligence
Listing remarks
Seasonal living on owned land at Stonewall Acres Campground with this two bedroom, one bathroom cottage on 0.22 acre lot. Beautiful open concept main living with cozy propane fireplace to enjoy in the cooler months. Small detached shed for all your storage needs with covered area to store a lawn mower to outdoor toys. Annual HOA fee of $500 to enjoy the pool, clubhouse, mini put, road maintenance and public water.
Key facts
- 9,583 sq ft lot
- Community pool
- Built 2015
Property features AI
Finance
- HOA & community: Community pool
Exterior
- Parking: Outside parking
- Utilities: Public water; Septic tank; 100 Amp electric service; Electricity connected; Water connected
- Home design: Cabin-style single family residence; Updated/remodeled condition
- Construction: Vinyl siding; Metal roof; Slab foundation; Built on a 0.22-acre level lot
- Exterior features: Exterior lighting; Community pool; Shed(s)
Interior
- Kitchen: Cooktop; Oven; Refrigerator
- Bedrooms: 5 total rooms (includes bedrooms and living spaces)
- Flooring: Laminate; Tile
- Bathrooms: 1 full bathroom
- Heating & cooling: Propane heating; Fireplace(s)
- Interior features: Recessed lighting; Storage; Double pane windows
Neighborhood map
What this means for you Summary
Snapshot
- This is a 1-bed/1.0-bath single-family listed at $64k.
Deal economics
- At list price, monthly cash flow is $201 ($2k/yr) — positive.
- The deal already cash-flows at list — no discount required.
- Meets the 1% rule at list price ($890 rent vs $64k).
- Recommended offer: $62k (3.0% below list) — sets the bar for market timing.
Location & tenants
- Location reads 51/100 on livability (#1,166 in NY) — a working-class tenant base; expect higher turnover. Strengths: cost of living A+, crime A; Watch: health & safety C-, schools F, amenities F.
- Northern Adirondack Central School District (rural): math 47% / reading 49% proficiency, ranked #430 of 590 in NY (top 73%) — families likely to look elsewhere, expect single-tenant / working-renter base with shorter leases.
- Market conditions: 14 active listings in the ZIP; 192 units permitted in Clinton County in 2024 (64 in 5+ unit buildings).
Forward outlook
- In year one you build about $7k of equity ($444 loan paydown + $6k appreciation (10.0% local appreciation)).
- Clinton County population projected at -16% by 2050 — secular population decline; favor cash flow + early exit over multi-decade hold.
- At projected returns (10.0% appreciation + 3.0% rent growth), your $18k cash investment doubles in ~2 years — after that, you're playing with house money.
- By year 5, paydown + projected appreciation supports a ~$32k cash-out refi (75% LTV) — recoverable capital for the next deal without selling this one.
Negotiation context
- It's been on market 52 days — a 3% lower offer ($62k) is reasonable based on typical stale-listing flexibility.
Risks & watch-outs
- Watch-outs: property tax is 2.6% of price.
Questions for the listing agent
- It's been on market 52 days. Have you received any prior offers? Is the seller open to a 3% concession, seller financing, or rate buy-down credit?
- Property tax is high relative to price — has the assessment been appealed recently, and will the sale trigger a re-assessment?
- Is there a deadline driving the sale (1031 exchange, divorce, estate, relocation)? That informs how much negotiation room exists.
- Schools are F-rated, which usually means shorter tenancies and higher turnover. Who's the typical renter profile here, and what's been the actual vacancy rate?
- What's the average days-on-market for RENTAL listings here right now (not sales)? A rising rental-DOM trend means longer vacancies and softer asking-rent achievability than the comps imply.
- What's the recent tenant-quality profile in this submarket — average credit score on applications, eviction rate, late-payment / NSF rate, and stable-employment percentage? A property-management company in the area should have these aggregated.
- How much new for-sale + rental construction is in the pipeline within 1–3 miles? Heavy new supply typically softens prices + rents 12–24 months out; constrained supply supports both.
Investment metrics
- 1% rule
- 1.39% ✓
- Cap rate
- 10.06%
- Cash-on-cash
- 13.44%
- DSCR
- 1.60
- GRM
- 6.0
CMA / ARV
- ARV (median comp)
- $78,875
- List price
- $64,200
- Delta
- -18.61%
- Verdict
- UNDERPRICED
- Comps
- 2 within 1.0 mi
Projected returns pro-forma
10.0% appreciation · 3.0% rent growth · sell at horizon
- IRR
- 34.2%
- Equity multiple
- 3.66×
- Total profit
- $47,836
- Equity at exit
- $57,836
- IRR
- 29.5%
- Equity multiple
- 8.28×
- Total profit
- $130,883
- Equity at exit
- $124,726
Cash invested: $17,976 (down + closing). Projections, not guarantees.
Landlord ↔ Tenant lean methodology
- Overall (STATE)
- 15 Strongly Tenant-Friendly
- State New York
- 15 Strongly Tenant-Friendly · D+10
- County
- — inherits STATE
- City
- — inherits STATE
ZIP-level market 12910
- Home prices YoY
- 4.5%
- Active inventory
- 14
- Price-to-rent
- 6.0×
Monthly cashflow live
- Estimated rent
- $890 medium interval (Pro) →
- Mortgage (P&I)
- −$337
- Tax from tax record
- −$138 /mo · $1,656/yr
- Insurance
- −$27
- HOA
- −$0
- Vacancy / Maint / Mgmt
- −$187
- Net cashflow
- $201
Break-even live
UW: 25.0% down · 7.5% · 30yr · 1.5% tax · 5.0% vac · 8.0% maint · 8.0% mgmt
Financing live
Cash to close
- Down payment
- $16,050
- Closing costs
- $1,926
- Reserves months
- —
- Total cash needed
- —
Loan-product check · same deal, 3 products live
Conventional
25% down · 7.5% · 30yr
- Down + closing
- —
- Monthly P&I
- —
- Monthly cashflow
- —
- DSCR
- —
- Eligible?
- —
Personal DTI + credit; lowest rate.
DSCR
20% down · 8.5% · 30yr
- Down + closing
- —
- Monthly P&I
- —
- Monthly cashflow
- —
- DSCR
- —
- Eligible?
- —
No personal income docs; deal must DSCR.
Hard money
10% down · 12.0% · 12mo
- Down + closing
- —
- Monthly P&I
- —
- Monthly cashflow
- —
- DSCR
- —
- Eligible?
- —
Short-term bridge; refi at stabilization.
Listing history 16 events
-
2026-06-18days on market $64,200 Active 52 DOM
-
2026-06-17days on market $64,200 Active 51 DOM
-
2026-06-16days on market $64,200 Active 50 DOM
-
2026-06-15days on market $64,200 Active 49 DOM
-
2026-06-13days on market $64,200 Active 47 DOM
-
2026-06-12days on market $64,200 Active 46 DOM
-
2026-06-09days on market $64,200 Active 43 DOM
-
2026-06-08days on market $64,200 Active 42 DOM
-
2026-06-07days on market $64,200 Active 41 DOM
-
2026-06-07days on market $64,200 Active 40 DOM
-
2026-06-04days on market $64,200 Active 37 DOM
-
2026-06-02days on market $64,200 Active 36 DOM
-
2026-06-01days on market $64,200 Active 35 DOM
-
2026-05-31days on market $64,200 Active 34 DOM
-
2026-04-27$69,500 Active 417-char remark
-
2025-06-12price $69,500
ⓘ Source: listings_history table (triggers on properties + properties_extension) + one-shot
backfill from property_details.listing_events for pre-trigger history.
Tax reassessment forecast NY · Partial reset (capped growth)
- Current annual tax
- $1,656 · $138/mo
- Projected year-2 tax
- $1,656 · $138/mo
- Expected delta
- $0/yr ($0/mo · 0.0%)
ⓘ Screening estimate from a state-policy table — verify with the county assessor before closing.
Climate risk First Street
- Flood 3/10 Moderate FEMA zone X (unshaded) · 10% chance over 30 yrs
- Wildfire 3/10 Moderate
- Heat 1/10 Low 7 d/yr ≥92°F today · 15 d/yr by 30 yrs out
- Wind 1/10 Low 0% chance of damaging wind over 30 yrs
- Air quality 2/10 Low 0 unhealthy d/yr today · 1 by 30 yrs out
Nearby sold comps map
Loading sold comps map…
Walkable amenities ~0.75 mi
Loading nearby amenities…
Taxation est. · year 1
- Rental income
- $10,675
- − Mortgage interest
- −$3,596
- − Property taxes
- −$1,656
- − Insurance
- −$321
- − Repairs & maintenance
- −$854
- − Management
- −$854
- − Depreciation
- −$1,868
- Taxable income
- $1,526
- Est. tax owed @ 24.0%
- −$366
- After-tax cash flow
- $2,050/yr
For passive investors: Depreciation is non-cash, so a rental often shows a tax loss while cash-flowing — sheltering income. Rental losses are passive: they offset passive income freely, and up to $25,000/yr can offset ordinary (W-2) income if you actively participate and your MAGI is under $100k (phasing out to $0 by $150k); unused losses carry forward. On sale, claimed depreciation is recaptured at up to 25%, and gains may owe capital-gains tax (a 1031 exchange can defer both). Figures are a year-1 estimate at your 24.0% rate — not tax advice; consult a CPA.
Schools (NCES district)
- District
- Northern Adirondack Central School District
- NCES district ID
- 3621260
- Math proficiency
- 47% ▬ 0.00%
- Reading proficiency
- 49% ▲ 2.00%
- Median HH income
- $44,656
- Composite
- 40.62/100
- National rank
- #3689
- State rank
- #430 of 590 in NY
Livability — Altona
- Score
- 51/100
- State rank
- #1166
- US rank
- #25387
Category grades
Schools grade is shown separately in the Schools card above.
Census & demographics
- Population (ZIP)
- 1,994
Population outlook (Clinton County) Hauer SSP2
- Today (2025)
- 78,791 people
- By 2030
- 76,848 · -2.5%
- By 2040
- 71,579 · -9.2%
- By 2050
- 66,471 · -15.6%
- By 2075
- 57,361 · -27.2%
- By 2100
- 47,232 · -40.1%
Race, ethnicity, and origin ACS 2023
- Neighborhood character
- Predominantly White (85%)
- Race & ethnicity
- White 85% Hispanic / Latino 7% Black 5% Asian 2% Two or more races 1%
- Hispanic origin (detail)
- Mexican 2% Puerto Rican 3%
- Common ancestry
- Lithuanian 23% Iranian 2% Slovak 1%
- Foreign-born
- 4% · Canada
- Languages at home
- 96% English-only · Spanish 2% Tagalog/Filipino 1%
Political lean MEDSL · Clinton
- 2024 margin
- Toss-up / Even · D 48.9% · R 51.1%
- 2008→2024 swing
- -25.1pp toward R · 2008: 22.9pp · 2024: -2.2pp
- All cycles
- 2024: R+2.2 2020: D+5.2 2016: D+0.9 2012: D+25.6 2008: D+22.9
Not yet ingested
- Civics
- —
Market trends
- HPI YoY
- ▲ 11.23%
- Current HPI
- 260.0932
- Rent YoY
- —
- Metro
- —
- State GDP YoY
- ▲ 2.60%
- F500 in state
- 92
Industry mix (Fortune 500 HQ in NY)
| Industry | F500 HQs | Revenue |
|---|---|---|
| Financial Services | 10 | $950B |
|
||
| Consumer Goods | 9 | $162B |
|
||
| Insurance | 4 | $225B |
|
||
| Telecommunications | 2 | $144B |
|
||
| Pharmaceuticals | 2 | $112B |
|
||
| Media / Entertainment | 2 | $69B |
|
||
Price history
-7.6% since first listed3 events — show timeline
- 2026-05-19 Price Changed $64,200 ACVMLS
- 2026-04-27 Listed $69,500 ACVMLS
- 2025-06-12 Price Changed $69,500 ACVMLS
Property tax history
+31.4%/yrLatest (2025): $1,656 · +32.9% YoY. Source: county tax records.
Cash-flow waterfall
monthlySold comps — $/sqft
last 12 mo · ≤1 miLoading sold comps…