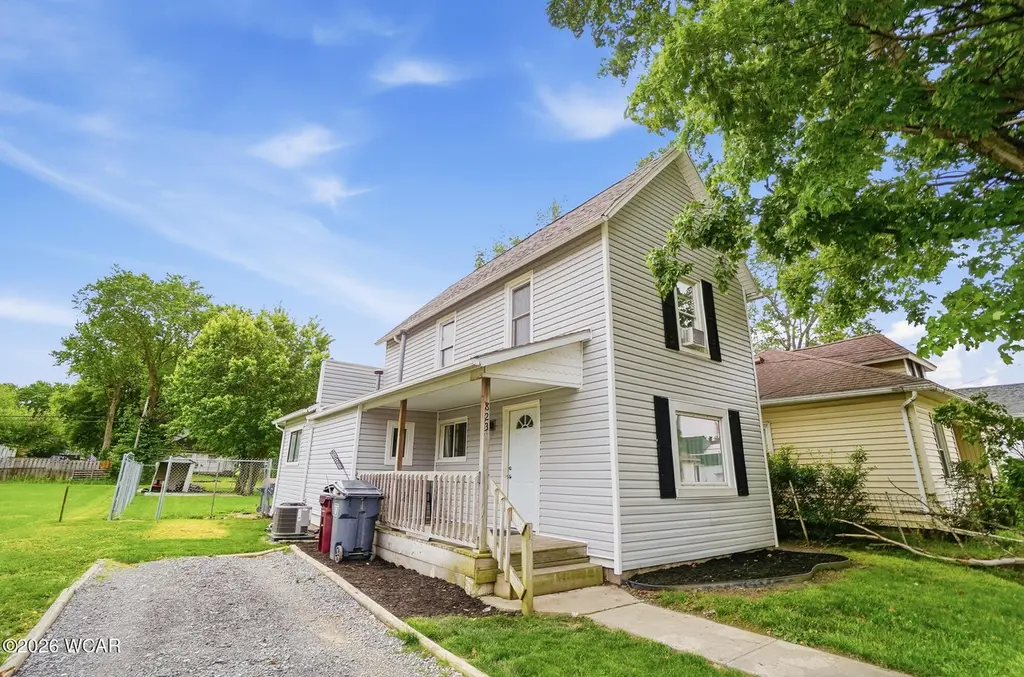
823 Holly St · Lima, OH
Flood risk 1/10 · Minimal
- FEMA flood zone
- X (unshaded)
- Chance of flooding over 30 yrs
- 0.0%
- Est. flood insurance / yr
- $507 – $1,088
Fire risk 1/10 · Minimal
- Est. fire insurance / yr
- $713 – $1,323
Heat risk 3/10 · Minor
- Hot days now (above 99°F)
- 7 days/yr
- Hot days in 30 yrs
- 18 days/yr
Wind risk 2/10 · Minimal
- Chance of severe wind over 30 yrs
- —
Air-quality risk 2/10 · Minimal
- Unhealthy air days now
- 1 days/yr
- Unhealthy air days in 30 yrs
- 2 days/yr
Risk factors via First Street. Map © Google.
Why this score? — see what drove the D grade
The composite is a weighted blend of 9 inputs, each scored 0–100. Each bar is that input's sub-score; the figure is the points it added to the 100-point composite (weight × sub-score).
- Cash flow +16.2/30.0
- ARV discount +7.5/15.0
- DSCR +5.0/10.0
- Livability +3.2/5.0
- 1% rule +3.1/10.0
- Schools +2.6/10.0
- Rent growth +2.5/5.0
- Condition / age +2.5/5.0
- Appreciation +0.0/10.0
$129,900
🖨 Deal sheet 📄 Offer letter ✓ Due diligence
Listing remarks MLS
This adorable 2 story home has been totally remodeled. You will love this open concept home close to the refinery. Updates include: Roof, Siding, Windows, Kitchen, Bathroom, Flooring, Lights. Beautiful walk in tiled shower with 4 shower heads. Set up your showing today. ,Under 1 Acre
Key facts
- Open concept living
- Plenty of storage
- Large covered porch
Tags
Property features AI
Finance
- Other: Residential zoning
Exterior
- Parking: 2 parking spaces
- Utilities: Public water; Public sewer; Cable available and connected; Electricity connected; Natural gas connected; Water connected
- Home design: Single-family residence; Two levels; Updated/remodeled condition
- Construction: Vinyl siding
- Exterior features: Covered porch; Fenced yard
Interior
- Kitchen: Includes dishwasher and refrigerator
- Bedrooms: Total of 5 rooms (includes bedrooms and living spaces)
- Bathrooms: 1 full bathroom
- Heating & cooling: Central air conditioning; Forced air heating; Natural gas heating
- Interior features: Updated/remodeled interior; Dishwasher; Refrigerator; Gas water heater
- Laundry & utility: Gas water heater
Neighborhood map
What this means for you Summary
Snapshot
- This is a 2-bed/1.0-bath single-family listed at $130k.
Deal economics
- At list price, monthly cash flow is $68 ($814/yr) — positive.
- The deal already cash-flows at list — no discount required.
- To meet the 1% rule (rent ≥ 1% of price), the offer needs to be $106k (18.5% below list).
- Recommended offer: $106k (18.5% below list) — sets the bar for 1% rule.
Location & tenants
- Location reads 64/100 on livability (#787 in OH) — a middle-class / working-renter tenant base. Strengths: cost of living A+, housing A+, health & safety A-; Watch: crime F, amenities F, commute F.
- Lima City (urban): math 29% / reading 36% proficiency, ranked #575 of 656 in OH (top 88%) — families likely to look elsewhere, expect single-tenant / working-renter base with shorter leases; 83% free/reduced lunch — lower-income household profile, screen leases tightly.
- Market conditions: 79 active listings in the ZIP; 10 comparable units currently listed for rent nearby; rentals lingering (median 44d on market — plan ~5-8 weeks vacancy on turnover, expect pricing pressure); 100% of comp listings sitting > 30 days — soft ceiling on asking rent; lower-income renter base — watch delinquency; 88 units permitted in Allen County in 2024 (0 in 5+ unit buildings).
Forward outlook
- Local home prices are declining (-3.0%/yr); year-one equity from $898 of loan paydown is wiped out by about $4k of value loss. Plan a longer hold.
- Allen County population projected at -14% by 2050 — secular population decline; favor cash flow + early exit over multi-decade hold.
Negotiation context
- Only 9 days on market — expect competitive offers; lowballing is unlikely to land.
- 3 sale attempts since 6y ago with the ask held roughly flat each time — persistent listings suggest the price (not the market) is what's stuck; bring a comps-based counter.
- Current owner paid $110k; 18% above their basis — modest negotiation headroom, anchor on the comps not their cost.
Risks & watch-outs
- Watch-outs: built in 1920 — expect roof / HVAC / electrical / plumbing capex.
Questions for the listing agent
- Built in 1920 — when were the roof, HVAC, electrical panel, plumbing, and water heater last replaced?
- Is there a deadline driving the sale (1031 exchange, divorce, estate, relocation)? That informs how much negotiation room exists.
- Crime grade is F in this area — have there been break-ins, vandalism, or insurance claims at this property in the last 3 years? What carrier currently insures it and at what premium?
- The area grade is low — what's the realistic commute time and amenity access for the typical tenant pool here? Any planned neighborhood developments (good or bad) we should know about?
- What's the average days-on-market for RENTAL listings here right now (not sales)? A rising rental-DOM trend means longer vacancies and softer asking-rent achievability than the comps imply.
- What's the recent tenant-quality profile in this submarket — average credit score on applications, eviction rate, late-payment / NSF rate, and stable-employment percentage? A property-management company in the area should have these aggregated.
- How much new for-sale + rental construction is in the pipeline within 1–3 miles? Heavy new supply typically softens prices + rents 12–24 months out; constrained supply supports both.
Investment metrics
- 1% rule
- 0.81% ✗
- Cap rate
- 6.92%
- Cash-on-cash
- 2.24%
- DSCR
- 1.10
- GRM
- 10.2
CMA / ARV
- ARV (on-the-fly)
- $63,568
- Comps found
- 10
Show comp detail 10 sales within ~0.75 mi
| Address | Dist | Beds/Ba | Sqft | Sold | Price | $/sf | Match |
|---|---|---|---|---|---|---|---|
| 702 W Vine St | 0.03mi | 2/1.0 | 1,128 (+3%) | 8mo | $65,295 | $58 | 87 |
| 785 Holly St | 0.08mi | 3/1.0 (+1) | 1,191 (+9%) | 5mo | $30,000 | $25 | 73 |
| 418 W Vine St | 0.17mi | 3/1.0 (+1) | 1,205 (+10%) | 2mo | $99,000 | $82 | 69 |
| 726 W Kibby St | 0.27mi | 2/1.0 | 1,124 (+3%) | 19mo | $21,000 | $19 | 67 |
| 735 Holly St | 0.17mi | 2/1.0 | 1,016 (-7%) | 19mo | $37,500 | $37 | 64 |
| 802 Holly St | 0.05mi | 3/1.0 (+1) | 949 (-13%) | 19mo | $41,500 | $44 | 54 |
| 929 S Atlantic Ave | 0.17mi | 3/1.0 (+1) | 960 (-12%) | 18mo | $64,900 | $68 | 51 |
| 807 S Union St | 0.59mi | 2/1.0 | 1,006 (-8%) | 10mo | $24,500 | $24 | 50 |
| 567 S Pierce St | 0.40mi | 3/1.0 (+1) | 1,238 (+13%) | 20mo | $80,000 | $65 | 38 |
| 1007 Faurot Ave | 0.67mi | 3/1.0 (+1) | 1,248 (+14%) | 14mo | $116,500 | $93 | 29 |
Match score weights: distance 35% · size 25% · config 20% · recency 20%. Top-matched comps best support the ARV.
Projected returns pro-forma
-3.0% appreciation · 3.0% rent growth · sell at horizon
- IRR
- -12.8%
- Equity multiple
- 0.54×
- Total profit
- $-16,795
- Equity at exit
- $19,369
- IRR
- -3.9%
- Equity multiple
- 0.74×
- Total profit
- $-9,323
- Equity at exit
- $11,231
Cash invested: $36,372 (down + closing). Projections, not guarantees.
Landlord ↔ Tenant lean methodology
- Overall (STATE)
- 73 Landlord-Friendly
- State Ohio
- 73 Landlord-Friendly · R+6
- County
- — inherits STATE
- City
- — inherits STATE
ZIP-level market 45804
- Active inventory
- 79
- Price-to-rent
- 10.2×
Monthly cashflow live
- Estimated rent
- $1,058 high interval (Pro) →
- Mortgage (P&I)
- −$681
- Tax from tax record
- −$33 /mo · $393/yr
- Insurance
- −$54
- HOA
- −$0
- Vacancy / Maint / Mgmt
- −$222
- Net cashflow
- $68
Break-even live
UW: 25.0% down · 7.5% · 30yr · 1.5% tax · 5.0% vac · 8.0% maint · 8.0% mgmt
Financing live
Cash to close
- Down payment
- $32,475
- Closing costs
- $3,897
- Reserves months
- —
- Total cash needed
- —
Loan-product check · same deal, 3 products live
Conventional
25% down · 7.5% · 30yr
- Down + closing
- —
- Monthly P&I
- —
- Monthly cashflow
- —
- DSCR
- —
- Eligible?
- —
Personal DTI + credit; lowest rate.
DSCR
20% down · 8.5% · 30yr
- Down + closing
- —
- Monthly P&I
- —
- Monthly cashflow
- —
- DSCR
- —
- Eligible?
- —
No personal income docs; deal must DSCR.
Hard money
10% down · 12.0% · 12mo
- Down + closing
- —
- Monthly P&I
- —
- Monthly cashflow
- —
- DSCR
- —
- Eligible?
- —
Short-term bridge; refi at stabilization.
Rent comps 10 comps
| Address | Beds | Baths | Sqft | Rent | $/sqft | DOM | Units | Dist |
|---|---|---|---|---|---|---|---|---|
| 545 W Market St Unit 340 1/2 Mcpheron Lima, OH | 2.0 | 1.0 | 900 | $800 | $0.89 | 43d | 1 | 0.88mi |
| 521 Hope St Lima, OH | 3.0 | 2.0 | 1079 | $975 | $0.90 | 43d | 1 | 1.01mi |
| 43 Town Sq Lima, OH | 2.0–3.0 | 1.0–2.0 | 1100 | $956 | $0.87 | 43d | 9 | 1.01mi |
| 1014 W Market St Apt 3 Lima, OH | 2.0 | 1.0 | 800 | $1,400 | $1.75 | 43d | 1 | 1.09mi |
| 623 Hope St Lima, OH | 3.0 | 2.0 | 1079 | $975 | $0.90 | 43d | 1 | 1.12mi |
| 616 Hope St Lima, OH | 3.0 | 2.0 | 1079 | $975 | $0.90 | 43d | 1 | 1.12mi |
| 420 N Baxter St Lima, OH | 3.0 | 2.0 | 1386 | $1,200 | $0.87 | 43d | 1 | 1.22mi |
| 138 Harrison Ave Lima, OH | 3.0 | 1.0 | 1152 | $975 | $0.85 | 43d | 1 | 1.29mi |
| 1436 W High St Lima, OH | 2.0 | 1.0 | 1205 | $895 | $0.74 | 43d | 1 | 1.39mi |
| 405 N Kenilworth Ave Lima, OH | 3.0 | 1.0 | 1352 | $1,795 | $1.33 | 43d | 1 | 1.44mi |
Listing history 8 events
-
2026-06-19days on market $129,900 Active 9 DOM
-
2026-06-18days on market $129,900 Active 8 DOM
-
2026-06-17days on market $129,900 Active 7 DOM
-
2026-06-16days on market $129,900 Active 6 DOM
-
2026-06-15days on market $129,900 Active 5 DOM
-
2026-06-14days on market $129,900 Active 3 DOM
-
2026-06-12remarks 482-char remark
-
2026-06-12$129,900 Active 2 DOM
ⓘ Source: listings_history table (triggers on properties + properties_extension) + one-shot
backfill from property_details.listing_events for pre-trigger history.
Tax reassessment forecast OH · Partial reset (capped growth)
- Current annual tax
- $393 · $33/mo
- Projected year-2 tax
- $1,210 · $101/mo
- Expected delta
- +$817/yr (+$68/mo · 207.9%)
ⓘ Screening estimate from a state-policy table — verify with the county assessor before closing.
Climate risk First Street
- Flood 1/10 Low FEMA zone X (unshaded) · 0% chance over 30 yrs
- Wildfire 1/10 Low
- Heat 3/10 Moderate 7 d/yr ≥99°F today · 18 d/yr by 30 yrs out
- Wind 2/10 Low
- Air quality 2/10 Low 1 unhealthy d/yr today · 2 by 30 yrs out
Nearby sold comps map
Loading sold comps map…
Walkable amenities ~0.75 mi
Loading nearby amenities…
Taxation est. · year 1
- Rental income
- $12,697
- − Mortgage interest
- −$7,276
- − Property taxes
- −$393
- − Insurance
- −$650
- − Repairs & maintenance
- −$1,016
- − Management
- −$1,016
- − Depreciation
- −$3,779
- Taxable loss
- −$1,432
- Est. tax savings @ 24.0%
- +$344
- After-tax cash flow
- $1,157/yr
For passive investors: Depreciation is non-cash, so a rental often shows a tax loss while cash-flowing — sheltering income. Rental losses are passive: they offset passive income freely, and up to $25,000/yr can offset ordinary (W-2) income if you actively participate and your MAGI is under $100k (phasing out to $0 by $150k); unused losses carry forward. On sale, claimed depreciation is recaptured at up to 25%, and gains may owe capital-gains tax (a 1031 exchange can defer both). Figures are a year-1 estimate at your 24.0% rate — not tax advice; consult a CPA.
Schools (NCES district)
- District
- Lima City
- NCES district ID
- 3904422
- Math proficiency
- 29% ▼ -13.00%
- Reading proficiency
- 36% ▼ -6.00%
- Median HH income
- $29,685
- Composite
- 26.31/100
- National rank
- #7243
- State rank
- #575 of 656 in OH
Livability — Lima
- Score
- 64/100
- State rank
- #787
- US rank
- #14288
Category grades
Schools grade is shown separately in the Schools card above.
Census & demographics
- Census place
- Lima, OH
- County
- Allen · 98,169 people
- City population
- 21,739
- Metro
- Lima, OH
- Population (ZIP)
- 14,197
- Household income
- $42,594
- Rent vs Own
- Severe rent burden
- 8.1
Population outlook (Allen County) Hauer SSP2
- Today (2025)
- 100,321 people
- By 2030
- 97,693 · -2.6%
- By 2040
- 91,802 · -8.5%
- By 2050
- 86,152 · -14.1%
- By 2075
- 73,659 · -26.6%
- By 2100
- 58,716 · -41.5%
Race, ethnicity, and origin ACS 2023
- Neighborhood character
- Predominantly White (71%)
- Race & ethnicity
- White 71% Black 19% Two or more races 8% Hispanic / Latino 2%
- Common ancestry
- Italian 1% Slovak 1% Lithuanian 1%
- Foreign-born
- 1% · Canada
- Languages at home
- 99% English-only · Spanish 1%
Political lean MEDSL · Allen
- 2024 margin
- Solid R (+44.1) · D 27.5% · R 71.6%
- 2008→2024 swing
- -23.4pp toward R · 2008: -20.7pp · 2024: -44.1pp
- All cycles
- 2024: R+44.1 2020: R+39.5 2016: R+38.2 2012: R+25.7 2008: R+20.7
Not yet ingested
- Civics
- —
Market trends
- HPI YoY
- ▼ -124.39%
- Current HPI
- 126.4189
- Rent YoY
- —
- Metro
- —
- State GDP YoY
- ▲ 1.98%
- F500 in state
- 48
Industry mix (Fortune 500 HQ in OH)
| Industry | F500 HQs | Revenue |
|---|---|---|
| Insurance | 3 | $145B |
|
||
| Industrial Machinery | 3 | $49B |
|
||
| Financial Services | 3 | $24B |
|
||
| Consumer Goods | 2 | $93B |
|
||
| Aerospace / Defense | 2 | $47B |
|
||
| Utilities | 2 | $33B |
|
||
Price history
+1523.8% since first listed7 events — show timeline
- 2026-06-10 Listed $129,900 WCARE
- 2022-06-16 Sold (Public Records) $110,000 Public Records
- 2022-06-16 Sold (MLS) $110,000 WCARE
- 2022-05-02 Listed $100,000 WCARE
- 2020-09-25 Sold (MLS) $9,000 WCARE
- 2020-08-18 Listed $10,900 WCARE
- 1996-05-22 Sold (Public Records) $8,000 Public Records
Property tax history
-2.6%/yrLatest (2025): $393 · +0.4% YoY. Source: county tax records.
Cash-flow waterfall
monthlySold comps — $/sqft
last 12 mo · ≤1 miLoading sold comps…