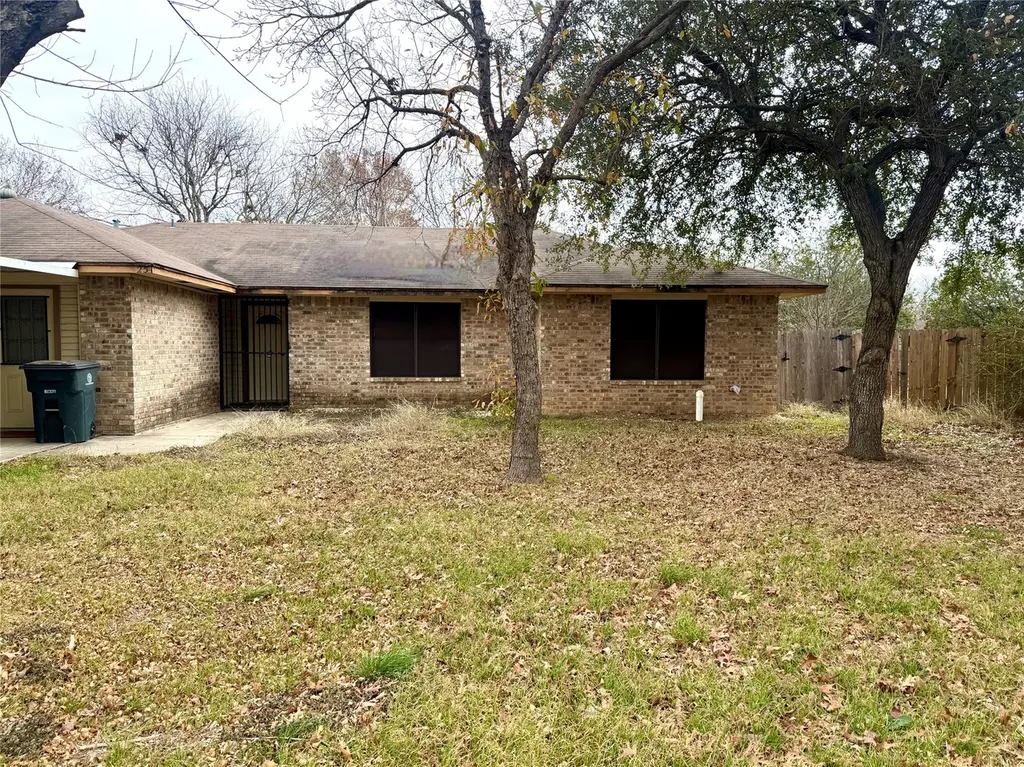
25 Salado Dr · New Braunfels, TX
Flood risk 1/10 · Minimal
- FEMA flood zone
- X (unshaded)
- Chance of flooding over 30 yrs
- 0.0%
- Est. flood insurance / yr
- $507 – $1,088
Fire risk 4/10 · Minor
- Est. fire insurance / yr
- $1,222 – $2,270
Heat risk 8/10 · Major
- Hot days now (above 108°F)
- 7 days/yr
- Hot days in 30 yrs
- 22 days/yr
Wind risk 8/10 · Major
- Chance of severe wind over 30 yrs
- 80.0%
Air-quality risk 1/10 · Minimal
- Unhealthy air days now
- 0 days/yr
- Unhealthy air days in 30 yrs
- 0 days/yr
Risk factors via First Street. Map © Google.
Why this score? — see what drove the D grade
The composite is a weighted blend of 9 inputs, each scored 0–100. Each bar is that input's sub-score; the figure is the points it added to the 100-point composite (weight × sub-score).
- ARV discount +15.0/15.0
- Cash flow +8.2/30.0
- Schools +5.2/10.0
- Livability +4.2/5.0
- 1% rule +3.2/10.0
- Condition / age +2.5/5.0
- DSCR +2.2/10.0
- Rent growth +2.0/5.0
- Appreciation +0.0/10.0
$199,000
🖨 Deal sheet (PDF) 📄 Offer letter ✓ Due diligence
Listing remarks MLS
This is an estate sale so no sellers disclosure is available. It will be sold as is and has been priced to reflect that a buyer will have some items to repair. A solid, spacious 3/2 on a large cul de sac lot. Quiet, older established neighborhood convenient to downtown and I35. The garage was converted some time ago to an additional flex space/family room.
Key facts
- Flex space
- Family room
- Cul de sac lot
Tags
Neighborhood map
What this means for you Summary
Snapshot
- This is a 3-bed/2.0-bath single-family listed at $199k.
Deal economics
- At list price, monthly cash flow is $-185 ($-2k/yr) — negative.
- To cash-flow at today's rent, offer at most $166k (16.5% below list).
- To meet the 1% rule (rent ≥ 1% of price), the offer needs to be $162k (18.5% below list).
- Recommended offer: $162k (18.5% below list) — sets the bar for 1% rule.
- Cap rate 5.2% vs local median 3.3% in New Braunfels — top-decile yield for the area; either an underpriced asset or a hidden risk that comps aren't pricing in. Stress-test before assuming the spread holds.
Location & tenants
- Location reads 83/100 on livability (#9 in TX, #925 nationally) — a professional / high-income tenant draw. Strengths: amenities A+, housing A+, health & safety A+; Watch: commute F.
- Comal ISD (rural): math 57% / reading 59% proficiency, ranked #58 of 826 in TX (top 7%) — acceptable for families but not a draw, mixed tenant base, ~2y average lease.
- Zoned schools: Freiheit El (math 37% / reading 43%, grade F, #1,514 of 4,322 statewide, top 36%, 910 students, 55% FRL); Canyon Middle (math 48% / reading 44%, grade D+, #462 of 1,662 statewide, top 28%, 1,175 students, 47% FRL); Canyon H S (math 59% / reading 65%, grade B-, #237 of 1,632 statewide, top 16%, 2,348 students, 35% FRL).
- Market conditions: Rents soft (-2.0%/yr); 1931 active listings in the ZIP; 40 comparable units currently listed for rent nearby; rentals at typical pace (median 26d on market — plan ~3-4 weeks tenant-placement turnaround); solid renter incomes; 3,420 units permitted in Comal County in 2024 (1,164 in 5+ unit buildings).
Forward outlook
- Local home prices are declining (-3.0%/yr); year-one equity from $1k of loan paydown is wiped out by about $6k of value loss. Plan a longer hold.
- Comal County population projected at +70% by 2050 — long-run rental-demand tailwind backs the buy-and-hold thesis.
Negotiation context
- It's been on market 89 days — a 6% lower offer ($187k) is reasonable based on typical stale-listing flexibility.
Risks & watch-outs
- Climate carrying-cost: severe wind risk, 80% chance of damaging wind over 30y; extreme-heat days projected 7→22/yr by 2055 (HVAC capex compounding) — expect insurance premiums to compound above CPI over the hold.
Questions for the listing agent
- What do current leases actually rent for vs. the listed asking? Can we see a recent rent roll and the last 12 months of T-12 income?
- It's been on market 89 days. Have you received any prior offers? Is the seller open to a 18% concession, seller financing, or rate buy-down credit?
- Why hasn't it sold? Are there any deal-killer items the seller is aware of (foundation, flood, title, zoning, code violations)?
- Is there a deadline driving the sale (1031 exchange, divorce, estate, relocation)? That informs how much negotiation room exists.
- Schools are B-rated — typically a magnet for longer-tenancy family renters. What's the average tenant stay here, and is there a school-zone premium baked into asking?
- The area grade is low — what's the realistic commute time and amenity access for the typical tenant pool here? Any planned neighborhood developments (good or bad) we should know about?
- What's the average days-on-market for RENTAL listings here right now (not sales)? A rising rental-DOM trend means longer vacancies and softer asking-rent achievability than the comps imply.
- What's the recent tenant-quality profile in this submarket — average credit score on applications, eviction rate, late-payment / NSF rate, and stable-employment percentage? A property-management company in the area should have these aggregated.
- How much new for-sale + rental construction is in the pipeline within 1–3 miles? Heavy new supply typically softens prices + rents 12–24 months out; constrained supply supports both.
Investment metrics
- 1% rule
- 0.82% ✗
- Cap rate
- 5.17%
- Cash-on-cash
- -3.99%
- DSCR
- 0.82
- GRM
- 10.2
CMA / ARV
- ARV (median comp)
- $275,363
- List price
- $199,000
- Delta
- -27.73%
- Verdict
- UNDERPRICED
- Comps
- 20 within 1.0 mi
Show comp detail 12 sales within ~0.75 mi
| Address | Dist | Beds/Ba | Sqft | Sold | Price | $/sf | Match |
|---|---|---|---|---|---|---|---|
| 496 Magnolia Wind | 0.30mi | 3/2.0 | 1,267 (+2%) | 2mo | $220,000 | $174 | 81 |
| 535 Wind Murmur | 0.43mi | 3/2.0 | 1,272 (+2%) | 2mo | $227,900 | $179 | 75 |
| 30 Dakota Cir | 0.02mi | 4/3.0 (+1) | 1,149 (-8%) | 2mo | $229,000 | $199 | 75 |
| 528 Magnolia Wind | 0.37mi | 3/2.0 | 1,272 (+2%) | 7mo | $244,500 | $192 | 74 |
| 478 Melody Wind | 0.31mi | 2/2.0 (-1) | 1,254 (+1%) | 13mo | $245,000 | $195 | 69 |
| 1220 Thea Cv | 0.74mi | 3/2.0 | 1,248 (+0%) | 2mo | $233,900 | $187 | 64 |
| 805 Day Break Dr | 0.74mi | 3/2.0 | 1,213 (-3%) | 10mo | $235,999 | $195 | 52 |
| 3638 Wentz Hill Dr | 0.74mi | 3/2.0 | 1,213 (-3%) | 12mo | $227,588 | $188 | 51 |
| 3640 Moon Hill Rd | 0.74mi | 3/2.0 | 1,213 (-3%) | 13mo | $217,999 | $180 | 50 |
| 3606 Wentz Hill Dr | 0.74mi | 3/2.0 | 1,380 (+11%) | 10mo | $216,999 | $157 | 39 |
| 3634 Wentz Hill Dr | 0.74mi | 3/2.0 | 1,380 (+11%) | 11mo | $179,099 | $130 | 38 |
| 3613 Wentz Hill Dr | 0.74mi | 3/2.0 | 1,380 (+11%) | 12mo | $182,446 | $132 | 37 |
Match score weights: distance 35% · size 25% · config 20% · recency 20%. Top-matched comps best support the ARV.
Projected returns pro-forma
-3.0% appreciation · 0.0% rent growth · sell at horizon
- IRR
- -26.6%
- Equity multiple
- 0.13×
- Total profit
- $-48,729
- Equity at exit
- $29,672
- IRR
- -40.3%
- Equity multiple
- -0.36×
- Total profit
- $-75,687
- Equity at exit
- $17,206
Cash invested: $55,720 (down + closing). Projections, not guarantees.
Landlord ↔ Tenant lean methodology
- Overall (STATE)
- 87 Strongly Landlord-Friendly
- State Texas
- 87 Strongly Landlord-Friendly · R+5
- County
- — inherits STATE
- City
- — inherits STATE
ZIP-level market 78130
- Rents YoY
- -2.0%
- Active inventory
- 1931
- Price-to-rent
- 10.2×
Monthly cashflow live
- Estimated rent
- $1,623 high interval (Pro) →
- Mortgage (P&I)
- −$1,044
- Tax from tax record
- −$341 /mo · $4,091/yr
- Insurance
- −$83
- HOA
- −$0
- Vacancy / Maint / Mgmt
- −$341
- Net cashflow
- $-185
Break-even live
Sensitivity live
| Price | -10% $-73 | -5% $-129 | +0% $-185 | +5% $-242 | +10% $-298 |
|---|---|---|---|---|---|
| Rent | -10% $-314 | -5% $-249 | +0% $-185 | +5% $-121 | +10% $-57 |
| Rate | -1.0pp $-85 | -0.5pp $-135 | base $-185 | +0.5pp $-237 | +1.0pp $-289 |
UW: 25.0% down · 7.5% · 30yr · 1.5% tax · 5.0% vac · 8.0% maint · 8.0% mgmt
Financing live
Cash to close
- Down payment
- $49,750
- Closing costs
- $5,970
- Reserves months
- —
- Total cash needed
- —
Loan-product check · same deal, 3 products live
Conventional
25% down · 7.5% · 30yr
- Down + closing
- —
- Monthly P&I
- —
- Monthly cashflow
- —
- DSCR
- —
- Eligible?
- —
Personal DTI + credit; lowest rate.
DSCR
20% down · 8.5% · 30yr
- Down + closing
- —
- Monthly P&I
- —
- Monthly cashflow
- —
- DSCR
- —
- Eligible?
- —
No personal income docs; deal must DSCR.
Hard money
10% down · 12.0% · 12mo
- Down + closing
- —
- Monthly P&I
- —
- Monthly cashflow
- —
- DSCR
- —
- Eligible?
- —
Short-term bridge; refi at stabilization.
Rent comps 40 comps
| Address | Beds | Baths | Sqft | Rent | $/sqft | DOM | Units | Dist |
|---|---|---|---|---|---|---|---|---|
| 910 Hueco Dr New Braunfels, TX | 3.0 | 2.0 | 1300 | $1,600 | $1.23 | 16d | 1 | 0.15mi |
| 1009 Mellow Breeze New Braunfels, TX | 3.0 | 2.0 | 1445 | $1,800 | $1.25 | 25d | 1 | 0.21mi |
| 1027 Brown Rock Dr Unit 1 New Braunfels, TX | 3.0 | 2.0 | 1252 | $1,495 | $1.19 | 0d | 1 | 0.28mi |
| 1032 Brown Rock Dr New Braunfels, TX | 3.0 | 2.5 | 1409 | $1,395 | $0.99 | 45d | 1 | 0.29mi |
| 1038 Mellow Breeze New Braunfels, TX | 3.0 | 2.0 | 1313 | $1,795 | $1.37 | 12d | 1 | 0.31mi |
| 933 Brown Rock Dr New Braunfels, TX | 3.0 | 2.0 | 1248 | $1,395 | $1.12 | 25d | 1 | 0.35mi |
| 314 Rosalie Dr New Braunfels, TX | 3.0 | 2.5 | 1409 | $1,595 | $1.13 | 25d | 1 | 0.36mi |
| 327 Oelkers Dr Unit B New Braunfels, TX | 3.0 | 2.0 | 1212 | $1,450 | $1.20 | 6d | 1 | 0.37mi |
| 518 Melody Wind New Braunfels, TX | 3.0 | 2.0 | 1272 | $1,725 | $1.36 | 19d | 1 | 0.39mi |
| 229 Anne Louise Dr New Braunfels, TX | 3.0 | 2.0 | 1200 | $1,425 | $1.19 | 18d | 1 | 0.40mi |
| 1358 Bartels Ct New Braunfels, TX | 3.0 | 2.0 | 1344 | $1,445 | $1.08 | 25d | 1 | 0.41mi |
| 228 Anne Louise Dr Unit A New Braunfels, TX | 3.0 | 2.0 | 1200 | $1,495 | $1.25 | 18d | 1 | 0.42mi |
| 213 Anne Louise Dr Unit A New Braunfels, TX | 3.0 | 2.0 | 1212 | $1,379 | $1.14 | 13d | 1 | 0.44mi |
| 216 Anne Louise Dr Unit A New Braunfels, TX | 3.0 | 2.0 | 1212 | $1,450 | $1.20 | 6d | 1 | 0.45mi |
| 378 Stone Pt New Braunfels, TX | 3.0 | 2.0 | 1491 | $1,350 | $0.91 | 25d | 1 | 0.46mi |
| 239 Rosalie Dr Unit B New Braunfels, TX | 2.0 | 2.0 | 994 | $1,295 | $1.30 | 6d | 1 | 0.50mi |
| 248 Rosalie Dr Unit B New Braunfels, TX | 3.0 | 2.0 | 1156 | $1,395 | $1.21 | 45d | 1 | 0.51mi |
| 244 Rosalie Dr New Braunfels, TX | 3.0 | 2.0 | 1200 | $1,455 | $1.21 | 45d | 1 | 0.51mi |
| 236 Rosalie Dr New Braunfels, TX | 2.0 | 2.0 | 994 | $1,325 | $1.33 | 45d | 1 | 0.53mi |
| 250 Topaz New Braunfels, TX | 3.0 | 2.5 | 1400 | $1,550 | $1.11 | 25d | 1 | 0.55mi |
| 1747 FM 1101 New Braunfels, TX | 1.0–3.0 | 1.0–2.0 | 877 | $3,261 | $3.72 | 0d | 25 | 0.59mi |
| 216 Stone Gate Dr New Braunfels, TX | 3.0 | 2.0 | 1226 | $1,595 | $1.30 | 6d | 1 | 0.63mi |
| 729 Thea Cv New Braunfels, TX | 3.0 | 2.0 | 1411 | $1,625 | $1.15 | 16d | 1 | 0.65mi |
| 621 Jennifer Cv New Braunfels, TX | 4.0 | 2.0 | 1396 | $1,745 | $1.25 | 0d | 1 | 0.66mi |
| 1134 Misty Acres Dr New Braunfels, TX | 2.0 | 1.5 | 1092 | $1,250 | $1.14 | 25d | 1 | 0.70mi |
| 414 Creekside Curv New Braunfels, TX | 3.0 | 2.5 | 1377 | $1,600 | $1.16 | 19d | 1 | 0.70mi |
| 1786 Tristan Trl Unit 1786 New Braunfels, TX | 3.0 | 2.5 | 1466 | $1,450 | $0.99 | 25d | 1 | 0.72mi |
| 1137 Gracie Way New Braunfels, TX | 3.0 | 2.0 | 1325 | $1,695 | $1.28 | 25d | 1 | 0.72mi |
| 1084 Carolyn Cv New Braunfels, TX | 3.0 | 2.0 | 1236 | $1,495 | $1.21 | 6d | 1 | 0.74mi |
| 660 Creekside Cir New Braunfels, TX | 3.0 | 2.0 | 1252 | $1,495 | $1.19 | 25d | 1 | 0.74mi |
| 569 Creekside Cir Unit 569 New Braunfels, TX | 3.0 | 2.0 | 1250 | $1,495 | $1.20 | 45d | 1 | 0.74mi |
| 668 Creekside Cir New Braunfels, TX | 2.0 | 2.0 | 980 | $1,195 | $1.22 | 0d | 1 | 0.75mi |
| 565 Creekside Cir New Braunfels, TX | 3.0 | 2.0 | 1250 | $1,595 | $1.28 | 45d | 1 | 0.75mi |
| 561 Creekside Frst New Braunfels, TX | 3.0 | 2.5 | 1430 | $1,650 | $1.15 | 25d | 1 | 0.75mi |
| 561 Creekside Frst New Braunfels, TX | 3.0 | 2.5 | 1430 | $1,650 | $1.15 | 45d | 1 | 0.75mi |
| 570 Creekside Cir New Braunfels, TX | 3.0 | 2.5 | 1373 | $1,595 | $1.16 | 25d | 1 | 0.75mi |
| 1793 Tristan Trl New Braunfels, TX | 3.0 | 2.5 | 1466 | $1,395 | $0.95 | 45d | 1 | 0.76mi |
| 549 Creekside Frst New Braunfels, TX | 3.0 | 2.0 | 1256 | $1,595 | $1.27 | 18d | 1 | 0.77mi |
| 553 Creekside Cir Unit 553 New Braunfels, TX | 3.0 | 2.5 | 1400 | $1,595 | $1.14 | 18d | 1 | 0.77mi |
| 546 Creekside Frst New Braunfels, TX | 3.0 | 2.0 | 1265 | $1,595 | $1.26 | 45d | 1 | 0.78mi |
Listing history 5 events
-
2026-05-11status Pending 358-char remark
Show marketing remark (358 chars)
This is an estate sale so no sellers disclosure is available. It will be sold as is and has been priced to reflect that a buyer will have some items to repair. A solid, spacious 3/2 on a large cul de sac lot. Quiet, older established neighborhood convenient to downtown and I35. The garage was converted some time ago to an additional flex space/family room.
-
2026-03-03price $199,000 358-char remark
Show marketing remark (358 chars)
This is an estate sale so no sellers disclosure is available. It will be sold as is and has been priced to reflect that a buyer will have some items to repair. A solid, spacious 3/2 on a large cul de sac lot. Quiet, older established neighborhood convenient to downtown and I35. The garage was converted some time ago to an additional flex space/family room.
-
2026-02-11$220,000 Active 358-char remark
Show marketing remark (358 chars)
This is an estate sale so no sellers disclosure is available. It will be sold as is and has been priced to reflect that a buyer will have some items to repair. A solid, spacious 3/2 on a large cul de sac lot. Quiet, older established neighborhood convenient to downtown and I35. The garage was converted some time ago to an additional flex space/family room.
-
1997-02-04soldstatus
-
1996-08-22soldstatus
ⓘ Source: listings_history table (triggers on properties + properties_extension) + one-shot
backfill from property_details.listing_events for pre-trigger history.
Tax reassessment forecast TX · Resets to sale price
- Current annual tax
- $4,091 · $341/mo
- Projected year-2 tax
- $4,091 · $341/mo
- Expected delta
- $0/yr ($0/mo · 0.0%)
ⓘ Screening estimate from a state-policy table — verify with the county assessor before closing.
Climate risk First Street
- Flood 1/10 Low FEMA zone X (unshaded) · 0% chance over 30 yrs
- Wildfire 4/10 Moderate
- Heat 8/10 Severe 7 d/yr ≥108°F today · 22 d/yr by 30 yrs out
- Wind 8/10 Severe 80% chance of damaging wind over 30 yrs
- Air quality 1/10 Low 0 unhealthy d/yr today · 0 by 30 yrs out
Nearby sold comps map
Loading sold comps map…
Walkable amenities ~0.75 mi
Loading nearby amenities…
Taxation est. · year 1
- Rental income
- $19,473
- − Mortgage interest
- −$11,147
- − Property taxes
- −$4,091
- − Insurance
- −$995
- − Repairs & maintenance
- −$1,558
- − Management
- −$1,558
- − Depreciation
- −$5,789
- Taxable loss
- −$5,664
- Est. tax savings @ 24.0%
- +$1,359
- After-tax cash flow
- $-865/yr
For passive investors: Depreciation is non-cash, so a rental often shows a tax loss while cash-flowing — sheltering income. Rental losses are passive: they offset passive income freely, and up to $25,000/yr can offset ordinary (W-2) income if you actively participate and your MAGI is under $100k (phasing out to $0 by $150k); unused losses carry forward. On sale, claimed depreciation is recaptured at up to 25%, and gains may owe capital-gains tax (a 1031 exchange can defer both). Figures are a year-1 estimate at your 24.0% rate — not tax advice; consult a CPA.
Schools (NCES district)
- District
- Comal ISD
- NCES district ID
- 4814730
- Math proficiency
- 57% ▼ -9.00%
- Reading proficiency
- 59% ▼ -2.00%
- Median HH income
- $74,792
- Composite
- 51.79/100
- National rank
- #1671
- State rank
- #58 of 826 in TX
Livability — New Braunfels
- Score
- 83/100
- State rank
- #9
- US rank
- #925
Category grades
Schools grade is shown separately in the Schools card above.
Census & demographics
- Census place
- New Braunfels, TX
- County
- Comal County · 206,262 people
- City population
- 144,962
- Metro
- San Antonio-New Braunfels, TX
- Population (ZIP)
- 104,009
- Household income
- $83,064
- Rent vs Own
- Severe rent burden
- 2912.0
Population outlook (Comal County) Hauer SSP2
- Today (2025)
- 175,637 people
- By 2030
- 199,911 · +13.8%
- By 2040
- 249,436 · +42.0%
- By 2050
- 299,430 · +70.5%
- By 2075
- 423,857 · +141.3%
- By 2100
- 512,048 · +191.5%
Race, ethnicity, and origin ACS 2023
- Neighborhood character
- Majority White (58%)
- Race & ethnicity
- White 58% Hispanic / Latino 37% Two or more races 19% Black 2%
- Hispanic origin (detail)
- Mexican 32%
- Common ancestry
- Romanian 2% Lithuanian 2% Slovak 2%
- Foreign-born
- 7% · Canada
- Languages at home
- 78% English-only · Spanish 20% German/W. Germanic 1%
Political lean MEDSL · Comal
- 2024 margin
- Solid R (+45.5) · D 26.8% · R 72.2%
- 2008→2024 swing
- +1.9pp toward D · 2008: -47.4pp · 2024: -45.5pp
- All cycles
- 2024: R+45.5 2020: R+42.7 2016: R+50.1 2012: R+54.1 2008: R+47.4
Not yet ingested
- Civics
- —
Market trends
- HPI YoY
- ▼ -190.61%
- Current HPI
- 173.7128
- Rent YoY
- ▼ -1.97%
- Metro
- San Antonio-New Braunfels, TX
- State GDP YoY
- ▲ 3.95%
- F500 in state
- 110
Industry mix (Fortune 500 HQ in TX)
| Industry | F500 HQs | Revenue |
|---|---|---|
| Energy | 16 | $1,198B |
|
||
| Technology | 5 | $198B |
|
||
| Engineering / Construction | 4 | $72B |
|
||
| Energy Services | 3 | $60B |
|
||
| Utilities | 3 | $41B |
|
||
| Healthcare | 2 | $330B |
|
||
Price history
-9.5% since first listed5 events — show timeline
- 2026-05-11 Pending — Unlock MLS
- 2026-03-03 Price Changed $199,000 Unlock MLS
- 2026-02-11 Listed $220,000 Unlock MLS
- 1997-02-04 Sold (Public Records) — Public Records
- 1996-08-22 Sold (Public Records) — Public Records
Property tax history
+4.1%/yrLatest (2026): $4,091 · -1.4% YoY. Source: county tax records.
Cash-flow waterfall
monthlySold comps — $/sqft
last 12 mo · ≤1 miLoading sold comps…