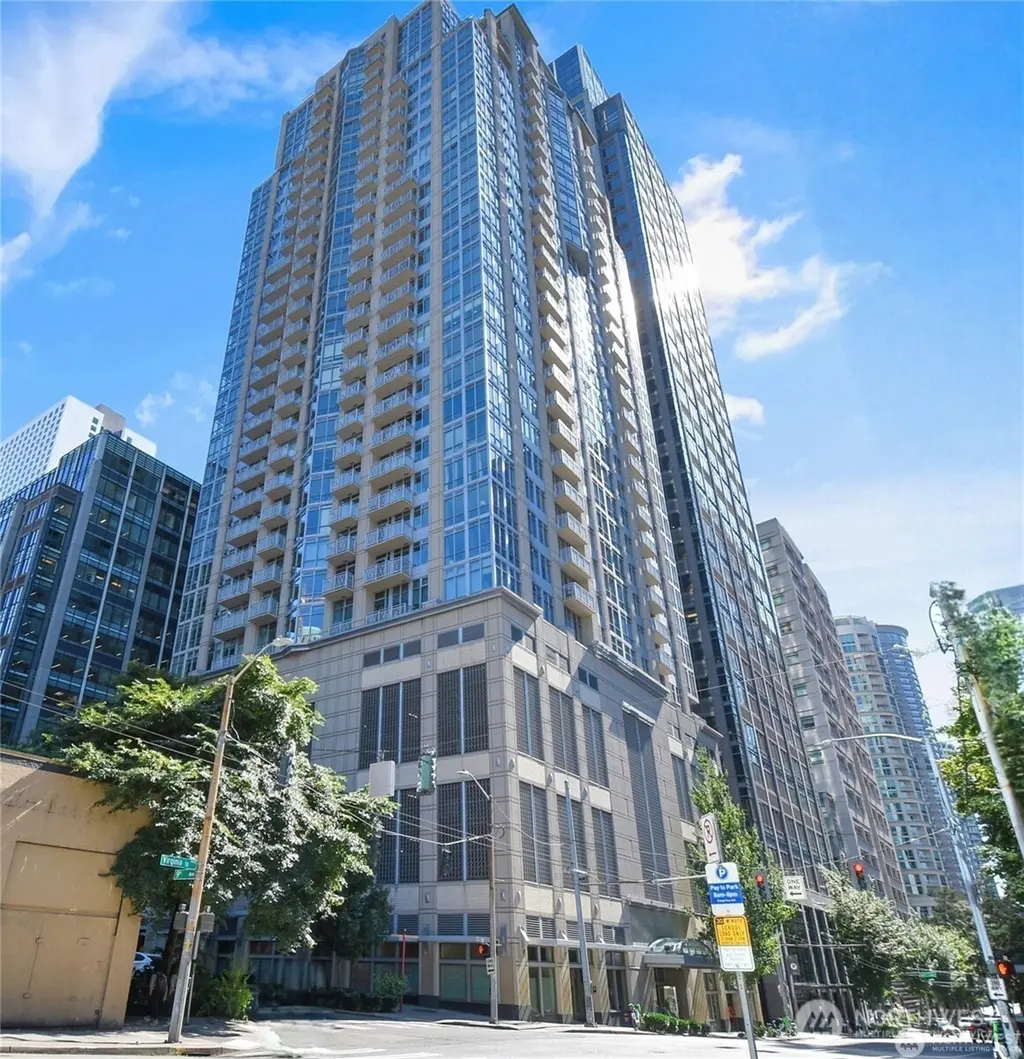
819 Virginia St #1101 · Seattle, WA
Flood risk 1/10 · Minimal
- FEMA flood zone
- X (unshaded)
- Chance of flooding over 30 yrs
- 0.0%
- Est. flood insurance / yr
- $507 – $1,088
Fire risk 1/10 · Minimal
- Est. fire insurance / yr
- $604 – $1,122
Heat risk 3/10 · Minor
- Hot days now (above 86°F)
- 7 days/yr
- Hot days in 30 yrs
- 14 days/yr
Wind risk 1/10 · Minimal
- Chance of severe wind over 30 yrs
- —
Air-quality risk 7/10 · Major
- Unhealthy air days now
- 11 days/yr
- Unhealthy air days in 30 yrs
- 11 days/yr
Risk factors via First Street. Map © Google.
Why this score? — see what drove the D- grade
The composite is a weighted blend of 9 inputs, each scored 0–100. Each bar is that input's sub-score; the figure is the points it added to the 100-point composite (weight × sub-score).
- ARV discount +15.0/15.0
- Schools +6.1/10.0
- Appreciation +4.7/10.0
- Livability +3.8/5.0
- Cash flow +2.6/30.0
- Condition / age +2.5/5.0
- Rent growth +2.4/5.0
- 1% rule +1.8/10.0
- DSCR +0.0/10.0
$469,950
🖨 Deal sheet 📄 Offer letter ✓ Due diligence
Listing remarks
Elevate your lifestyle in this rarely available 1-bedroom plus den floor plan. Spanning nearly 1,000 sq ft, the home flows seamlessly from the sleek hardwood entries to a light-drenched living area. The flexible den provides the "extra room" you’ve been looking for, tucked away from the main living space for maximum privacy. Enjoy breathtaking views of the Seattle skyline from your private balcony or the building’s iconic rooftop terrace overlooking Lake Union. All-inclusive HOA (cable/internet included!) and secure garage parking make this the most convenient luxury move in the city. Walk Score 100 - steps to Amazon, Whole Foods, restaurants, light rail, and all Downt
Key facts
- Rooftop terrace
- Walk score 100
- Private balcony
Tags
Neighborhood map
What this means for you Summary
Snapshot
- This is a 1-bed/1.0-bath condo listed at $470k.
Deal economics
- At list price, monthly cash flow is $-2k ($-19k/yr) — negative.
- To cash-flow at today's rent, offer at most $186k (60.3% below list).
- To meet the 1% rule (rent ≥ 1% of price), the offer needs to be $321k (31.7% below list).
- Recommended offer: $186k (60.3% below list) — sets the bar for cash-flow.
- Cap rate 2.2% vs local median 1.6% in Seattle — top-decile yield for the area; either an underpriced asset or a hidden risk that comps aren't pricing in. Stress-test before assuming the spread holds.
Location & tenants
- Location reads 75/100 on livability (#166 in WA, #4,033 nationally) — a middle-class / working-renter tenant base. Strengths: amenities A+, commute A+, employment A+; Watch: crime F, cost of living F.
- Seattle Public Schools (urban): math 64% / reading 72% proficiency, ranked #19 of 291 in WA (top 6%) — acceptable for families but not a draw, mixed tenant base, ~2y average lease.
- Market conditions: Rents soft (-0.3%/yr); 153 active listings in the ZIP; 40 comparable units currently listed for rent nearby; rentals leasing fast (median 1d on market — plan ~1-2 weeks tenant-placement turnaround); high-income renter base; 10,555 units permitted in King County in 2024 (7,119 in 5+ unit buildings).
Forward outlook
- In year one you build about $798 of equity ($3k loan paydown + $-2k appreciation (-0.5% local appreciation)).
- King County population projected at +44% by 2050 — long-run rental-demand tailwind backs the buy-and-hold thesis.
Negotiation context
- It's been on market 76 days — a 6% lower offer ($442k) is reasonable based on typical stale-listing flexibility.
- 2 sale attempts since 10y ago with the ask held roughly flat each time — persistent listings suggest the price (not the market) is what's stuck; bring a comps-based counter.
Risks & watch-outs
- Watch-outs: HOA is 33% of rent.
Questions for the listing agent
- What do current leases actually rent for vs. the listed asking? Can we see a recent rent roll and the last 12 months of T-12 income?
- It's been on market 76 days. Have you received any prior offers? Is the seller open to a 60% concession, seller financing, or rate buy-down credit?
- What does the HOA fee cover, when was the last increase, and are there any pending special assessments or reserve-fund shortfalls?
- Any open or pending special assessments — roof, HVAC, plumbing, elevator, façade? What's the per-unit balance and payoff schedule, and is the seller paying it off at close or rolling it to the buyer?
- Why hasn't it sold? Are there any deal-killer items the seller is aware of (foundation, flood, title, zoning, code violations)?
- Is there a deadline driving the sale (1031 exchange, divorce, estate, relocation)? That informs how much negotiation room exists.
- Schools are A-rated — typically a magnet for longer-tenancy family renters. What's the average tenant stay here, and is there a school-zone premium baked into asking?
- Crime grade is F in this area — have there been break-ins, vandalism, or insurance claims at this property in the last 3 years? What carrier currently insures it and at what premium?
- The area grade is low — what's the realistic commute time and amenity access for the typical tenant pool here? Any planned neighborhood developments (good or bad) we should know about?
- What's the average days-on-market for RENTAL listings here right now (not sales)? A rising rental-DOM trend means longer vacancies and softer asking-rent achievability than the comps imply.
- What's the recent tenant-quality profile in this submarket — average credit score on applications, eviction rate, late-payment / NSF rate, and stable-employment percentage? A property-management company in the area should have these aggregated.
- How much new apartment / multifamily construction is in the pipeline within 1–3 miles? Heavy new supply (>2% of stock underway) typically softens rents 12–24 months out; light construction supports rent growth.
Investment metrics
- 1% rule
- 0.68% ✗
- Cap rate
- 2.19%
- Cash-on-cash
- -14.64%
- DSCR
- 0.35
- GRM
- 12.2
CMA / ARV
- ARV (median comp)
- $594,677
- List price
- $469,950
- Delta
- -20.97%
- Verdict
- UNDERPRICED
- Comps
- 20 within 1.0 mi
Projected returns pro-forma
-0.52% appreciation · 0.0% rent growth · sell at horizon
- IRR
- -24.1%
- Equity multiple
- -0.03×
- Total profit
- $-136,181
- Equity at exit
- $124,328
- IRR
- -20.4%
- Equity multiple
- -0.79×
- Total profit
- $-235,058
- Equity at exit
- $140,081
Cash invested: $131,586 (down + closing). Projections, not guarantees.
Landlord ↔ Tenant lean methodology
- Overall (CITY)
- 0 Strongly Tenant-Friendly
- State Washington
- 28 Tenant-Leaning · D+8
- County
- — inherits STATE
- City Seattle
- 0 Strongly Tenant-Friendly · D+52
ZIP-level market 98101
- Home prices YoY
- -0.3%
- Rents YoY
- -0.3%
- Active inventory
- 153
- Price-to-rent
- 12.2×
Monthly cashflow live
- Estimated rent
- $3,208 high interval (Pro) →
- Mortgage (P&I)
- −$2,464
- Tax from tax record
- −$429 /mo · $5,153/yr
- Insurance
- −$196
- HOA
- −$1,050
- Vacancy / Maint / Mgmt
- −$674
- Net cashflow
- $-1,605
Break-even live
UW: 25.0% down · 7.5% · 30yr · 1.5% tax · 5.0% vac · 8.0% maint · 8.0% mgmt
Financing live
Cash to close
- Down payment
- $117,488
- Closing costs
- $14,098
- Reserves months
- —
- Total cash needed
- —
Loan-product check · same deal, 3 products live
Conventional
25% down · 7.5% · 30yr
- Down + closing
- —
- Monthly P&I
- —
- Monthly cashflow
- —
- DSCR
- —
- Eligible?
- —
Personal DTI + credit; lowest rate.
DSCR
20% down · 8.5% · 30yr
- Down + closing
- —
- Monthly P&I
- —
- Monthly cashflow
- —
- DSCR
- —
- Eligible?
- —
No personal income docs; deal must DSCR.
Hard money
10% down · 12.0% · 12mo
- Down + closing
- —
- Monthly P&I
- —
- Monthly cashflow
- —
- DSCR
- —
- Eligible?
- —
Short-term bridge; refi at stabilization.
Rent comps 40 comps
| Address | Beds | Baths | Sqft | Rent | $/sqft | DOM | Units | Dist |
|---|---|---|---|---|---|---|---|---|
| 819 Virginia St #2109 Seattle, WA | 1.0 | 1.0 | 719 | $2,250 | $3.13 | 4d | 1 | 0.02mi |
| 819 Virginia St Seattle, WA | 1.0 | 1.0 | 719 | $2,250 | $3.13 | 1d | 1 | 0.02mi |
| 2030 8th Ave Seattle, WA | 2.0 | 1.0–2.0 | 882 | $3,566 | $4.04 | 1d | 16 | 0.08mi |
| 2015 Terry Ave #410 Seattle, WA | 1.0 | 1.0 | 774 | $2,100 | $2.71 | 1d | 1 | 0.09mi |
| 820 Lenora St Seattle, WA | 1.0–2.0 | 1.0–2.0 | 984 | $3,635 | $3.69 | 1d | 21 | 0.10mi |
| 1942 Westlake Ave Seattle, WA | 2.0 | 1.0–2.0 | 872 | $3,495 | $4.01 | 1d | 14 | 0.11mi |
| 2010 Terry Ave Seattle, WA | 2.0 | 1.0–2.5 | 1415 | $10,184 | $7.20 | 1d | 27 | 0.11mi |
| 1823 Terry Ave Seattle, WA | 2.0 | 1.0–2.0 | 893 | $3,028 | $3.39 | 1d | 27 | 0.12mi |
| 900 Lenora St #1004 Seattle, WA | 1.0 | 1.0 | 741 | $2,950 | $3.98 | 1d | 1 | 0.14mi |
| 900 Lenora St Seattle, WA | 1.0 | 1.0 | 856 | $3,200 | $3.74 | 4d | 1 | 0.14mi |
| 2019 Boren Ave Seattle, WA | 3.0 | 1.0–3.0 | 1420 | $7,752 | $5.46 | 1d | 15 | 0.15mi |
| 737 Olive Way Seattle, WA | 1.0 | 1.0 | 690 | $2,850 | $4.13 | 19d | 1 | 0.17mi |
| 2014 Fairview Ave Seattle, WA | 1.0–2.0 | 1.0–2.0 | 742 | $2,862 | $3.85 | 1d | 13 | 0.18mi |
| 809 Olive Way Seattle, WA | 1.0–2.0 | 1.0–2.0 | 1379 | $3,689 | $2.67 | 1d | 12 | 0.19mi |
| 2202 8th Ave Seattle, WA | 2.0 | 1.0–2.0 | 733 | $3,396 | $4.63 | 1d | 25 | 0.19mi |
| 2101 6th Ave Unit 1506175P Seattle, WA | 1.0 | 1.0 | 635 | $6,174 | $9.72 | 1d | 1 | 0.20mi |
| 1800 Boren Ave Seattle, WA | 2.0 | 1.0–2.0 | 912 | $4,426 | $4.85 | 1d | 32 | 0.22mi |
| 111 Terry Ave N Seattle, WA | 2.0 | 1.0–2.0 | 821 | $4,086 | $4.97 | 1d | 30 | 0.22mi |
| 112 Boren Ave N Seattle, WA | 1.0–3.0 | 1.0–3.0 | 1058 | $2,867 | $2.71 | 1d | 54 | 0.22mi |
| 1823 Minor Ave Seattle, WA | 2.0 | 1.0–2.0 | 1083 | $4,518 | $4.17 | 1d | 28 | 0.22mi |
| 2121 6th Ave Seattle, WA | 1.0 | 1.0 | 649 | $3,019 | $4.65 | 1d | 19 | 0.23mi |
| 1601 9th Ave Seattle, WA | 1.0–2.0 | 1.0–2.0 | 839 | $2,285 | $2.72 | 1d | 3 | 0.23mi |
| 120 Westlake Ave N Seattle, WA | 1.0–2.0 | 1.0–2.5 | 1221 | $2,615 | $2.14 | 1d | 17 | 0.25mi |
| 2132 5th Ave #9 Seattle, WA | 1.0 | 1.0 | 680 | $2,050 | $3.01 | 1d | 1 | 0.25mi |
| 1525 9th Ave Seattle, WA | 1.0–2.0 | 1.0–2.5 | 945 | $2,347 | $2.48 | 1d | 24 | 0.26mi |
| 975 John St Seattle, WA | 1.0 | 1.0 | 457 | $2,619 | $5.73 | 1d | 16 | 0.26mi |
| 801 Pine St Seattle, WA | 2.0 | 1.0 | 644 | $2,210 | $3.43 | 1d | 16 | 0.26mi |
| 2105 5th Ave Seattle, WA | 2.0 | 1.0–2.0 | 837 | $3,430 | $4.10 | 1d | 6 | 0.26mi |
| 1920 4th Ave Seattle, WA | 1.0 | 1.5 | 952 | $3,300 | $3.47 | 4d | 1 | 0.26mi |
| 1920 4th Ave Seattle, WA | 1.0–2.0 | 1.0–2.0 | 1432 | $3,850 | $2.69 | 10d | 2 | 0.26mi |
| 1920 4th Ave Seattle, WA | 1.0–2.0 | 1.0–2.0 | 1432 | $3,850 | $2.69 | 24d | 3 | 0.26mi |
| 2014 4th Ave Seattle, WA | 1.0 | 1.0 | 629 | $1,495 | $2.38 | 1d | 1 | 0.26mi |
| 1808 Minor Ave Seattle, WA | 2.0 | 1.0–2.0 | 679 | $2,888 | $4.25 | 43d | 7 | 0.27mi |
| 1808 Minor Ave Seattle, WA | 1.0 | 1.0 | 476 | $2,750 | $5.78 | 1d | 5 | 0.27mi |
| 122 Pontius Ave N Seattle, WA | 1.0 | 1.0 | 500 | $1,473 | $2.95 | 1d | 7 | 0.29mi |
| 2116 4th Ave Seattle, WA | 2.0 | 1.0–2.0 | 1164 | $3,422 | $2.94 | 13d | 19 | 0.29mi |
| 2116 4th Ave Seattle, WA | 2.0 | 1.0–2.0 | 844 | $3,550 | $4.20 | 1d | 23 | 0.29mi |
| 300 Virginia St #2602 Seattle, WA | 1.0 | 1.0 | 669 | $3,400 | $5.08 | 1d | 1 | 0.31mi |
| 300 Virginia St #3012 Seattle, WA | 1.0 | 1.0 | 548 | $3,250 | $5.93 | 1d | 1 | 0.31mi |
| 300 Virginia St Seattle, WA | 2.0 | 2.0 | 940 | $5,100 | $5.43 | 1d | 1 | 0.32mi |
HOA detail condo
- Monthly dues
- $1,050 · $12,600/yr
- Likely covers
- internetcable
- Assessments
- None detected in remarks — confirm with the listing agent.
Listing history 24 events
-
2026-06-19days on market $469,950 Active 76 DOM
-
2026-06-18days on market $469,950 Active 75 DOM
-
2026-06-17days on market $469,950 Active 74 DOM
-
2026-06-16days on market $469,950 Active 73 DOM
-
2026-06-15days on market $469,950 Active 72 DOM
-
2026-06-15days on market $469,950 Active 71 DOM
-
2026-06-13days on market $469,950 Active 70 DOM
-
2026-06-12days on market $469,950 Active 69 DOM
-
2026-06-10days on market $469,950 Active 67 DOM
-
2026-06-09days on market $469,950 Active 66 DOM
-
2026-06-08days on market $469,950 Active 65 DOM
-
2026-06-07days on market $469,950 Active 64 DOM
-
2026-06-07days on market $469,950 Active 63 DOM
-
2026-06-04days on market $469,950 Active 61 DOM
-
2026-06-03days on market $469,950 Active 60 DOM
-
2026-06-02days on market $469,950 Active 59 DOM
-
2026-06-01days on market $469,950 Active 58 DOM
-
2026-05-31days on market $469,950 Active 57 DOM
-
2026-05-15price $469,950
-
2026-04-04$489,950 Active
-
2017-01-03soldstatus $610,000 Sold
-
2017-01-03soldstatus $610,000
-
2016-11-15status Pending
-
2016-11-08$549,000 Active
ⓘ Source: listings_history table (triggers on properties + properties_extension) + one-shot
backfill from property_details.listing_events for pre-trigger history.
Tax reassessment forecast WA · Resets to sale price
- Current annual tax
- $5,153 · $429/mo
- Projected year-2 tax
- $5,153 · $429/mo
- Expected delta
- $0/yr ($0/mo · 0.0%)
ⓘ Screening estimate from a state-policy table — verify with the county assessor before closing.
Climate risk First Street
- Flood 1/10 Low FEMA zone X (unshaded) · 0% chance over 30 yrs
- Wildfire 1/10 Low
- Heat 3/10 Moderate 7 d/yr ≥86°F today · 14 d/yr by 30 yrs out
- Wind 1/10 Low
- Air quality 7/10 Severe 11 unhealthy d/yr today · 11 by 30 yrs out
Nearby sold comps map
Loading sold comps map…
Walkable amenities ~0.75 mi
Loading nearby amenities…
Taxation est. · year 1
- Rental income
- $38,501
- − Mortgage interest
- −$26,325
- − Property taxes
- −$5,153
- − Insurance
- −$2,350
- − Repairs & maintenance
- −$3,080
- − Management
- −$3,080
- − HOA
- −$12,600
- − Depreciation
- −$13,671
- Taxable loss
- −$27,757
- Est. tax savings @ 24.0%
- +$6,662
- After-tax cash flow
- $-12,598/yr
For passive investors: Depreciation is non-cash, so a rental often shows a tax loss while cash-flowing — sheltering income. Rental losses are passive: they offset passive income freely, and up to $25,000/yr can offset ordinary (W-2) income if you actively participate and your MAGI is under $100k (phasing out to $0 by $150k); unused losses carry forward. On sale, claimed depreciation is recaptured at up to 25%, and gains may owe capital-gains tax (a 1031 exchange can defer both). Figures are a year-1 estimate at your 24.0% rate — not tax advice; consult a CPA.
Schools (NCES district)
- District
- Seattle Public Schools
- NCES district ID
- 5307710
- Math proficiency
- 64% ▼ -1.00%
- Reading proficiency
- 72% ▬ 0.00%
- Median HH income
- $68,695
- Composite
- 60.76/100
- National rank
- #1649
- State rank
- #19 of 291 in WA
Livability — Seattle
- Score
- 75/100
- State rank
- #166
- US rank
- #4033
Category grades
Schools grade is shown separately in the Schools card above.
Census & demographics
- Census place
- Seattle, WA
- County
- King County · 2,251,916 people
- City population
- 706,262
- Metro
- Seattle-Tacoma-Bellevue, WA
- Population (ZIP)
- 17,153
- Household income
- $128,882
- Rent vs Own
- Severe rent burden
- 1840.0
Population outlook (King County) Hauer SSP2
- Today (2025)
- 2,576,485 people
- By 2030
- 2,803,316 · +8.8%
- By 2040
- 3,255,921 · +26.4%
- By 2050
- 3,706,444 · +43.9%
- By 2075
- 4,746,063 · +84.2%
- By 2100
- 5,407,730 · +109.9%
Race, ethnicity, and origin ACS 2023
- Neighborhood character
- Diverse neighborhood (Simpson 0.64)
- Race & ethnicity
- White 48% Asian 35% Two or more races 7% Black 6% Hispanic / Latino 5%
- Hispanic origin (detail)
- Mexican 4%
- Common ancestry
- Italian 2% Slovak 2% Lithuanian 1%
- Foreign-born
- 38% · China, Canada, South Korea
- Languages at home
- 67% English-only · Other Indo-European 10% Chinese 8% Spanish 4%
Political lean MEDSL · King
- 2024 margin
- Solid D (+51.7) · D 74.2% · R 22.5% · Other 3.4%
- 2008→2024 swing
- +9.6pp toward D · 2008: 42.1pp · 2024: 51.7pp
- All cycles
- 2024: D+51.7 2020: D+52.7 2016: D+50.4 2012: D+39.9 2008: D+42.1
Not yet ingested
- Civics
- —
Market trends
- HPI YoY
- ▼ -0.52%
- Current HPI
- 193.0062
- Rent YoY
- ▼ -0.28%
- Metro
- Seattle-Tacoma-Bellevue, WA
- State GDP YoY
- ▲ 4.65%
- F500 in state
- 22
Industry mix (Fortune 500 HQ in WA)
| Industry | F500 HQs | Revenue |
|---|---|---|
| Retail | 2 | $269B |
|
||
| Technology / Retail | 1 | $638B |
|
||
| Technology | 1 | $245B |
|
||
| Telecommunications | 1 | $38B |
|
||
| Food / Beverage | 1 | $36B |
|
||
| Automotive / Trucks | 1 | $34B |
|
||
Price history
-14.4% since first listed6 events — show timeline
- 2026-05-15 Price Changed $469,950 NWMLS as Distributed by MLS Grid
- 2026-04-04 Listed $489,950 NWMLS as Distributed by MLS Grid
- 2017-01-03 Sold (Public Records) $610,000 Public Records
- 2017-01-03 Sold (MLS) $610,000 NWMLS as Distributed by MLS Grid
- 2016-11-15 Pending — NWMLS as Distributed by MLS Grid
- 2016-11-08 Listed $549,000 NWMLS as Distributed by MLS Grid
Property tax history
+2.8%/yrLatest (2025): $5,153 · -6.0% YoY. Source: county tax records.
Cash-flow waterfall
monthlySold comps — $/sqft
last 12 mo · ≤1 miLoading sold comps…