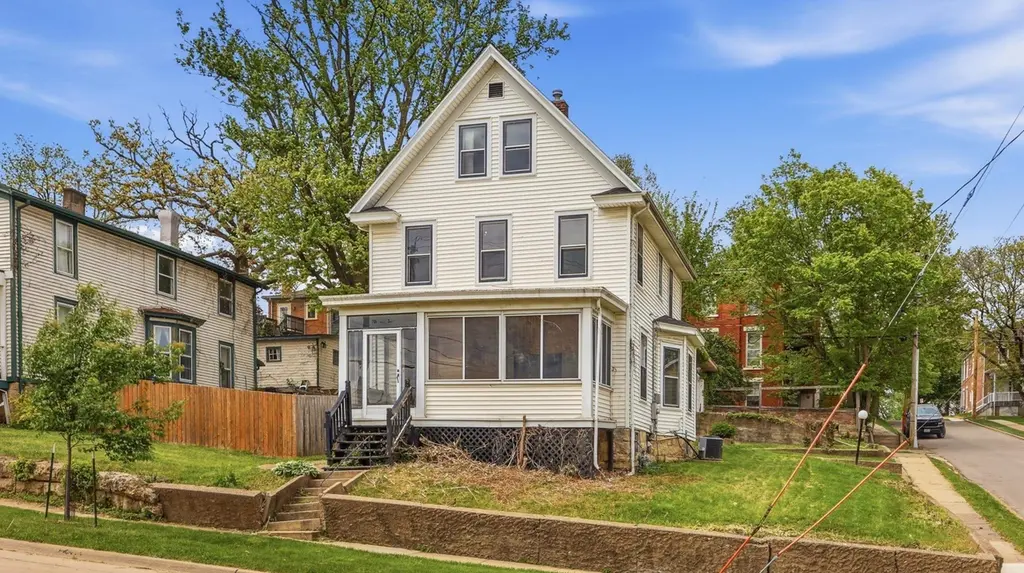
705 W 3rd St · Dubuque, IA
Flood risk 1/10 · Minimal
- FEMA flood zone
- X (unshaded)
- Chance of flooding over 30 yrs
- 0.0%
- Est. flood insurance / yr
- $473 – $860
Fire risk 1/10 · Minimal
- Est. fire insurance / yr
- $902 – $1,676
Heat risk 3/10 · Minor
- Hot days now (above 102°F)
- 7 days/yr
- Hot days in 30 yrs
- 15 days/yr
Wind risk 2/10 · Minimal
- Chance of severe wind over 30 yrs
- —
Air-quality risk 2/10 · Minimal
- Unhealthy air days now
- 1 days/yr
- Unhealthy air days in 30 yrs
- 2 days/yr
Risk factors via First Street. Map © Google.
Why this score? — see what drove the C grade
The composite is a weighted blend of 9 inputs, each scored 0–100. Each bar is that input's sub-score; the figure is the points it added to the 100-point composite (weight × sub-score).
- Cash flow +16.7/30.0
- ARV discount +13.9/15.0
- Schools +5.5/10.0
- DSCR +5.2/10.0
- 1% rule +4.6/10.0
- Livability +4.5/5.0
- Rent growth +3.9/5.0
- Condition / age +2.5/5.0
- Appreciation +0.0/10.0
$159,900
🖨 Deal sheet 📄 Offer letter ✓ Due diligence
Listing remarks MLS
Charming older home! Updated Large home with natural woodwork. 5BR, 2BA ++ 2 car garage. New furnace, large yard, open staircase, wood floors
Key facts
- New stove
- Off street parking
- Dishwasher
Tags
Property features AI
Exterior
- Parking: Detached 2-car parking
- Utilities: Public water; Public sewer
- Home design: Single-family detached residence; Two levels; Residential property (Zoning: R3)
- Construction: Stone foundation
- Exterior features: Shingle roof; Property has a view
Interior
- Kitchen: Refrigerator; Range; Dishwasher
- Bathrooms: One full bathroom; One half bathroom
- Heating & cooling: Central air conditioning; Forced air heating (natural gas)
- Interior features: Window treatments; Full basement
- Laundry & utility: Washer and dryer included; Laundry on lower level
Neighborhood map
What this means for you Summary
Snapshot
- This is a 3-bed/2.0-bath single-family listed at $160k.
Deal economics
- At list price, monthly cash flow is $99 ($1k/yr) — positive.
- The deal already cash-flows at list — no discount required.
- To meet the 1% rule (rent ≥ 1% of price), the offer needs to be $154k (3.6% below list).
- Recommended offer: $154k (3.6% below list) — sets the bar for 1% rule.
- Cap rate 7.0% vs local median 3.5% in Dubuque — top-decile yield for the area; either an underpriced asset or a hidden risk that comps aren't pricing in. Stress-test before assuming the spread holds.
Location & tenants
- Location reads 89/100 on livability (#7 in IA, #119 nationally) — a professional / high-income tenant draw. Strengths: amenities A+, commute A+, cost of living A+; Watch: crime C-.
- Dubuque Community School District (urban): math 63% / reading 65% proficiency, ranked #205 of 289 in IA (top 71%) — acceptable for families but not a draw, mixed tenant base, ~2y average lease.
- Zoned schools: Lincoln Elementary School (math 42% / reading 42%, grade F, #563 of 616 statewide, top 93%, 255 students, 68% FRL); Dubuque Senior High School (math 63% / reading 74%, grade B, #181 of 336 statewide, top 54%, 1,435 students, 36% FRL) — zoned schools average 52% FRL vs 32% district-wide (20 pts higher); higher-poverty schools than district average — tighter screening recommended.
- Market conditions: Rents rising fast (+5.6%/yr); 225 active listings in the ZIP; 6 comparable units currently listed for rent nearby; rentals lingering (median 44d on market — plan ~5-8 weeks vacancy on turnover, expect pricing pressure); 100% of comp listings sitting > 30 days — soft ceiling on asking rent; 473 units permitted in Dubuque County in 2024 (319 in 5+ unit buildings).
- This rent runs 30% of the median local income ($62k/yr) — at the standard rent-burdened threshold; future hikes will face affordability resistance.
Forward outlook
- Local home prices are declining (-3.0%/yr); year-one equity from $1k of loan paydown is wiped out by about $5k of value loss. Plan a longer hold.
- Dubuque County population projected at +13% by 2050 — modest demand growth; plan on rents tracking national, not racing it.
Negotiation context
- It's been on market 43 days — a 3% lower offer ($155k) is reasonable based on typical stale-listing flexibility.
- 2 sale attempts since 12y ago with the ask held roughly flat each time — persistent listings suggest the price (not the market) is what's stuck; bring a comps-based counter.
- Current owner paid $120k; 34% above their basis — modest negotiation headroom, anchor on the comps not their cost.
Risks & watch-outs
- Watch-outs: built in 1914 — expect roof / HVAC / electrical / plumbing capex.
Questions for the listing agent
- It's been on market 43 days. Have you received any prior offers? Is the seller open to a 4% concession, seller financing, or rate buy-down credit?
- Built in 1914 — when were the roof, HVAC, electrical panel, plumbing, and water heater last replaced?
- Is there a deadline driving the sale (1031 exchange, divorce, estate, relocation)? That informs how much negotiation room exists.
- Schools are B-rated — typically a magnet for longer-tenancy family renters. What's the average tenant stay here, and is there a school-zone premium baked into asking?
- What's the average days-on-market for RENTAL listings here right now (not sales)? A rising rental-DOM trend means longer vacancies and softer asking-rent achievability than the comps imply.
- What's the recent tenant-quality profile in this submarket — average credit score on applications, eviction rate, late-payment / NSF rate, and stable-employment percentage? A property-management company in the area should have these aggregated.
- How much new for-sale + rental construction is in the pipeline within 1–3 miles? Heavy new supply typically softens prices + rents 12–24 months out; constrained supply supports both.
Investment metrics
- 1% rule
- 0.96% ✗
- Cap rate
- 7.04%
- Cash-on-cash
- 2.66%
- DSCR
- 1.12
- GRM
- 8.6
CMA / ARV
- ARV (median comp)
- $186,582
- List price
- $159,900
- Delta
- -14.30%
- Verdict
- UNDERPRICED
- Comps
- 20 within 1.0 mi
Show comp detail 12 sales within ~0.75 mi
| Address | Dist | Beds/Ba | Sqft | Sold | Price | $/sf | Match |
|---|---|---|---|---|---|---|---|
| 71 Lois St | 0.40mi | 3/1.5 | 1,556 (+2%) | 2mo | $260,000 | $167 | 73 |
| 945 Spruce St | 0.40mi | 3/1.5 | 1,484 (-2%) | 7mo | $125,000 | $84 | 70 |
| 262 Bradley St | 0.74mi | 3/2.0 | 1,504 (-1%) | 0mo | $216,500 | $144 | 64 |
| 1156 Center Pl | 0.53mi | 3/1.5 | 1,454 (-4%) | 5mo | $176,000 | $121 | 62 |
| 229 N Booth St | 0.53mi | 2/2.0 (-1) | 1,482 (-2%) | 7mo | $249,000 | $168 | 60 |
| 60 S Booth St | 0.61mi | 3/2.0 | 1,612 (+6%) | 4mo | $235,000 | $146 | 58 |
| 392 Glen Oak St | 0.57mi | 2/1.5 (-1) | 1,476 (-3%) | 6mo | $174,000 | $118 | 57 |
| 615 S Grandview Ave | 0.74mi | 3/2.0 | 1,558 (+3%) | 7mo | $210,000 | $135 | 56 |
| 1405 University Ave | 0.74mi | 3/2.0 | 1,364 (-10%) | 1mo | $230,000 | $169 | 48 |
| 408 S Grandview Ave | 0.67mi | 3/1.0 | 1,664 (+10%) | 6mo | $212,500 | $128 | 43 |
| 603 Arlington St | 0.63mi | 3/2.0 | 1,312 (-14%) | 7mo | $140,000 | $107 | 43 |
| 1564 Parkway St | 0.70mi | 3/1.5 | 1,715 (+13%) | 6mo | $267,500 | $156 | 38 |
Match score weights: distance 35% · size 25% · config 20% · recency 20%. Top-matched comps best support the ARV.
Projected returns pro-forma
-3.0% appreciation · 5.63% rent growth · sell at horizon
- IRR
- -9.1%
- Equity multiple
- 0.66×
- Total profit
- $-15,378
- Equity at exit
- $23,842
- IRR
- 3.6%
- Equity multiple
- 1.29×
- Total profit
- $13,000
- Equity at exit
- $13,825
Cash invested: $44,772 (down + closing). Projections, not guarantees.
Landlord ↔ Tenant lean methodology
- Overall (STATE)
- 83 Strongly Landlord-Friendly
- State Iowa
- 83 Strongly Landlord-Friendly · R+6
- County
- — inherits STATE
- City
- — inherits STATE
ZIP-level market 52001
- Rents YoY
- 5.6%
- Active inventory
- 225
- Price-to-rent
- 8.6×
Monthly cashflow live
- Estimated rent
- $1,542 high interval (Pro) →
- Mortgage (P&I)
- −$839
- Tax from tax record
- −$214 /mo · $2,562/yr
- Insurance
- −$67
- HOA
- −$0
- Vacancy / Maint / Mgmt
- −$324
- Net cashflow
- $99
Break-even live
UW: 25.0% down · 7.5% · 30yr · 1.5% tax · 5.0% vac · 8.0% maint · 8.0% mgmt
Financing live
Cash to close
- Down payment
- $39,975
- Closing costs
- $4,797
- Reserves months
- —
- Total cash needed
- —
Loan-product check · same deal, 3 products live
Conventional
25% down · 7.5% · 30yr
- Down + closing
- —
- Monthly P&I
- —
- Monthly cashflow
- —
- DSCR
- —
- Eligible?
- —
Personal DTI + credit; lowest rate.
DSCR
20% down · 8.5% · 30yr
- Down + closing
- —
- Monthly P&I
- —
- Monthly cashflow
- —
- DSCR
- —
- Eligible?
- —
No personal income docs; deal must DSCR.
Hard money
10% down · 12.0% · 12mo
- Down + closing
- —
- Monthly P&I
- —
- Monthly cashflow
- —
- DSCR
- —
- Eligible?
- —
Short-term bridge; refi at stabilization.
Rent comps 6 comps
| Address | Beds | Baths | Sqft | Rent | $/sqft | DOM | Units | Dist |
|---|---|---|---|---|---|---|---|---|
| 500 Hill St Unit 2 Dubuque, IA | 3.0 | 1.0 | 1900 | $1,910 | $1.01 | 43d | 1 | 0.14mi |
| 703 Caledonia Pl Dubuque, IA | 3.0 | 1.0 | 1400 | $1,400 | $1.00 | 43d | 1 | 0.23mi |
| 980 Mount Pleasant St Unit 1 Dubuque, IA | 3.0 | 1.0 | 1236 | $1,150 | $0.93 | 43d | 1 | 0.68mi |
| 333 E 10th St Dubuque, IA | 2.0 | 2.0 | 1530 | $1,750 | $1.14 | 43d | 3 | 0.79mi |
| 1501 Central Ave Unit 1513-1 Dubuque, IA | 3.0 | 1.0 | 1374 | $1,175 | $0.86 | 43d | 1 | 0.87mi |
| 1742 Delhi St Dubuque, IA | 2.0 | 1.5 | 1534 | $1,300 | $0.85 | 43d | 1 | 0.88mi |
Listing history 26 events
-
2026-06-19days on market $159,900 Active 43 DOM
-
2026-06-18days on market $159,900 Active 42 DOM
-
2026-06-17days on market $159,900 Active 41 DOM
-
2026-06-16days on market $159,900 Active 40 DOM
-
2026-06-15days on market $159,900 Active 39 DOM
-
2026-06-14days on market $159,900 Active 37 DOM
-
2026-06-13days on market $159,900 Active 36 DOM
-
2026-06-10days on market $159,900 Active 34 DOM
-
2026-06-09days on market $159,900 Active 33 DOM
-
2026-06-09price $159,900 Active 32 DOM
-
2026-06-08days on market $162,500 Active 32 DOM
-
2026-06-07days on market $162,500 Active 31 DOM
-
2026-06-05days on market $162,500 Active 28 DOM
-
2026-06-03days on market $162,500 Active 27 DOM
-
2026-06-02days on market $162,500 Active 26 DOM
-
2026-06-01days on market $162,500 Active 25 DOM
-
2026-05-31days on market $162,500 Active 24 DOM
-
2026-05-30days on market $162,500 Active 23 DOM
-
2026-05-07$162,500 Active 720-char remark
-
2026-02-23$1,400
-
2026-01-21historical $1,400
-
2025-12-20$1,400
-
2015-03-25soldstatus $119,500
-
2015-03-20soldstatus $119,500 141-char remark
Show marketing remark (141 chars)
Charming older home! Updated Large home with natural woodwork. 5BR, 2BA ++ 2 car garage. New furnace, large yard, open staircase, wood floors
-
2014-12-12$135,000 141-char remark
Show marketing remark (141 chars)
Charming older home! Updated Large home with natural woodwork. 5BR, 2BA ++ 2 car garage. New furnace, large yard, open staircase, wood floors
-
2007-09-07soldstatus $97,000
ⓘ Source: listings_history table (triggers on properties + properties_extension) + one-shot
backfill from property_details.listing_events for pre-trigger history.
Tax reassessment forecast IA · Partial reset (capped growth)
- Current annual tax
- $2,562 · $214/mo
- Projected year-2 tax
- $2,562 · $214/mo
- Expected delta
- $0/yr ($0/mo · 0.0%)
ⓘ Screening estimate from a state-policy table — verify with the county assessor before closing.
Climate risk First Street
- Flood 1/10 Low FEMA zone X (unshaded) · 0% chance over 30 yrs
- Wildfire 1/10 Low
- Heat 3/10 Moderate 7 d/yr ≥102°F today · 15 d/yr by 30 yrs out
- Wind 2/10 Low
- Air quality 2/10 Low 1 unhealthy d/yr today · 2 by 30 yrs out
Nearby sold comps map
Loading sold comps map…
Walkable amenities ~0.75 mi
Loading nearby amenities…
Taxation est. · year 1
- Rental income
- $18,498
- − Mortgage interest
- −$8,957
- − Property taxes
- −$2,562
- − Insurance
- −$800
- − Repairs & maintenance
- −$1,480
- − Management
- −$1,480
- − Depreciation
- −$4,652
- Taxable loss
- −$1,431
- Est. tax savings @ 24.0%
- +$344
- After-tax cash flow
- $1,533/yr
For passive investors: Depreciation is non-cash, so a rental often shows a tax loss while cash-flowing — sheltering income. Rental losses are passive: they offset passive income freely, and up to $25,000/yr can offset ordinary (W-2) income if you actively participate and your MAGI is under $100k (phasing out to $0 by $150k); unused losses carry forward. On sale, claimed depreciation is recaptured at up to 25%, and gains may owe capital-gains tax (a 1031 exchange can defer both). Figures are a year-1 estimate at your 24.0% rate — not tax advice; consult a CPA.
Schools (NCES district)
- District
- Dubuque Community School District
- NCES district ID
- 1909480
- Math proficiency
- 63% ▼ -7.00%
- Reading proficiency
- 65% ▼ -1.00%
- Median HH income
- $51,237
- Composite
- 54.51/100
- National rank
- #1345
- State rank
- #205 of 289 in IA
Livability — Dubuque
- Score
- 89/100
- State rank
- #7
- US rank
- #119
Category grades
Schools grade is shown separately in the Schools card above.
Census & demographics
- Census place
- Dubuque, IA
- County
- Dubuque County · 60,106 people
- City population
- 60,106
- Metro
- Dubuque, IA
- Population (ZIP)
- 43,101
- Household income
- $61,643
- Rent vs Own
- Severe rent burden
- 1940.0
Population outlook (Dubuque County) Hauer SSP2
- Today (2025)
- 103,359 people
- By 2030
- 106,472 · +3.0%
- By 2040
- 112,043 · +8.4%
- By 2050
- 116,553 · +12.8%
- By 2075
- 128,014 · +23.9%
- By 2100
- 132,892 · +28.6%
Race, ethnicity, and origin ACS 2023
- Neighborhood character
- Predominantly White (84%)
- Race & ethnicity
- White 84% Two or more races 6% Black 5% Hispanic / Latino 4% Asian 1% Pacific Islander 1%
- Common ancestry
- Portuguese 3% Italian 2% Lithuanian 2%
- Foreign-born
- 4% · Canada, China
- Languages at home
- 95% English-only · Spanish 3% Tagalog/Filipino 1% Other Asian/Pacific 1%
Political lean MEDSL · Dubuque
- 2024 margin
- Lean R (+8.6) · D 45.1% · R 53.7% · Other 1.2%
- 2008→2024 swing
- -29.4pp toward R · 2008: 20.8pp · 2024: -8.6pp
- All cycles
- 2024: R+8.6 2020: R+2.9 2016: R+1.2 2012: D+14.5 2008: D+20.8
Not yet ingested
- Civics
- —
Market trends
- HPI YoY
- ▼ -156.36%
- Current HPI
- 173.5536
- Rent YoY
- ▲ 5.63%
- Metro
- Dubuque, IA
- State GDP YoY
- ▲ 2.48%
- F500 in state
- 4
Industry mix (Fortune 500 HQ in IA)
| Industry | F500 HQs | Revenue |
|---|---|---|
| Financial Services | 1 | $16B |
|
||
| Retail / Convenience | 1 | $15B |
|
||
Price history
+64.8% since first listed6 events — show timeline
- 2026-06-08 Price Changed $159,900 ECIMLS
- 2026-05-07 Listed $162,500 ECIMLS
- 2015-03-25 Sold (Public Records) $119,500 Public Records
- 2015-03-20 Sold (MLS) $119,500 ECIMLS
- 2014-12-12 Listed $135,000 ECIMLS
- 2007-09-07 Sold (Public Records) $97,000 Public Records
Property tax history
+3.3%/yrLatest (2025): $2,562 · +3.1% YoY. Source: county tax records.
Cash-flow waterfall
monthlySold comps — $/sqft
last 12 mo · ≤1 miLoading sold comps…