 🏗️ New Construction
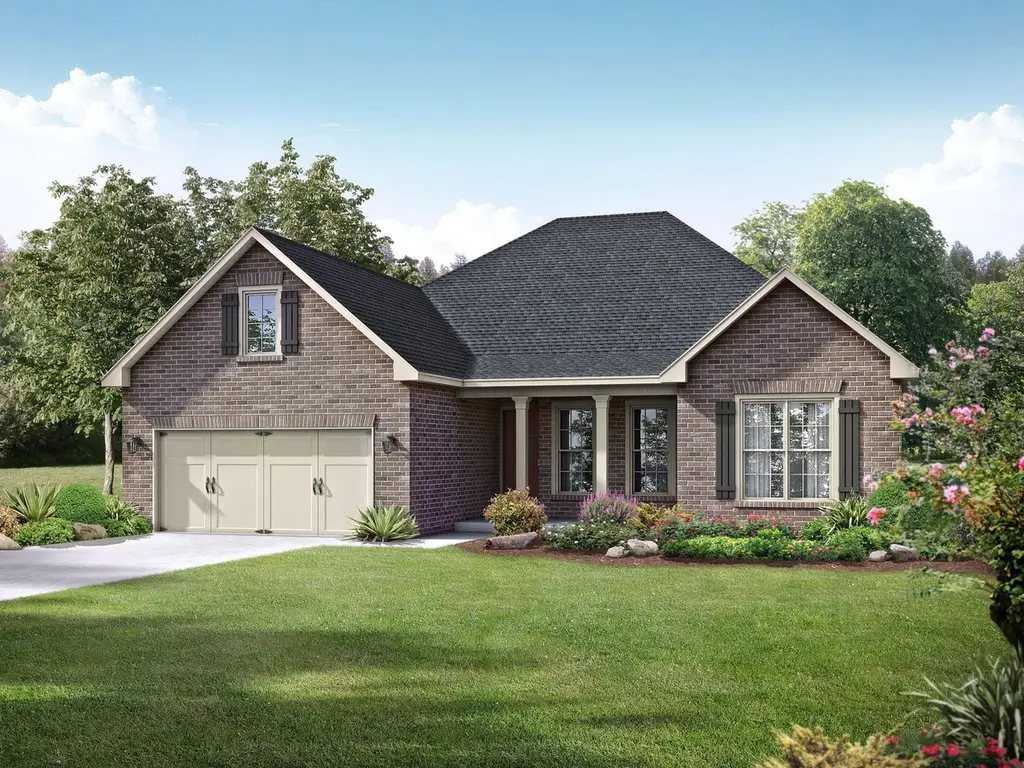
The Rockford Plan · Harvest, AL
Flood risk 1/10 · Minimal
- FEMA flood zone
- X (unshaded)
- Chance of flooding over 30 yrs
- 0.0%
- Est. flood insurance / yr
- $507 – $1,088
Fire risk 3/10 · Minor
- Est. fire insurance / yr
- $916 – $1,700
Heat risk 5/10 · Moderate
- Hot days now (above 104°F)
- 7 days/yr
- Hot days in 30 yrs
- 19 days/yr
Wind risk 4/10 · Minor
- Chance of severe wind over 30 yrs
- 17.0%
Air-quality risk 1/10 · Minimal
- Unhealthy air days now
- 0 days/yr
- Unhealthy air days in 30 yrs
- 0 days/yr
Risk factors via First Street. Map © Google.
Why this score? — see what drove the F grade
The composite is a weighted blend of 9 inputs, each scored 0–100. Each bar is that input's sub-score; the figure is the points it added to the 100-point composite (weight × sub-score).
- Appreciation +10.0/10.0
- ARV discount +7.5/15.0
- Schools +3.7/10.0
- Livability +3.6/5.0
- Cash flow +2.5/30.0
- Rent growth +2.5/5.0
- Condition / age +2.5/5.0
- 1% rule +0.0/10.0
- DSCR +0.0/10.0
$334,900
🖨 Deal sheet 📄 Offer letter ✓ Due diligence
Listing remarks MLS
With its charming, full-brick exterior, it's no wonder why The Rockford's our best-selling floor plan! A wall of windows floods the family room with natural light, and the kitchen invites you to cook - welcoming you with an oversized island, stainless-steel appliances and a large corner pantry. The isolated Master Suite features plenty of room and a massive walk-in closet. Make it your own with The Rockford's flexible floor plan: Add a bonus room or replace the home office with a fourth bedroom. It's your choice. Just know that offerings vary by location, so please discuss our standard features and upgrade options with your community's agent. Explore the Matterport tour HERE! * Attached photos may include upgrades and non-standard features.
Key facts
- Full brick exterior
- Wall of windows
- Oversized island
Tags
Neighborhood map
What this means for you Summary
Snapshot
- This is a 3-bed/2.5-bath single-family listed at $335k.
Deal economics
- At list price, monthly cash flow is $-1k ($-16k/yr) — negative.
- To cash-flow at today's rent, offer at most $194k (42.1% below list).
- To meet the 1% rule (rent ≥ 1% of price), the offer needs to be $172k (48.6% below list).
- Recommended offer: $172k (48.6% below list) — sets the bar for 1% rule.
- Cap rate 2.1% vs local median 3.5% in Harvest — below-typical yield; the buyer is paying a premium for something (appreciation thesis, condition, location) that the cap rate doesn't capture.
Location & tenants
- Location reads 72/100 on livability (#27 in AL) — a middle-class / working-renter tenant base. Strengths: crime A+, employment A+, cost of living A+; Watch: amenities F, commute F, health & safety F.
- Madison County (rural): math 27% / reading 56% proficiency, ranked #19 of 129 in AL (top 15%) — families likely to look elsewhere, expect single-tenant / working-renter base with shorter leases.
- Market conditions: 319 active listings in the ZIP; 4,709 units permitted in Madison County in 2024 (1,186 in 5+ unit buildings).
Forward outlook
- In year one you build about $42k of equity ($3k loan paydown + $39k appreciation (10.0% local appreciation)).
- Madison County population projected at +18% by 2050 — long-run rental-demand tailwind backs the buy-and-hold thesis.
- By year 2, paydown + projected appreciation supports a ~$67k cash-out refi (75% LTV) — recoverable capital for the next deal without selling this one.
Negotiation context
- It's been on market 462 days — a 12% lower offer ($295k) is reasonable based on typical stale-listing flexibility.
Risks & watch-outs
- Climate carrying-cost: extreme-heat days projected 7→19/yr by 2055 (HVAC capex compounding) — expect insurance premiums to compound above CPI over the hold.
Questions for the listing agent
- What do current leases actually rent for vs. the listed asking? Can we see a recent rent roll and the last 12 months of T-12 income?
- It's been on market 462 days. Have you received any prior offers? Is the seller open to a 49% concession, seller financing, or rate buy-down credit?
- What does the HOA fee cover, when was the last increase, and are there any pending special assessments or reserve-fund shortfalls?
- Why hasn't it sold? Are there any deal-killer items the seller is aware of (foundation, flood, title, zoning, code violations)?
- Is there a deadline driving the sale (1031 exchange, divorce, estate, relocation)? That informs how much negotiation room exists.
- The area grade is low — what's the realistic commute time and amenity access for the typical tenant pool here? Any planned neighborhood developments (good or bad) we should know about?
- What's the average days-on-market for RENTAL listings here right now (not sales)? A rising rental-DOM trend means longer vacancies and softer asking-rent achievability than the comps imply.
- What's the recent tenant-quality profile in this submarket — average credit score on applications, eviction rate, late-payment / NSF rate, and stable-employment percentage? A property-management company in the area should have these aggregated.
- How much new for-sale + rental construction is in the pipeline within 1–3 miles? Heavy new supply typically softens prices + rents 12–24 months out; constrained supply supports both.
Investment metrics
- 1% rule
- 0.44% ✗
- Cap rate
- 2.14%
- Cash-on-cash
- -14.83%
- DSCR
- 0.34
- GRM
- 18.8
CMA / ARV
- ARV (median comp)
- $388,534
- List price
- $334,900
- Delta
- -13.80%
- Verdict
- UNDERPRICED
- Comps
- 20 within 1.0 mi
Show comp detail 10 sales within ~0.75 mi
| Address | Dist | Beds/Ba | Sqft | Sold | Price | $/sf | Match |
|---|---|---|---|---|---|---|---|
| 236 White Horse Way | 0.13mi | 4/2.5 (+1) | 2,286 (0%) | 4mo | $339,900 | $149 | 86 |
| 116 Cowdray Cir | 0.10mi | 3/2.5 | 2,270 (-1%) | 15mo | $354,900 | $156 | 81 |
| 234 White Horse Way | 0.13mi | 4/3.0 (+1) | 2,411 (+6%) | 4mo | $373,244 | $155 | 75 |
| 130 Cowdray Cir | 0.30mi | 3/2.5 | 2,270 (-1%) | 14mo | $356,900 | $157 | 73 |
| 122 Cowdray Cir | 0.19mi | 3/3.0 | 2,461 (+8%) | 10mo | $379,900 | $154 | 68 |
| 202 White Horse Way | 0.23mi | 4/3.0 (+1) | 2,411 (+6%) | 18mo | $390,242 | $162 | 58 |
| 110 Goodwood Ln | 0.24mi | 3/2.0 | 2,076 (-9%) | 22mo | $377,065 | $182 | 54 |
| 210 White Horse Way | 0.33mi | 3/2.0 | 2,076 (-9%) | 17mo | $352,130 | $170 | 53 |
| 101 Cowdray Cir | 0.27mi | 4/3.0 (+1) | 2,461 (+8%) | 21mo | $462,289 | $188 | 50 |
| 1101 Bo Howard Rd | 0.72mi | 3/2.0 | 1,947 (-15%) | 2mo | $322,000 | $165 | 38 |
Match score weights: distance 35% · size 25% · config 20% · recency 20%. Top-matched comps best support the ARV.
Projected returns pro-forma
10.0% appreciation · 3.0% rent growth · sell at horizon
- IRR
- 14.0%
- Equity multiple
- 2.16×
- Total profit
- $126,043
- Equity at exit
- $350,022
- IRR
- 14.0%
- Equity multiple
- 5.03×
- Total profit
- $438,568
- Equity at exit
- $754,836
Cash invested: $108,789 (down + closing). Projections, not guarantees.
Landlord ↔ Tenant lean methodology
- Overall (STATE)
- 90 Strongly Landlord-Friendly
- State Alabama
- 90 Strongly Landlord-Friendly · R+15
- County
- — inherits STATE
- City
- — inherits STATE
ZIP-level market 35773
- Home prices YoY
- 28.8%
- Active inventory
- 319
- Price-to-rent
- 16.2×
Monthly cashflow live
- Estimated rent
- $1,723 medium interval (Pro) →
- Mortgage (P&I)
- −$2,038
- Tax est. 1.5%
- −$486 /mo · $5,828/yr
- Insurance
- −$162
- HOA
- −$20
- Vacancy / Maint / Mgmt
- −$362
- Net cashflow
- $-1,344
Break-even live
UW: 25.0% down · 7.5% · 30yr · 1.5% tax · 5.0% vac · 8.0% maint · 8.0% mgmt
Financing live
Cash to close
- Down payment
- $97,133
- Closing costs
- $11,656
- Reserves months
- —
- Total cash needed
- —
Loan-product check · same deal, 3 products live
Conventional
25% down · 7.5% · 30yr
- Down + closing
- —
- Monthly P&I
- —
- Monthly cashflow
- —
- DSCR
- —
- Eligible?
- —
Personal DTI + credit; lowest rate.
DSCR
20% down · 8.5% · 30yr
- Down + closing
- —
- Monthly P&I
- —
- Monthly cashflow
- —
- DSCR
- —
- Eligible?
- —
No personal income docs; deal must DSCR.
Hard money
10% down · 12.0% · 12mo
- Down + closing
- —
- Monthly P&I
- —
- Monthly cashflow
- —
- DSCR
- —
- Eligible?
- —
Short-term bridge; refi at stabilization.
HOA detail
- Monthly dues
- $20 · $240/yr
Listing history 14 events
-
2026-06-18days on market $334,900 Active 462 DOM
-
2026-06-17days on market $334,900 Active 461 DOM
-
2026-06-16days on market $334,900 Active 460 DOM
-
2026-06-15days on market $334,900 Active 459 DOM
-
2026-06-14days on market $334,900 Active 457 DOM
-
2026-06-10days on market $334,900 Active 454 DOM
-
2026-06-09days on market $334,900 Active 453 DOM
-
2026-06-08days on market $334,900 Active 452 DOM
-
2026-06-07days on market $334,900 Active 451 DOM
-
2026-06-02days on market $334,900 Active 446 DOM
-
2026-06-01days on market $334,900 Active 445 DOM
-
2026-05-31days on market $334,900 Active 444 DOM
-
2026-05-30days on market $334,900 Active 443 DOM
-
2025-03-13$334,900 Active 752-char remark
Show marketing remark (752 chars)
With its charming, full-brick exterior, it's no wonder why The Rockford's our best-selling floor plan! A wall of windows floods the family room with natural light, and the kitchen invites you to cook - welcoming you with an oversized island, stainless-steel appliances and a large corner pantry. The isolated Master Suite features plenty of room and a massive walk-in closet. Make it your own with The Rockford's flexible floor plan: Add a bonus room or replace the home office with a fourth bedroom. It's your choice. Just know that offerings vary by location, so please discuss our standard features and upgrade options with your community's agent. Explore the Matterport tour HERE! * Attached photos may include upgrades and non-standard features.
ⓘ Source: listings_history table (triggers on properties + properties_extension) + one-shot
backfill from property_details.listing_events for pre-trigger history.
Climate risk First Street
- Flood 1/10 Low FEMA zone X (unshaded) · 0% chance over 30 yrs
- Wildfire 3/10 Moderate
- Heat 5/10 Major 7 d/yr ≥104°F today · 19 d/yr by 30 yrs out
- Wind 4/10 Moderate 17% chance of damaging wind over 30 yrs
- Air quality 1/10 Low 0 unhealthy d/yr today · 0 by 30 yrs out
Nearby sold comps map
Loading sold comps map…
Walkable amenities ~0.75 mi
Loading nearby amenities…
Taxation est. · year 1
- Rental income
- $20,674
- − Mortgage interest
- −$21,764
- − Property taxes
- −$5,828
- − Insurance
- −$1,943
- − Repairs & maintenance
- −$1,654
- − Management
- −$1,654
- − HOA
- −$240
- − Depreciation
- −$11,303
- Taxable loss
- −$23,711
- Est. tax savings @ 24.0%
- +$5,691
- After-tax cash flow
- $-10,438/yr
For passive investors: Depreciation is non-cash, so a rental often shows a tax loss while cash-flowing — sheltering income. Rental losses are passive: they offset passive income freely, and up to $25,000/yr can offset ordinary (W-2) income if you actively participate and your MAGI is under $100k (phasing out to $0 by $150k); unused losses carry forward. On sale, claimed depreciation is recaptured at up to 25%, and gains may owe capital-gains tax (a 1031 exchange can defer both). Figures are a year-1 estimate at your 24.0% rate — not tax advice; consult a CPA.
Schools (NCES district)
- District
- Madison County
- NCES district ID
- 0102220
- Math proficiency
- 27% ▼ -32.00%
- Reading proficiency
- 56% ▼ -1.00%
- Median HH income
- $66,058
- Composite
- 37.15/100
- National rank
- #4483
- State rank
- #19 of 129 in AL
Livability — Harvest
- Score
- 72/100
- State rank
- #27
- US rank
- #5986
Category grades
Schools grade is shown separately in the Schools card above.
Census & demographics
- City population
- 30,710
- Population (ZIP)
- 13,977
Population outlook (Madison County) Hauer SSP2
- Today (2025)
- 392,086 people
- By 2030
- 409,788 · +4.5%
- By 2040
- 440,557 · +12.4%
- By 2050
- 460,990 · +17.6%
- By 2075
- 502,872 · +28.3%
- By 2100
- 513,623 · +31.0%
Race, ethnicity, and origin ACS 2023
- Neighborhood character
- Predominantly White (72%)
- Race & ethnicity
- White 72% Black 17% Hispanic / Latino 7% Two or more races 3% Asian 2%
- Hispanic origin (detail)
- Mexican 5%
- Common ancestry
- Italian 3% Slovak 1% Serbian 1%
- Foreign-born
- 2% · Canada
- Languages at home
- 95% English-only · Spanish 4%
Political lean MEDSL · Madison
- 2024 margin
- Lean R (+9.0) · D 44.7% · R 53.7% · Other 1.6%
- 2008→2024 swing
- +6.0pp toward D · 2008: -14.9pp · 2024: -9.0pp
- All cycles
- 2024: R+9.0 2020: R+8.0 2016: R+16.8 2012: R+18.7 2008: R+14.9
Not yet ingested
- Civics
- —
Market trends
- HPI YoY
- ▲ 149.14%
- Current HPI
- 666.8602
- Rent YoY
- —
- Metro
- —
- State GDP YoY
- ▲ 2.94%
- F500 in state
- 4
Industry mix (Fortune 500 HQ in AL)
| Industry | F500 HQs | Revenue |
|---|---|---|
| Financial Services | 1 | $8B |
|
||
| Healthcare | 1 | $5B |
|
||
Price history
1 event — show timeline
- 2025-03-13 Listed $334,900 Zillow
Cash-flow waterfall
monthlySold comps — $/sqft
last 12 mo · ≤1 miLoading sold comps…