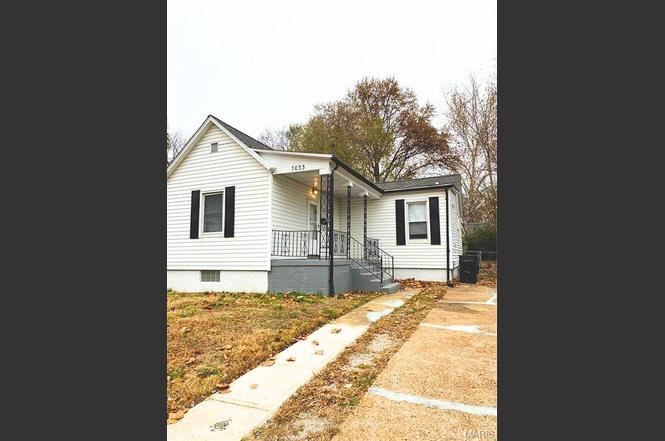
7033 Julian Ave · University City, MO
Flood risk 1/10 · Minimal
- FEMA flood zone
- X (unshaded)
- Chance of flooding over 30 yrs
- 0.0%
- Est. flood insurance / yr
- $473 – $860
Fire risk 1/10 · Minimal
- Est. fire insurance / yr
- $1,054 – $1,958
Heat risk 5/10 · Moderate
- Hot days now (above 107°F)
- 7 days/yr
- Hot days in 30 yrs
- 21 days/yr
Wind risk 2/10 · Minimal
- Chance of severe wind over 30 yrs
- 1.0%
Air-quality risk 4/10 · Minor
- Unhealthy air days now
- 4 days/yr
- Unhealthy air days in 30 yrs
- 5 days/yr
Risk factors via First Street. Map © Google.
Why this score? — see what drove the B+ grade
The composite is a weighted blend of 9 inputs, each scored 0–100. Each bar is that input's sub-score; the figure is the points it added to the 100-point composite (weight × sub-score).
- Cash flow +30.0/30.0
- ARV discount +15.0/15.0
- 1% rule +10.0/10.0
- DSCR +10.0/10.0
- Livability +3.7/5.0
- Rent growth +3.4/5.0
- Condition / age +2.5/5.0
- Schools +1.9/10.0
- Appreciation +0.0/10.0
$88,000
🖨 Deal sheet 📄 Offer letter ✓ Due diligence
Listing remarks MLS
This charming 2-bedroom, 1-bathroom home is an ideal addition to any rental portfolio. Already inspected, rented, and professionally managed, this property offers a seamless and hassle-free investment experience. The home boasts a comfortable layout with inviting living spaces, perfect for tenants seeking a cozy and functional place to live. With everything in place and well-maintained, this income-generating rental is ready for you to take over. Don’t miss out on this fantastic opportunity to add a solid asset to your investment portfolio!
Key facts
- Private driveway
- Front entrance
- Rear entry exit
Tags
Property features AI
Exterior
- Utilities: Public water; Public sewer; Electric service by Ameren; Natural gas available; Electricity available; Water available
- Home design: Single-family residence; One story
- Construction: Vinyl siding
- Exterior features: Front yard; Back yard
Interior
- Bedrooms: 2 bedrooms (both on the main level)
- Bathrooms: 1 full bathroom (main level)
- Heating & cooling: Forced air heating; Central air conditioning
- Interior features: Unfinished basement
Neighborhood map
What this means for you Summary
Snapshot
- This is a 2-bed/1.0-bath single-family listed at $88k.
Deal economics
- At list price, monthly cash flow is $624 ($7k/yr) — positive.
- The deal already cash-flows at list — no discount required.
- Meets the 1% rule at list price ($2k rent vs $88k).
- Cap rate 14.8% vs local median 4.9% in University City — top-decile yield for the area; either an underpriced asset or a hidden risk that comps aren't pricing in. Stress-test before assuming the spread holds.
Location & tenants
- Location reads 73/100 on livability (#84 in MO) — a middle-class / working-renter tenant base. Strengths: employment A+, housing A+, cost of living B; Watch: amenities D-, commute D-, health & safety F.
- University City (suburban): math 15% / reading 26% proficiency, ranked #297 of 324 in MO (top 92%) — low school quality limits family demand, transient renter base, plan for 1-2y turnover; 67% free/reduced lunch — lower-income household profile, screen leases tightly.
- Zoned schools: Pershing Elem. (math 8% / reading 12%, grade F, #1,037 of 1,115 statewide, top 94%, 265 students, 100% FRL); University City Sr. High (math 5% / reading 52%, grade F, #409 of 521 statewide, top 79%, 726 students, 100% FRL) — zoned schools average 100% FRL vs 67% district-wide (32 pts higher); higher-poverty schools than district average — tighter screening recommended.
- Market conditions: Rents rising (+3.6%/yr); 162 active listings in the ZIP; 40 comparable units currently listed for rent nearby; rentals at typical pace (median 24d on market — plan ~3-4 weeks tenant-placement turnaround); solid renter incomes; 920 units permitted in St. Louis County in 2024 (250 in 5+ unit buildings).
Forward outlook
- Local home prices are declining (-3.0%/yr); year-one equity from $608 of loan paydown is wiped out by about $3k of value loss. Plan a longer hold.
- At projected returns (-3.0% appreciation + 3.6% rent growth), your $25k cash investment doubles in ~4 years — after that, you're playing with house money.
Negotiation context
- Only 1 days on market — expect competitive offers; lowballing is unlikely to land.
- 7 sale attempts since 14y ago; this cycle's ask is 6940% above the opening price — seller raised mid-cycle; expect resistance to lowballs.
Risks & watch-outs
- Watch-outs: built in 1904 — expect roof / HVAC / electrical / plumbing capex.
- Climate carrying-cost: extreme-heat days projected 7→21/yr by 2055 (HVAC capex compounding) — expect insurance premiums to compound above CPI over the hold.
Questions for the listing agent
- Built in 1904 — when were the roof, HVAC, electrical panel, plumbing, and water heater last replaced?
- Is there a deadline driving the sale (1031 exchange, divorce, estate, relocation)? That informs how much negotiation room exists.
- Schools are B-rated — typically a magnet for longer-tenancy family renters. What's the average tenant stay here, and is there a school-zone premium baked into asking?
- What's the average days-on-market for RENTAL listings here right now (not sales)? A rising rental-DOM trend means longer vacancies and softer asking-rent achievability than the comps imply.
- What's the recent tenant-quality profile in this submarket — average credit score on applications, eviction rate, late-payment / NSF rate, and stable-employment percentage? A property-management company in the area should have these aggregated.
- How much new for-sale + rental construction is in the pipeline within 1–3 miles? Heavy new supply typically softens prices + rents 12–24 months out; constrained supply supports both.
Investment metrics
- 1% rule
- 1.75% ✓
- Cap rate
- 14.80%
- Cash-on-cash
- 30.38%
- DSCR
- 2.35
- GRM
- 4.7
CMA / ARV
- ARV (on-the-fly)
- $143,640
- Comps found
- 12
Show comp detail 12 sales within ~0.75 mi
| Address | Dist | Beds/Ba | Sqft | Sold | Price | $/sf | Match |
|---|---|---|---|---|---|---|---|
| 6934 Julian Ave | 0.15mi | 2/1.0 | 1,158 (+7%) | 1mo | $130,000 | $112 | 80 |
| 7033 Camden Ct | 0.32mi | 3/1.0 (+1) | 1,151 (+7%) | 2mo | $164,900 | $143 | 67 |
| 6736 Julian Ave | 0.49mi | 3/2.0 (+1) | 1,055 (-2%) | 3mo | $139,900 | $133 | 62 |
| 6534 Whitney Ave | 0.67mi | 2/1.0 | 1,126 (+4%) | 0mo | $65,000 | $58 | 61 |
| 7048 Arcadia Ave | 0.19mi | 3/1.0 (+1) | 1,232 (+14%) | 3mo | $219,000 | $178 | 60 |
| 7155 Willow Tree Ln | 0.33mi | 3/1.5 (+1) | 1,200 (+11%) | 3mo | $210,000 | $175 | 56 |
| 1600 Bradford Ave | 0.57mi | 3/2.0 (+1) | 1,008 (-7%) | 2mo | $75,000 | $74 | 52 |
| 1509 Bradford Ave | 0.50mi | 3/1.0 (+1) | 1,208 (+12%) | 0mo | $45,000 | $37 | 52 |
| 1140 E Parkedge Ln | 0.50mi | 2/1.5 | 1,230 (+14%) | 1mo | $269,900 | $219 | 51 |
| 6745 Vernon Ave | 0.69mi | 1/1.0 (-1) | 1,005 (-7%) | 3mo | $99,000 | $99 | 49 |
| 7331 Wayne Ave | 0.74mi | 2/1.0 | 950 (-12%) | 1mo | $159,900 | $168 | 45 |
| 6526 Avalon Ave | 0.73mi | 2/1.0 | 930 (-14%) | 0mo | $104,900 | $113 | 42 |
Match score weights: distance 35% · size 25% · config 20% · recency 20%. Top-matched comps best support the ARV.
Projected returns pro-forma
-3.0% appreciation · 3.61% rent growth · sell at horizon
- IRR
- 25.7%
- Equity multiple
- 2.07×
- Total profit
- $26,444
- Equity at exit
- $13,121
- IRR
- 33.8%
- Equity multiple
- 4.17×
- Total profit
- $78,216
- Equity at exit
- $7,609
Cash invested: $24,640 (down + closing). Projections, not guarantees.
Landlord ↔ Tenant lean methodology
- Overall (STATE)
- 81 Strongly Landlord-Friendly
- State Missouri
- 81 Strongly Landlord-Friendly · R+10
- County
- — inherits STATE
- City
- — inherits STATE
ZIP-level market 63130
- Rents YoY
- 3.6%
- Active inventory
- 162
- Price-to-rent
- 4.7×
Monthly cashflow live
- Estimated rent
- $1,544 high interval (Pro) →
- Mortgage (P&I)
- −$461
- Tax from tax record
- −$98 /mo · $1,173/yr
- Insurance
- −$37
- HOA
- −$0
- Vacancy / Maint / Mgmt
- −$324
- Net cashflow
- $624
Break-even live
UW: 25.0% down · 7.5% · 30yr · 1.5% tax · 5.0% vac · 8.0% maint · 8.0% mgmt
Financing live
Cash to close
- Down payment
- $22,000
- Closing costs
- $2,640
- Reserves months
- —
- Total cash needed
- —
Loan-product check · same deal, 3 products live
Conventional
25% down · 7.5% · 30yr
- Down + closing
- —
- Monthly P&I
- —
- Monthly cashflow
- —
- DSCR
- —
- Eligible?
- —
Personal DTI + credit; lowest rate.
DSCR
20% down · 8.5% · 30yr
- Down + closing
- —
- Monthly P&I
- —
- Monthly cashflow
- —
- DSCR
- —
- Eligible?
- —
No personal income docs; deal must DSCR.
Hard money
10% down · 12.0% · 12mo
- Down + closing
- —
- Monthly P&I
- —
- Monthly cashflow
- —
- DSCR
- —
- Eligible?
- —
Short-term bridge; refi at stabilization.
Rent comps 40 comps
| Address | Beds | Baths | Sqft | Rent | $/sqft | DOM | Units | Dist |
|---|---|---|---|---|---|---|---|---|
| 7034 Corbitt Ave Saint Louis, MO | 2.0 | 2.0 | 870 | $1,450 | $1.67 | 24d | 1 | 0.15mi |
| 6913 Etzel Ave Unit 1496954P University City, MO | 3.0 | 2.0 | 1399 | $5,767 | $4.12 | 7d | 1 | 0.27mi |
| 1115 Backer St Saint Louis, MO | 3.0 | 1.0 | 984 | $1,495 | $1.52 | 24d | 1 | 0.28mi |
| 6827 Melrose Ave Saint Louis, MO | 2.0 | 1.0 | 1200 | $1,300 | $1.08 | 7d | 1 | 0.32mi |
| 1195 Belrue Ave Unit 2S St. Louis, MO | 1.0 | 1.0 | 800 | $795 | $0.99 | 24d | 1 | 0.47mi |
| 7055 Dartmouth Ave Unit 1 University City, MO | 2.0 | 1.0 | 1320 | $2,100 | $1.59 | 44d | 1 | 0.58mi |
| 7055 Dartmouth Ave Unit 2 University City, MO | 2.0 | 1.0 | 1320 | $2,100 | $1.59 | 44d | 1 | 0.58mi |
| 7125 Dartmouth Ave Saint Louis, MO | 2.0 | 1.0 | 1242 | $1,550 | $1.25 | 44d | 1 | 0.59mi |
| 6704 Etzel Ave Saint Louis, MO | 2.0 | 1.0 | 825 | $1,325 | $1.61 | 44d | 1 | 0.61mi |
| 7120 Dartmouth Ave Unit A University City, MO | 2.0 | 1.0 | 1200 | $1,345 | $1.12 | 3d | 1 | 0.62mi |
| 7361 Melrose Ave Saint Louis, MO | 3.0 | 2.0 | 1278 | $2,095 | $1.64 | 44d | 1 | 0.63mi |
| 6636 Etzel Ave Saint Louis, MO | 3.0 | 1.5 | 1019 | $1,350 | $1.32 | 7d | 1 | 0.65mi |
| 6636 Etzel Ave Saint Louis, MO | 3.0 | 2.0 | 1019 | $1,350 | $1.32 | 20d | 1 | 0.65mi |
| 1535 N Jackson Ave Saint Louis, MO | 2.0 | 1.0 | 988 | $1,450 | $1.47 | 44d | 1 | 0.65mi |
| 7104 Tulane Ave Saint Louis, MO | 2.0 | 1.0 | 1400 | $1,745 | $1.25 | 44d | 1 | 0.66mi |
| 7104 Tulane Ave Unit 1 University City, MO | 2.0 | 1.0 | 1200 | $1,900 | $1.58 | 24d | 1 | 0.66mi |
| 7156 Tulane Ave Unit 56A University City, MO | 2.0 | 1.0 | 1000 | $1,295 | $1.29 | 22d | 1 | 0.68mi |
| 7204 Tulane Ave Unit 7204-B Tulane University City, MO | 2.0 | 1.0 | 1100 | $1,100 | $1.00 | 44d | 1 | 0.68mi |
| 7254 Tulane Ave #1 University City, MO | 2.0 | 1.0 | 1144 | $1,600 | $1.40 | 18d | 1 | 0.72mi |
| 6543 Etzel Ave Saint Louis, MO | 3.0 | 1.0 | 967 | $1,600 | $1.65 | 18d | 1 | 0.73mi |
| 7430 Canton Ave Saint Louis, MO | 3.0 | 1.0 | 1075 | $1,450 | $1.35 | 24d | 1 | 0.81mi |
| 6614 Chamberlain Ave Saint Louis, MO | 3.0 | 2.0 | 1000 | $1,820 | $1.82 | 24d | 1 | 0.83mi |
| 7350 Amherst Ave Unit 1E University City, MO | 2.0 | 1.0 | 1100 | $1,795 | $1.63 | 18d | 1 | 0.83mi |
| 7386 Milan Ave Saint Louis, MO | 2.0 | 1.0 | 960 | $1,400 | $1.46 | 4d | 1 | 0.84mi |
| 1351 N Hanley Rd Saint Louis, MO | 1.0–2.0 | 1.0–2.0 | 911 | $1,575 | $1.73 | 44d | 1 | 0.85mi |
| 7261 Delmar Blvd University City, MO | 3.0 | 1.0 | 1416 | $1,950 | $1.38 | 2d | 1 | 0.96mi |
| 1086 Wilshire Ave Saint Louis, MO | 2.0 | 1.0 | 1080 | $1,306 | $1.21 | 4d | 1 | 1.07mi |
| 6318 Cabanne Ave Apt 1w University City, MO | 2.0 | 1.0 | 950 | $1,250 | $1.32 | 4d | 1 | 1.08mi |
| 7720 Ahern Ave University City, MO | 2.0 | 1.0 | 1080 | $1,350 | $1.25 | 44d | 1 | 1.09mi |
| 1245 North and South Rd Saint Louis, MO | 2.0 | 1.0 | 860 | $1,200 | $1.40 | 15d | 1 | 1.10mi |
| 6312 Cates Ave Unit 2E University City, MO | 2.0 | 1.0 | 900 | $1,300 | $1.44 | 44d | 1 | 1.14mi |
| 6650 Delmar Blvd Saint Louis, MO | 3.0 | 1.0–3.0 | 760 | $1,756 | $2.31 | 2d | 1 | 1.16mi |
| 716 Westgate Ave Unit 3 University City, MO | 3.0 | 2.0 | 1500 | $2,995 | $2.00 | 44d | 1 | 1.16mi |
| 7737 Wild Plum Ln University City, MO | 3.0 | 1.5 | 900 | $1,200 | $1.33 | 12d | 1 | 1.17mi |
| 978 Warder Ave University City, MO | 3.0 | 1.5 | 1100 | $1,145 | $1.04 | 24d | 1 | 1.19mi |
| 908 Eastgate Ave Unit 2N University City, MO | 2.0 | 1.0 | 900 | $1,300 | $1.44 | 4d | 1 | 1.20mi |
| 6409 Enright Ave University City, MO | 3.0 | 1.5 | 1320 | $2,420 | $1.83 | 2d | 2 | 1.20mi |
| 6274 Cates Ave Saint Louis, MO | 3.0 | 2.0 | 1400 | $2,295 | $1.64 | 44d | 1 | 1.21mi |
| 900 Eastgate Ave Saint Louis, MO | 2.0 | 1.0 | 900 | $1,095 | $1.22 | 44d | 1 | 1.21mi |
| 6261 Clemens Ave Saint Louis, MO | 3.0 | 1.0 | 1200 | $1,700 | $1.42 | 44d | 1 | 1.23mi |
Listing history 2 events
-
2026-06-19remarks 699-char remark
-
2026-06-19$88,000 Coming Soon 1 DOM
ⓘ Source: listings_history table (triggers on properties + properties_extension) + one-shot
backfill from property_details.listing_events for pre-trigger history.
Tax reassessment forecast MO · Resets to sale price
- Current annual tax
- $1,173 · $98/mo
- Projected year-2 tax
- $1,173 · $98/mo
- Expected delta
- $0/yr ($0/mo · 0.0%)
ⓘ Screening estimate from a state-policy table — verify with the county assessor before closing.
Climate risk First Street
- Flood 1/10 Low FEMA zone X (unshaded) · 0% chance over 30 yrs
- Wildfire 1/10 Low
- Heat 5/10 Major 7 d/yr ≥107°F today · 21 d/yr by 30 yrs out
- Wind 2/10 Low 100% chance of damaging wind over 30 yrs
- Air quality 4/10 Moderate 4 unhealthy d/yr today · 5 by 30 yrs out
Nearby sold comps map
Loading sold comps map…
Walkable amenities ~0.75 mi
Loading nearby amenities…
Taxation est. · year 1
- Rental income
- $18,528
- − Mortgage interest
- −$4,929
- − Property taxes
- −$1,173
- − Insurance
- −$440
- − Repairs & maintenance
- −$1,482
- − Management
- −$1,482
- − Depreciation
- −$2,560
- Taxable income
- $6,461
- Est. tax owed @ 24.0%
- −$1,551
- After-tax cash flow
- $5,936/yr
For passive investors: Depreciation is non-cash, so a rental often shows a tax loss while cash-flowing — sheltering income. Rental losses are passive: they offset passive income freely, and up to $25,000/yr can offset ordinary (W-2) income if you actively participate and your MAGI is under $100k (phasing out to $0 by $150k); unused losses carry forward. On sale, claimed depreciation is recaptured at up to 25%, and gains may owe capital-gains tax (a 1031 exchange can defer both). Figures are a year-1 estimate at your 24.0% rate — not tax advice; consult a CPA.
Schools (NCES district)
- District
- University City
- NCES district ID
- 2930660
- Math proficiency
- 15% ▼ -10.00%
- Reading proficiency
- 26% ▼ -7.00%
- Median HH income
- $52,927
- Composite
- 18.57/100
- National rank
- #8910
- State rank
- #297 of 324 in MO
Livability — University City
- Score
- 73/100
- State rank
- #84
- US rank
- #5618
Category grades
Schools grade is shown separately in the Schools card above.
Census & demographics
- Census place
- University City, MO
- County
- Saint Louis County · 888,823 people
- City population
- 28,910
- Metro
- St. Louis, MO-IL
- Population (ZIP)
- 28,910
- Household income
- $85,823
- Rent vs Own
- Severe rent burden
- 893.0
Population outlook (St. Louis County) Hauer SSP2
- Today (2025)
- 1,025,227 people
- By 2030
- 1,028,023 · +0.3%
- By 2040
- 1,020,940 · -0.4%
- By 2050
- 1,007,280 · -1.8%
- By 2075
- 987,277 · -3.7%
- By 2100
- 921,984 · -10.1%
Race, ethnicity, and origin ACS 2023
- Neighborhood character
- Diverse neighborhood (Simpson 0.61)
- Race & ethnicity
- White 54% Black 31% Asian 6% Two or more races 6% Hispanic / Latino 4%
- Common ancestry
- Italian 3% Romanian 3% Lithuanian 2%
- Foreign-born
- 11% · China, Canada, Vietnam
- Languages at home
- 89% English-only · Chinese 4% Spanish 2% French/Haitian/Cajun 1%
Political lean MEDSL · St. Louis
- 2024 margin
- Strong D (+23.4) · D 60.8% · R 37.4% · Other 1.7%
- 2008→2024 swing
- +3.5pp toward D · 2008: 19.9pp · 2024: 23.4pp
- All cycles
- 2024: D+23.4 2020: D+24.0 2016: D+16.2 2012: D+13.7 2008: D+19.9
Not yet ingested
- Civics
- —
Market trends
- HPI YoY
- ▼ -436.88%
- Current HPI
- 185.599
- Rent YoY
- ▲ 3.61%
- Metro
- St. Louis, MO-IL
- State GDP YoY
- ▲ 1.84%
- F500 in state
- 20
Industry mix (Fortune 500 HQ in MO)
| Industry | F500 HQs | Revenue |
|---|---|---|
| Healthcare | 1 | $163B |
|
||
| Insurance | 1 | $21B |
|
||
| Industrial Technology | 1 | $17B |
|
||
| Retail | 1 | $16B |
|
||
| Industrial Distribution | 1 | $10B |
|
||
| Utilities | 1 | $9B |
|
||
Price history
+486.7% since first listed26 events — show timeline
- 2026-06-18 Coming Soon $88,000 MARIS as Distributed by MLS Grid
- 2025-10-21 Rental Removed $1,250 MARIS
- 2025-07-26 Listed for Rent $1,250 MARIS
- 2024-11-15 Sold (MLS) — MARIS as Distributed by MLS Grid
- 2024-10-02 Pending — MARIS as Distributed by MLS Grid
- 2024-09-21 Price Changed $105,000 MARIS as Distributed by MLS Grid
- 2024-09-04 Listed $109,000 MARIS as Distributed by MLS Grid
- 2023-11-02 Delisted — MARIS as Distributed by MLS Grid
- 2023-07-18 Price Changed $129,000 MARIS as Distributed by MLS Grid
- 2023-06-13 Listed $135,000 MARIS as Distributed by MLS Grid
- 2018-01-22 Listed $57,500 MARIS as Distributed by MLS Grid
- 2018-01-22 Sold (MLS) — MARIS as Distributed by MLS Grid
- 2017-08-28 Sold (Public Records) $233,000 Public Records
- 2016-12-12 Sold (Public Records) $24,000 Public Records
- 2016-12-08 Sold (MLS) — MARIS as Distributed by MLS Grid
- 2016-11-16 Pending — MARIS as Distributed by MLS Grid
- 2016-11-09 Price Changed $24,900 MARIS as Distributed by MLS Grid
- 2016-11-09 Relisted — MARIS as Distributed by MLS Grid
- 2016-09-26 Delisted — MARIS as Distributed by MLS Grid
- 2016-05-31 Price Changed $34,900 MARIS as Distributed by MLS Grid
- 2016-04-29 Listed $39,900 MARIS as Distributed by MLS Grid
- 2013-04-01 Sold (Public Records) $7,600 Public Records
- 2013-04-01 Sold (MLS) — MARIS as Distributed by MLS Grid
- 2012-11-13 Listed $14,000 MARIS as Distributed by MLS Grid
- 2000-05-19 Sold (Public Records) $50,000 Public Records
- 1998-04-30 Sold (Public Records) $15,000 Public Records
Property tax history
+1.9%/yrLatest (2022): $1,173 · +1.0% YoY. Source: county tax records.
Cash-flow waterfall
monthlySold comps — $/sqft
last 12 mo · ≤1 miLoading sold comps…