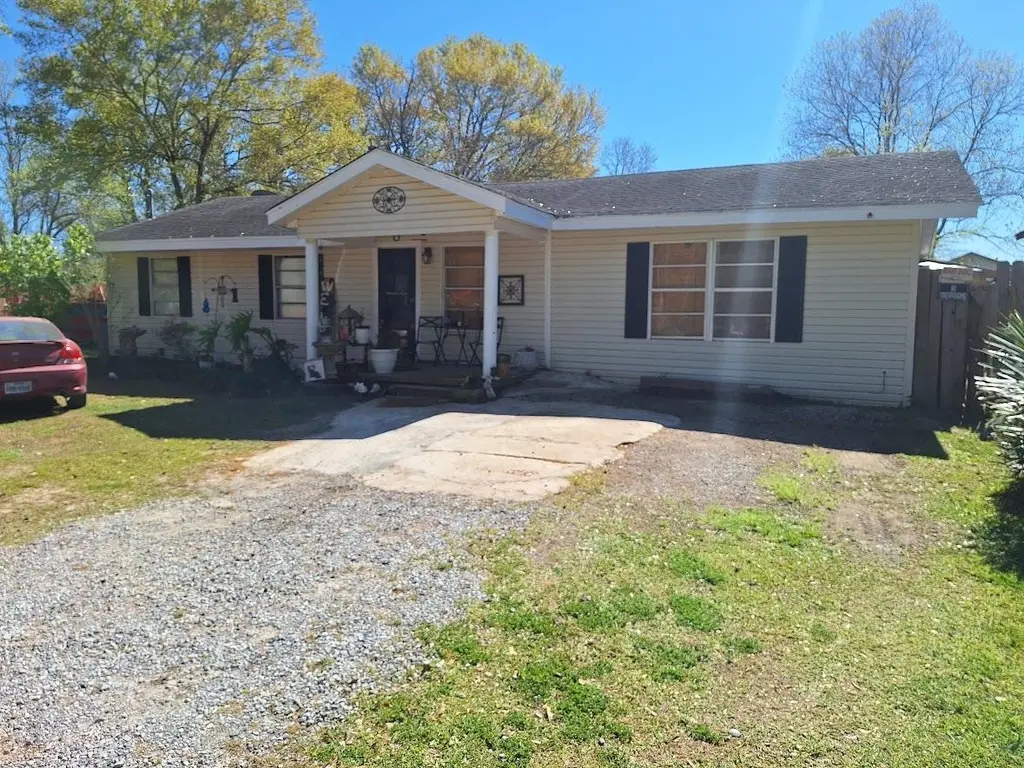
140 Dupuis St · Bridge City, TX
Flood risk 9/10 · Severe
- FEMA flood zone
- X (shaded)
- Chance of flooding over 30 yrs
- 0.98%
- Est. flood insurance / yr
- $507 – $1,088
Fire risk 3/10 · Minor
- Est. fire insurance / yr
- $1,222 – $2,270
Heat risk 9/10 · Severe
- Hot days now (above 109°F)
- 7 days/yr
- Hot days in 30 yrs
- 24 days/yr
Wind risk 9/10 · Severe
- Chance of severe wind over 30 yrs
- 99.0%
Air-quality risk 2/10 · Minimal
- Unhealthy air days now
- 1 days/yr
- Unhealthy air days in 30 yrs
- 1 days/yr
Risk factors via First Street. Map © Google.
Why this score? — see what drove the C- grade
The composite is a weighted blend of 9 inputs, each scored 0–100. Each bar is that input's sub-score; the figure is the points it added to the 100-point composite (weight × sub-score).
- Cash flow +18.4/30.0
- ARV discount +11.5/15.0
- DSCR +5.8/10.0
- 1% rule +5.1/10.0
- Schools +4.0/10.0
- Livability +3.6/5.0
- Rent growth +2.5/5.0
- Condition / age +2.5/5.0
- Appreciation +0.0/10.0
$145,000
🖨 Deal sheet 📄 Offer letter ✓ Due diligence
Listing remarks MLS
This 4-bedroom, 1.5 bathroom home offers 1,392 square feet of comfortable living space and is full of character and potential. Step inside to find beautiful hand-sawn wood floors that embraces that cottage charm. The kitchen and bathroom have been thoughtfully updated blending modern touches with classic appeal. Don't miss your opportunity to make this home shine as your own.
Key facts
- Kitchen updated
- Bathroom updated
- Listed 321 days
Tags
Neighborhood map
What this means for you Summary
Snapshot
- This is a 4-bed/1.5-bath single-family listed at $145k.
Deal economics
- At list price, monthly cash flow is $69 ($824/yr) — positive.
- The deal already cash-flows at list — no discount required.
- Meets the 1% rule at list price ($1k rent vs $145k).
- Recommended offer: $128k (12.0% below list) — sets the bar for market timing.
- Cap rate 7.4% vs local median 2.2% in Bridge City — top-decile yield for the area; either an underpriced asset or a hidden risk that comps aren't pricing in. Stress-test before assuming the spread holds.
Location & tenants
- Location reads 72/100 on livability (#251 in TX) — a middle-class / working-renter tenant base. Strengths: crime A+, employment A+, cost of living A+; Watch: schools C-, amenities F, commute F.
- Bridge City ISD (other): math 41% / reading 51% proficiency, ranked #224 of 826 in TX (top 27%) — families likely to look elsewhere, expect single-tenant / working-renter base with shorter leases.
- Market conditions: 125 active listings in the ZIP; 6 comparable units currently listed for rent nearby; rentals at typical pace (median 24d on market — plan ~3-4 weeks tenant-placement turnaround); solid renter incomes; 235 units permitted in Orange County in 2024 (50 in 5+ unit buildings).
Forward outlook
- Local home prices are declining (-3.0%/yr); year-one equity from $1k of loan paydown is wiped out by about $4k of value loss. Plan a longer hold.
- Orange County population projected at +6% by 2050 — modest demand growth; plan on rents tracking national, not racing it.
Negotiation context
- It's been on market 321 days — a 12% lower offer ($128k) is reasonable based on typical stale-listing flexibility.
Risks & watch-outs
- Watch-outs: flood insurance adds $66/mo; built in 1950 — expect roof / HVAC / electrical / plumbing capex.
- Climate carrying-cost: severe flood risk; severe wind risk, 99% chance of damaging wind over 30y; extreme-heat days projected 7→24/yr by 2055 (HVAC capex compounding) — expect insurance premiums to compound above CPI over the hold.
Questions for the listing agent
- It's been on market 321 days. Have you received any prior offers? Is the seller open to a 12% concession, seller financing, or rate buy-down credit?
- Built in 1950 — when were the roof, HVAC, electrical panel, plumbing, and water heater last replaced?
- What's the actual annual flood-insurance premium (NFIP or private), and is the property in a SFHA with mandatory coverage?
- Why hasn't it sold? Are there any deal-killer items the seller is aware of (foundation, flood, title, zoning, code violations)?
- Is there a deadline driving the sale (1031 exchange, divorce, estate, relocation)? That informs how much negotiation room exists.
- What's the average days-on-market for RENTAL listings here right now (not sales)? A rising rental-DOM trend means longer vacancies and softer asking-rent achievability than the comps imply.
- What's the recent tenant-quality profile in this submarket — average credit score on applications, eviction rate, late-payment / NSF rate, and stable-employment percentage? A property-management company in the area should have these aggregated.
- How much new for-sale + rental construction is in the pipeline within 1–3 miles? Heavy new supply typically softens prices + rents 12–24 months out; constrained supply supports both.
Investment metrics
- 1% rule
- 1.01% ✓
- Cap rate
- 7.41%
- Cash-on-cash
- 3.99%
- DSCR
- 1.18
- GRM
- 8.2
CMA / ARV
- ARV (median comp)
- $159,080
- List price
- $145,000
- Delta
- -8.85%
- Verdict
- FAIR
- Comps
- 16 within 1.0 mi
Show comp detail 4 sales within ~0.75 mi
| Address | Dist | Beds/Ba | Sqft | Sold | Price | $/sf | Match |
|---|---|---|---|---|---|---|---|
| 505 Shannons Way | 0.38mi | 3/2.0 (-1) | 1,423 (+2%) | 9mo | $234,000 | $164 | 64 |
| 515 Romero St | 0.42mi | 3/2.0 (-1) | 1,455 (+4%) | 8mo | $109,000 | $75 | 59 |
| 2245 Granger Dr | 0.40mi | 3/2.0 (-1) | 1,473 (+6%) | 20mo | $149,900 | $102 | 48 |
| 245 N Clover St | 0.57mi | 3/2.0 (-1) | 1,210 (-13%) | 1mo | $149,900 | $124 | 44 |
Match score weights: distance 35% · size 25% · config 20% · recency 20%. Top-matched comps best support the ARV.
Projected returns pro-forma
-3.0% appreciation · 3.0% rent growth · sell at horizon
- IRR
- -13.0%
- Equity multiple
- 0.53×
- Total profit
- $-19,049
- Equity at exit
- $21,620
- IRR
- -3.9%
- Equity multiple
- 0.74×
- Total profit
- $-10,649
- Equity at exit
- $12,537
Cash invested: $40,600 (down + closing). Projections, not guarantees.
Landlord ↔ Tenant lean methodology
- Overall (STATE)
- 87 Strongly Landlord-Friendly
- State Texas
- 87 Strongly Landlord-Friendly · R+5
- County
- — inherits STATE
- City
- — inherits STATE
ZIP-level market 77611
- Active inventory
- 125
- Price-to-rent
- 8.2×
Monthly cashflow live
- Estimated rent
- $1,467 high interval (Pro) →
- Mortgage (P&I)
- −$760
- Tax from tax record
- −$203 /mo · $2,433/yr
- Insurance
- −$60
- Flood insurance flood zone
- −$66 /mo · $798/yr
- HOA
- −$0
- Vacancy / Maint / Mgmt
- −$308
- Net cashflow
- $69
Break-even live
UW: 25.0% down · 7.5% · 30yr · 1.5% tax · 5.0% vac · 8.0% maint · 8.0% mgmt
Financing live
Cash to close
- Down payment
- $36,250
- Closing costs
- $4,350
- Reserves months
- —
- Total cash needed
- —
Loan-product check · same deal, 3 products live
Conventional
25% down · 7.5% · 30yr
- Down + closing
- —
- Monthly P&I
- —
- Monthly cashflow
- —
- DSCR
- —
- Eligible?
- —
Personal DTI + credit; lowest rate.
DSCR
20% down · 8.5% · 30yr
- Down + closing
- —
- Monthly P&I
- —
- Monthly cashflow
- —
- DSCR
- —
- Eligible?
- —
No personal income docs; deal must DSCR.
Hard money
10% down · 12.0% · 12mo
- Down + closing
- —
- Monthly P&I
- —
- Monthly cashflow
- —
- DSCR
- —
- Eligible?
- —
Short-term bridge; refi at stabilization.
Rent comps 6 comps
| Address | Beds | Baths | Sqft | Rent | $/sqft | DOM | Units | Dist |
|---|---|---|---|---|---|---|---|---|
| 400 Bower Rd Unit CP16 Bridge City, TX | 3.0 | 1.0 | 892 | $895 | $1.00 | 13d | 1 | 0.34mi |
| 400 Bower Rd Unit Cp Bridge City, TX | 3.0 | 1.0 | 892 | $895 | $1.00 | 43d | 1 | 0.34mi |
| 400 Bower Rd Unit Cp Bridge City, TX | 3.0 | 1.0 | 892 | $895 | $1.00 | 23d | 1 | 0.34mi |
| 2201 Wise St Bridge City, TX | 2.0–3.0 | 1.0–2.0 | 1144 | $1,500 | $1.31 | 13d | 7 | 0.34mi |
| 516 Shannons Way Bridge City, TX | 3.0 | 2.0 | 1800 | $1,800 | $1.00 | 13d | 1 | 0.46mi |
| 880 Morning Glory Dr Bridge City, TX | 3.0 | 2.0 | 1515 | $1,795 | $1.18 | 43d | 1 | 0.70mi |
Listing history 18 events
-
2026-06-18days on market $145,000 Active 321 DOM
-
2026-06-17days on market $145,000 Active 320 DOM
-
2026-06-16days on market $145,000 Active 319 DOM
-
2026-06-15days on market $145,000 Active 318 DOM
-
2026-06-14days on market $145,000 Active 316 DOM
-
2026-06-10days on market $145,000 Active 313 DOM
-
2026-06-09days on market $145,000 Active 312 DOM
-
2026-06-08days on market $145,000 Active 311 DOM
-
2026-06-07days on market $145,000 Active 310 DOM
-
2026-06-03days on market $145,000 Active 306 DOM
-
2026-06-02days on market $145,000 Active 305 DOM
-
2026-06-01days on market $145,000 Active 304 DOM
-
2026-05-31days on market $145,000 Active 303 DOM
-
2026-05-30days on market $145,000 Active 302 DOM
-
2026-01-08price $145,000 378-char remark
Show marketing remark (378 chars)
This 4-bedroom, 1.5 bathroom home offers 1,392 square feet of comfortable living space and is full of character and potential. Step inside to find beautiful hand-sawn wood floors that embraces that cottage charm. The kitchen and bathroom have been thoughtfully updated blending modern touches with classic appeal. Don't miss your opportunity to make this home shine as your own.
-
2025-08-02$152,000 Active 378-char remark
Show marketing remark (378 chars)
This 4-bedroom, 1.5 bathroom home offers 1,392 square feet of comfortable living space and is full of character and potential. Step inside to find beautiful hand-sawn wood floors that embraces that cottage charm. The kitchen and bathroom have been thoughtfully updated blending modern touches with classic appeal. Don't miss your opportunity to make this home shine as your own.
-
2011-10-21soldstatus
-
2006-02-21soldstatus
ⓘ Source: listings_history table (triggers on properties + properties_extension) + one-shot
backfill from property_details.listing_events for pre-trigger history.
Tax reassessment forecast TX · Resets to sale price
- Current annual tax
- $2,433 · $203/mo
- Projected year-2 tax
- $2,654 · $221/mo
- Expected delta
- +$221/yr (+$18/mo · 9.1%)
ⓘ Screening estimate from a state-policy table — verify with the county assessor before closing.
Climate risk First Street
- Flood 9/10 Extreme FEMA zone X (shaded) · 98% chance over 30 yrs
- Wildfire 3/10 Moderate
- Heat 9/10 Extreme 7 d/yr ≥109°F today · 24 d/yr by 30 yrs out
- Wind 9/10 Extreme 99% chance of damaging wind over 30 yrs
- Air quality 2/10 Low 1 unhealthy d/yr today · 1 by 30 yrs out
Nearby sold comps map
Loading sold comps map…
Walkable amenities ~0.75 mi
Loading nearby amenities…
Taxation est. · year 1
- Rental income
- $17,600
- − Mortgage interest
- −$8,122
- − Property taxes
- −$2,433
- − Insurance
- −$1,522
- − Repairs & maintenance
- −$1,408
- − Management
- −$1,408
- − Depreciation
- −$4,218
- Taxable loss
- −$1,512
- Est. tax savings @ 24.0%
- +$363
- After-tax cash flow
- $1,187/yr
For passive investors: Depreciation is non-cash, so a rental often shows a tax loss while cash-flowing — sheltering income. Rental losses are passive: they offset passive income freely, and up to $25,000/yr can offset ordinary (W-2) income if you actively participate and your MAGI is under $100k (phasing out to $0 by $150k); unused losses carry forward. On sale, claimed depreciation is recaptured at up to 25%, and gains may owe capital-gains tax (a 1031 exchange can defer both). Figures are a year-1 estimate at your 24.0% rate — not tax advice; consult a CPA.
Schools (NCES district)
- District
- Bridge City ISD
- NCES district ID
- 4811310
- Math proficiency
- 41% ▼ -11.00%
- Reading proficiency
- 51% ▲ 1.00%
- Median HH income
- $60,817
- Composite
- 40.47/100
- National rank
- #3720
- State rank
- #224 of 826 in TX
Livability — Bridge City
- Score
- 72/100
- State rank
- #251
- US rank
- #5948
Category grades
Schools grade is shown separately in the Schools card above.
Census & demographics
- Census place
- Bridge City, TX
- County
- Orange County · 87,112 people
- City population
- 10,112
- Metro
- Beaumont-Port Arthur, TX
- Population (ZIP)
- 10,112
- Household income
- $92,004
- Rent vs Own
- Severe rent burden
- 214.0
Population outlook (Orange County) Hauer SSP2
- Today (2025)
- 88,065 people
- By 2030
- 89,591 · +1.7%
- By 2040
- 91,982 · +4.4%
- By 2050
- 93,023 · +5.6%
- By 2075
- 94,871 · +7.7%
- By 2100
- 88,155 · +0.1%
Race, ethnicity, and origin ACS 2023
- Neighborhood character
- Predominantly White (82%)
- Race & ethnicity
- White 82% Hispanic / Latino 14% Two or more races 12% Asian 2%
- Hispanic origin (detail)
- Mexican 12%
- Common ancestry
- Lithuanian 12% Slovak 3% Iranian 2%
- Foreign-born
- 3% · Canada
- Languages at home
- 89% English-only · Spanish 6% French/Haitian/Cajun 2% Russian/Polish/Slavic 1%
Political lean MEDSL · Orange
- 2024 margin
- Solid R (+66.8) · D 16.4% · R 83.1%
- 2008→2024 swing
- -19.6pp toward R · 2008: -47.1pp · 2024: -66.8pp
- All cycles
- 2024: R+66.8 2020: R+63.4 2016: R+61.9 2012: R+54.3 2008: R+47.1
Not yet ingested
- Civics
- —
Market trends
- HPI YoY
- ▼ -98.42%
- Current HPI
- 155.9874
- Rent YoY
- —
- Metro
- Beaumont-Port Arthur, TX
- State GDP YoY
- ▲ 3.95%
- F500 in state
- 110
Industry mix (Fortune 500 HQ in TX)
| Industry | F500 HQs | Revenue |
|---|---|---|
| Energy | 16 | $1,198B |
|
||
| Technology | 5 | $198B |
|
||
| Engineering / Construction | 4 | $72B |
|
||
| Energy Services | 3 | $60B |
|
||
| Utilities | 3 | $41B |
|
||
| Healthcare | 2 | $330B |
|
||
Price history
-4.6% since first listed4 events — show timeline
- 2026-01-08 Price Changed $145,000 BBOR
- 2025-08-02 Listed $152,000 BBOR
- 2011-10-21 Sold (Public Records) — Public Records
- 2006-02-21 Sold (Public Records) — Public Records
Property tax history
+15.0%/yrLatest (2025): $2,433 · +10.6% YoY. Source: county tax records.
Cash-flow waterfall
monthlySold comps — $/sqft
last 12 mo · ≤1 miLoading sold comps…