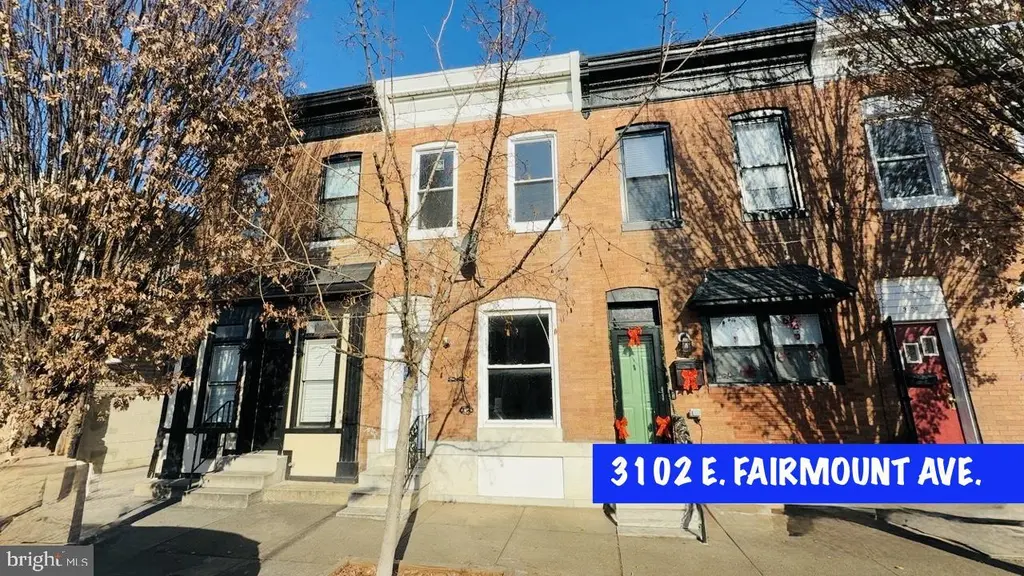
3102 E Fairmount Ave · Baltimore, MD
Flood risk 7/10 · Major
- FEMA flood zone
- X (unshaded)
- Chance of flooding over 30 yrs
- 0.76%
- Est. flood insurance / yr
- $473 – $860
Fire risk 1/10 · Minimal
- Est. fire insurance / yr
- $755 – $1,403
Heat risk 8/10 · Major
- Hot days now (above 103°F)
- 7 days/yr
- Hot days in 30 yrs
- 15 days/yr
Wind risk 6/10 · Moderate
- Chance of severe wind over 30 yrs
- 27.0%
Air-quality risk 4/10 · Minor
- Unhealthy air days now
- 6 days/yr
- Unhealthy air days in 30 yrs
- 7 days/yr
Risk factors via First Street. Map © Google.
Why this score? — see what drove the C+ grade
The composite is a weighted blend of 9 inputs, each scored 0–100. Each bar is that input's sub-score; the figure is the points it added to the 100-point composite (weight × sub-score).
- Cash flow +23.3/30.0
- ARV discount +15.0/15.0
- DSCR +7.5/10.0
- 1% rule +5.7/10.0
- Livability +3.8/5.0
- Rent growth +2.8/5.0
- Condition / age +2.5/5.0
- Schools +1.0/10.0
- Appreciation +0.0/10.0
$215,000
🖨 Deal sheet 📄 Offer letter ✓ Due diligence
Listing remarks MLS
3 bedrooms in neeed of updates, bring all offers. Strictly As-Is.
Key facts
- Built 1920
- Listed 96 days
Neighborhood map
What this means for you Summary
Snapshot
- This is a 3-bed/2.5-bath townhouse listed at $215k.
Deal economics
- At list price, monthly cash flow is $338 ($4k/yr) — positive.
- The deal already cash-flows at list — no discount required.
- Meets the 1% rule at list price ($2k rent vs $215k).
- Recommended offer: $196k (9.0% below list) — sets the bar for market timing.
- Cap rate 8.5% vs local median 6.0% in Baltimore — top-decile yield for the area; either an underpriced asset or a hidden risk that comps aren't pricing in. Stress-test before assuming the spread holds.
Location & tenants
- Location reads 76/100 on livability (#90 in MD, #3,396 nationally) — a middle-class / working-renter tenant base. Strengths: amenities A+, commute A+, housing A+; Watch: schools D, crime F.
- Baltimore City Public Schools (urban): math 7% / reading 16% proficiency, ranked #24 of 24 in MD (top 100%) — low school quality limits family demand, transient renter base, plan for 1-2y turnover; 79% free/reduced lunch — lower-income household profile, screen leases tightly.
- Market conditions: Rents rising (+1.3%/yr); 391 active listings in the ZIP; 40 comparable units currently listed for rent nearby; rentals at typical pace (median 24d on market — plan ~3-4 weeks tenant-placement turnaround); solid renter incomes; 1,273 units permitted in Baltimore city in 2024 (1,104 in 5+ unit buildings).
- This rent runs 31% of the median local income ($89k/yr) — at the standard rent-burdened threshold; future hikes will face affordability resistance.
Forward outlook
- Local home prices are declining (-3.0%/yr); year-one equity from $1k of loan paydown is wiped out by about $6k of value loss. Plan a longer hold.
- Baltimore County population projected to shrink 4% by 2050 — rents likely to lag national; underwrite the cash flow, not the appreciation.
Negotiation context
- It's been on market 96 days — a 9% lower offer ($196k) is reasonable based on typical stale-listing flexibility.
- 7 sale attempts since 29y ago; this cycle's ask has dropped $15k (7%) from the opening price — seller is motivated, your offer sets the floor, not the list.
Risks & watch-outs
- Watch-outs: flood insurance adds $56/mo; built in 1920 — expect roof / HVAC / electrical / plumbing capex.
- Climate carrying-cost: major flood risk; major wind risk, 27% chance of damaging wind over 30y; extreme-heat days projected 7→15/yr by 2055 (HVAC capex compounding) — expect insurance premiums to compound above CPI over the hold.
Questions for the listing agent
- It's been on market 96 days. Have you received any prior offers? Is the seller open to a 9% concession, seller financing, or rate buy-down credit?
- Built in 1920 — when were the roof, HVAC, electrical panel, plumbing, and water heater last replaced?
- What's the actual annual flood-insurance premium (NFIP or private), and is the property in a SFHA with mandatory coverage?
- Why hasn't it sold? Are there any deal-killer items the seller is aware of (foundation, flood, title, zoning, code violations)?
- Is there a deadline driving the sale (1031 exchange, divorce, estate, relocation)? That informs how much negotiation room exists.
- Schools are D-rated, which usually means shorter tenancies and higher turnover. Who's the typical renter profile here, and what's been the actual vacancy rate?
- Crime grade is F in this area — have there been break-ins, vandalism, or insurance claims at this property in the last 3 years? What carrier currently insures it and at what premium?
- What's the average days-on-market for RENTAL listings here right now (not sales)? A rising rental-DOM trend means longer vacancies and softer asking-rent achievability than the comps imply.
- What's the recent tenant-quality profile in this submarket — average credit score on applications, eviction rate, late-payment / NSF rate, and stable-employment percentage? A property-management company in the area should have these aggregated.
- How much new for-sale + rental construction is in the pipeline within 1–3 miles? Heavy new supply typically softens prices + rents 12–24 months out; constrained supply supports both.
Investment metrics
- 1% rule
- 1.07% ✓
- Cap rate
- 8.49%
- Cash-on-cash
- 7.85%
- DSCR
- 1.35
- GRM
- 7.8
CMA / ARV
- ARV (median comp)
- $296,547
- List price
- $215,000
- Delta
- -27.50%
- Verdict
- UNDERPRICED
- Comps
- 20 within 1.0 mi
Show comp detail 12 sales within ~0.75 mi
| Address | Dist | Beds/Ba | Sqft | Sold | Price | $/sf | Match |
|---|---|---|---|---|---|---|---|
| 38 S Curley St | 0.22mi | 3/1.0 | 1,729 (+0%) | 0mo | $181,100 | $105 | 83 |
| 2534 E Baltimore St | 0.43mi | 3/3.0 | 1,685 (-2%) | 0mo | $495,000 | $294 | 74 |
| 263 S East Ave | 0.34mi | 2/2.0 (-1) | 1,767 (+3%) | 0mo | $375,000 | $212 | 72 |
| 21 S Linwood Ave | 0.22mi | 3/2.5 | 1,912 (+11%) | 0mo | $490,000 | $256 | 71 |
| 234 S Highland Ave | 0.34mi | 3/3.5 | 1,848 (+7%) | 0mo | $417,500 | $226 | 67 |
| 118 S Eaton St | 0.43mi | 3/3.5 | 1,569 (-9%) | 1mo | $330,000 | $210 | 61 |
| 802 S Potomac St | 0.74mi | 3/3.0 | 1,755 (+2%) | 0mo | $435,000 | $248 | 60 |
| 730 S Decker Ave | 0.68mi | 4/3.5 (+1) | 1,740 (+1%) | 0mo | $564,900 | $325 | 57 |
| 616 S Belnord Ave | 0.67mi | 3/3.0 | 1,608 (-6%) | 1mo | $370,000 | $230 | 55 |
| 3702 Foster Ave | 0.72mi | 2/2.0 (-1) | 1,632 (-5%) | 1mo | $339,000 | $208 | 50 |
| 633 S Linwood Ave S | 0.64mi | 3/2.5 | 1,935 (+12%) | 0mo | $351,000 | $181 | 49 |
| 731 S Conkling St | 0.75mi | 4/3.5 (+1) | 1,836 (+7%) | 0mo | $480,000 | $261 | 44 |
Match score weights: distance 35% · size 25% · config 20% · recency 20%. Top-matched comps best support the ARV.
Projected returns pro-forma
-3.0% appreciation · 1.31% rent growth · sell at horizon
- IRR
- -7.8%
- Equity multiple
- 0.72×
- Total profit
- $-17,116
- Equity at exit
- $32,057
- IRR
- -0.6%
- Equity multiple
- 0.96×
- Total profit
- $-2,300
- Equity at exit
- $18,589
Cash invested: $60,200 (down + closing). Projections, not guarantees.
Landlord ↔ Tenant lean methodology
- Overall (CITY)
- 12 Strongly Tenant-Friendly
- State Maryland
- 27 Tenant-Leaning · D+14
- County
- — inherits STATE
- City Baltimore
- 12 Strongly Tenant-Friendly · D+58
ZIP-level market 21224
- Rents YoY
- 1.3%
- Active inventory
- 391
- Price-to-rent
- 7.8×
Monthly cashflow live
- Estimated rent
- $2,299 high interval (Pro) →
- Mortgage (P&I)
- −$1,127
- Tax from tax record
- −$206 /mo · $2,466/yr
- Insurance
- −$90
- Flood insurance flood zone
- −$56 /mo · $666/yr
- HOA
- −$0
- Vacancy / Maint / Mgmt
- −$483
- Net cashflow
- $338
Break-even live
UW: 25.0% down · 7.5% · 30yr · 1.5% tax · 5.0% vac · 8.0% maint · 8.0% mgmt
Financing live
Cash to close
- Down payment
- $53,750
- Closing costs
- $6,450
- Reserves months
- —
- Total cash needed
- —
Loan-product check · same deal, 3 products live
Conventional
25% down · 7.5% · 30yr
- Down + closing
- —
- Monthly P&I
- —
- Monthly cashflow
- —
- DSCR
- —
- Eligible?
- —
Personal DTI + credit; lowest rate.
DSCR
20% down · 8.5% · 30yr
- Down + closing
- —
- Monthly P&I
- —
- Monthly cashflow
- —
- DSCR
- —
- Eligible?
- —
No personal income docs; deal must DSCR.
Hard money
10% down · 12.0% · 12mo
- Down + closing
- —
- Monthly P&I
- —
- Monthly cashflow
- —
- DSCR
- —
- Eligible?
- —
Short-term bridge; refi at stabilization.
Rent comps 40 comps
| Address | Beds | Baths | Sqft | Rent | $/sqft | DOM | Units | Dist |
|---|---|---|---|---|---|---|---|---|
| 113 N Decker Ave Baltimore, MD | 3.0 | 3.5 | 1800 | $2,850 | $1.58 | 23d | 1 | 0.05mi |
| 29 N Ellwood Ave Baltimore, MD | 3.0 | 1.5 | 1100 | $2,395 | $2.18 | 23d | 1 | 0.06mi |
| 17 N East Ave Baltimore, MD | 2.0 | 2.0 | 1326 | $2,550 | $1.92 | 23d | 1 | 0.07mi |
| 10 N Ellwood Ave Baltimore, MD | 4.0 | 2.5 | 1768 | $2,500 | $1.41 | 43d | 1 | 0.09mi |
| 3212 E Baltimore St Baltimore, MD | 2.0 | 3.0 | 1931 | $2,350 | $1.22 | 23d | 1 | 0.11mi |
| 113 N Clinton St Baltimore, MD | 2.0 | 1.0 | 1300 | $1,995 | $1.53 | 43d | 1 | 0.12mi |
| 1 N Clinton St Baltimore, MD | 4.0 | 1.5 | 1200 | $1,700 | $1.42 | 20d | 1 | 0.15mi |
| 404 N Robinson St Baltimore, MD | 3.0 | 3.0 | 1320 | $2,200 | $1.67 | 23d | 1 | 0.15mi |
| 404 N Robinson St Baltimore, MD | 3.0 | 3.0 | 1320 | $2,100 | $1.59 | 16d | 1 | 0.15mi |
| 150 N Curley St Baltimore, MD | 2.0 | 2.5 | 1266 | $1,850 | $1.46 | 17d | 1 | 0.15mi |
| 3304 E Baltimore St Baltimore, MD | 3.0 | 1.5 | 1514 | $1,875 | $1.24 | 43d | 1 | 0.16mi |
| 34 N Linwood Ave Baltimore, MD | 2.0 | 1.5 | 1288 | $2,400 | $1.86 | 23d | 1 | 0.19mi |
| 11 N Streeper St Baltimore, MD | 3.0 | 3.5 | 1800 | $2,600 | $1.44 | 43d | 1 | 0.22mi |
| 106 S Bouldin St Baltimore, MD | 2.0 | 3.0 | 1134 | $2,100 | $1.85 | 20d | 1 | 0.22mi |
| 127 S Robinson St Baltimore, MD | 2.0 | 1.5 | 1400 | $2,000 | $1.43 | 43d | 1 | 0.23mi |
| 10 N Streeper St Baltimore, MD | 3.0 | 2.5 | 1440 | $2,500 | $1.74 | 23d | 1 | 0.24mi |
| 2815 Orleans St Baltimore, MD | 2.0 | 1.0 | 1204 | $1,600 | $1.33 | 2d | 1 | 0.24mi |
| 102 S Curley St Baltimore, MD | 2.0 | 1.5 | 1200 | $1,800 | $1.50 | 4d | 1 | 0.25mi |
| 2903 Jefferson St Baltimore, MD | 3.0 | 3.0 | 1609 | $1,850 | $1.15 | 43d | 1 | 0.25mi |
| 3430 E Baltimore St Baltimore, MD | 3.0 | 2.5 | 1316 | $2,250 | $1.71 | 23d | 1 | 0.26mi |
| 2800 Orleans St Baltimore, MD | 3.0 | 1.0 | 1404 | $1,600 | $1.14 | 14d | 1 | 0.27mi |
| 2800 Orleans St Baltimore, MD | 3.0 | 1.0 | 1404 | $1,600 | $1.14 | 17d | 1 | 0.27mi |
| 3436 Leverton Ave Baltimore, MD | 3.0 | 3.5 | 1500 | $2,350 | $1.57 | 23d | 1 | 0.30mi |
| 3304 McElderry St Baltimore, MD | 3.0 | 2.0 | 1413 | $1,900 | $1.34 | 43d | 1 | 0.31mi |
| 3502 E Lombard St Baltimore, MD | 3.0 | 2.0 | 1522 | $1,870 | $1.23 | 43d | 1 | 0.32mi |
| 139 N Lakewood Ave Unit 1 Baltimore, MD | 4.0 | 2.0 | 1370 | $2,500 | $1.82 | 43d | 1 | 0.32mi |
| 139 N Lakewood Ave Baltimore, MD | 4.0 | 2.5 | 1370 | $2,500 | $1.82 | 43d | 1 | 0.32mi |
| 249 S East Ave Baltimore, MD | 2.0 | 2.0 | 1680 | $2,250 | $1.34 | 23d | 1 | 0.35mi |
| 2619 E Fayette St Baltimore, MD | 3.0 | 2.0 | 1600 | $1,900 | $1.19 | 43d | 1 | 0.36mi |
| 127 N Glover St Baltimore, MD | 2.0 | 1.5 | 1110 | $2,100 | $1.89 | 2d | 1 | 0.36mi |
| 2934 E Monument St Baltimore, MD | 2.0 | 1.0 | 1200 | $1,499 | $1.25 | 43d | 1 | 0.39mi |
| 218 N Glover St Baltimore, MD | 2.0 | 2.0 | 1360 | $1,750 | $1.29 | 43d | 1 | 0.39mi |
| 531 N Belnord Ave Baltimore, MD | 2.0 | 1.5 | 1100 | $1,700 | $1.55 | 23d | 1 | 0.39mi |
| 235 S Highland Ave Baltimore, MD | 2.0 | 1.5 | 1222 | $2,000 | $1.64 | 23d | 1 | 0.39mi |
| 9 N Luzerne Ave Baltimore, MD | 3.0 | 2.5 | 1380 | $2,450 | $1.78 | 4d | 1 | 0.40mi |
| 415 N Glover St Baltimore, MD | 2.0 | 2.5 | 1092 | $1,600 | $1.47 | 23d | 1 | 0.40mi |
| 225 N Luzerne Ave Baltimore, MD | 3.0 | 1.0 | 1198 | $1,350 | $1.13 | 19d | 1 | 0.41mi |
| 233 N Luzerne Ave Baltimore, MD | 3.0 | 2.5 | 1700 | $2,250 | $1.32 | 21d | 1 | 0.41mi |
| 533 N Lakewood Ave Baltimore, MD | 4.0 | 3.5 | 1758 | $4,500 | $2.56 | 43d | 1 | 0.41mi |
| 537 N Lakewood Ave Baltimore, MD | 3.0 | 3.5 | 1755 | $2,050 | $1.17 | 43d | 1 | 0.42mi |
Listing history 35 events
-
2026-06-18days on market $215,000 Active 96 DOM
-
2026-06-17days on market $215,000 Active 95 DOM
-
2026-06-16days on market $215,000 Active 94 DOM
-
2026-06-15days on market $215,000 Active 93 DOM
-
2026-06-13days on market $215,000 Active 91 DOM
-
2026-06-09days on market $215,000 Active 87 DOM
-
2026-06-08days on market $215,000 Active 86 DOM
-
2026-06-07days on market $215,000 Active 85 DOM
-
2026-06-04days on market $215,000 Active 82 DOM
-
2026-06-03days on market $215,000 Active 81 DOM
-
2026-06-02days on market $215,000 Active 80 DOM
-
2026-06-01days on market $215,000 Active 79 DOM
-
2026-05-31days on market $215,000 Active 78 DOM
-
2026-05-13status Active
-
2026-05-03historical
-
2026-04-02status Active
-
2026-03-06historical Active Under Contract
-
2026-02-04$230,000 Active
-
2023-03-09soldstatus $3,580,000
-
2009-03-26soldstatus $49,000 Sold 65-char remark
Show marketing remark (65 chars)
3 bedrooms in neeed of updates, bring all offers. Strictly As-Is.
-
2009-03-12historical 65-char remark
Show marketing remark (65 chars)
3 bedrooms in neeed of updates, bring all offers. Strictly As-Is.
-
2009-02-26price $54,000 65-char remark
Show marketing remark (65 chars)
3 bedrooms in neeed of updates, bring all offers. Strictly As-Is.
-
2009-02-10status 65-char remark
Show marketing remark (65 chars)
3 bedrooms in neeed of updates, bring all offers. Strictly As-Is.
-
2008-12-09historical 65-char remark
Show marketing remark (65 chars)
3 bedrooms in neeed of updates, bring all offers. Strictly As-Is.
-
2008-11-14price $69,900 65-char remark
Show marketing remark (65 chars)
3 bedrooms in neeed of updates, bring all offers. Strictly As-Is.
-
2008-10-14price $78,000 65-char remark
Show marketing remark (65 chars)
3 bedrooms in neeed of updates, bring all offers. Strictly As-Is.
-
2008-09-11price $88,900 65-char remark
Show marketing remark (65 chars)
3 bedrooms in neeed of updates, bring all offers. Strictly As-Is.
-
2008-08-13$120,000 65-char remark
Show marketing remark (65 chars)
3 bedrooms in neeed of updates, bring all offers. Strictly As-Is.
-
2007-05-14soldstatus $270,000
-
2003-09-29soldstatus $60,000
-
2003-05-27soldstatus $60,000
-
2003-04-10historical
-
2003-03-19$64,900
-
1997-09-29historical
-
1997-08-05
ⓘ Source: listings_history table (triggers on properties + properties_extension) + one-shot
backfill from property_details.listing_events for pre-trigger history.
Tax reassessment forecast MD · Partial reset (capped growth)
- Current annual tax
- $2,466 · $206/mo
- Projected year-2 tax
- $2,466 · $206/mo
- Expected delta
- $0/yr ($0/mo · 0.0%)
ⓘ Screening estimate from a state-policy table — verify with the county assessor before closing.
Climate risk First Street
- Flood 7/10 Severe FEMA zone X (unshaded) · 76% chance over 30 yrs
- Wildfire 1/10 Low
- Heat 8/10 Severe 7 d/yr ≥103°F today · 15 d/yr by 30 yrs out
- Wind 6/10 Major 27% chance of damaging wind over 30 yrs
- Air quality 4/10 Moderate 6 unhealthy d/yr today · 7 by 30 yrs out
Nearby sold comps map
Loading sold comps map…
Walkable amenities ~0.75 mi
Loading nearby amenities…
Taxation est. · year 1
- Rental income
- $27,589
- − Mortgage interest
- −$12,043
- − Property taxes
- −$2,466
- − Insurance
- −$1,742
- − Repairs & maintenance
- −$2,207
- − Management
- −$2,207
- − Depreciation
- −$6,255
- Taxable income
- $669
- Est. tax owed @ 24.0%
- −$161
- After-tax cash flow
- $3,897/yr
For passive investors: Depreciation is non-cash, so a rental often shows a tax loss while cash-flowing — sheltering income. Rental losses are passive: they offset passive income freely, and up to $25,000/yr can offset ordinary (W-2) income if you actively participate and your MAGI is under $100k (phasing out to $0 by $150k); unused losses carry forward. On sale, claimed depreciation is recaptured at up to 25%, and gains may owe capital-gains tax (a 1031 exchange can defer both). Figures are a year-1 estimate at your 24.0% rate — not tax advice; consult a CPA.
Schools (NCES district)
- District
- Baltimore City Public Schools
- NCES district ID
- 2400090
- Math proficiency
- 7% ▼ -9.00%
- Reading proficiency
- 16% ▼ -5.00%
- Median HH income
- $42,108
- Composite
- 10.08/100
- National rank
- #9805
- State rank
- #24 of 24 in MD
Livability — Baltimore
- Score
- 76/100
- State rank
- #90
- US rank
- #3396
Category grades
Schools grade is shown separately in the Schools card above.
Census & demographics
- Census place
- Baltimore, MD
- County
- Baltimore City · 558,601 people
- City population
- 588,727
- Metro
- Baltimore-Columbia-Towson, MD
- Population (ZIP)
- 47,465
- Household income
- $89,017
- Rent vs Own
- Severe rent burden
- 1786.0
Population outlook (Baltimore County) Hauer SSP2
- Today (2025)
- 624,249 people
- By 2030
- 621,541 · -0.4%
- By 2040
- 609,756 · -2.3%
- By 2050
- 597,249 · -4.3%
- By 2075
- 552,236 · -11.5%
- By 2100
- 513,934 · -17.7%
Race, ethnicity, and origin ACS 2023
- Neighborhood character
- Diverse neighborhood (Simpson 0.62)
- Race & ethnicity
- White 55% Hispanic / Latino 21% Black 16% Two or more races 7% Asian 4%
- Hispanic origin (detail)
- Mexican 4% Puerto Rican 2% Dominican 1%
- Common ancestry
- Romanian 5% Lithuanian 2% Italian 1%
- Foreign-born
- 17% · Canada, China, Vietnam
- Languages at home
- 76% English-only · Spanish 18% Other Indo-European 2% Russian/Polish/Slavic 1%
Political lean MEDSL · Baltimore
- 2024 margin
- Solid D (+73.0) · D 85.2% · R 12.2% · Other 2.6%
- 2008→2024 swing
- -2.5pp toward R · 2008: 75.5pp · 2024: 73.0pp
- All cycles
- 2024: D+73.0 2020: D+76.6 2016: D+74.6 2012: D+76.4 2008: D+75.5
Not yet ingested
- Civics
- —
Market trends
- HPI YoY
- ▼ -332.23%
- Current HPI
- 241.284
- Rent YoY
- ▲ 1.31%
- Metro
- Baltimore-Columbia-Towson, MD
- State GDP YoY
- ▲ 2.97%
- F500 in state
- 12
Industry mix (Fortune 500 HQ in MD)
| Industry | F500 HQs | Revenue |
|---|---|---|
| Aerospace / Defense | 1 | $71B |
|
||
| Utilities | 1 | $25B |
|
||
| Hotels | 1 | $24B |
|
||
| Consumer Goods | 1 | $7B |
|
||
| Real Estate | 1 | $6B |
|
||
| Chemicals | 1 | $2B |
|
||
Price history
+254.4% since first listed22 events — show timeline
- 2026-05-13 Relisted — BRIGHT MLS
- 2026-05-03 Listing Removed — BRIGHT MLS
- 2026-04-02 Relisted — BRIGHT MLS
- 2026-03-06 Contingent — BRIGHT MLS
- 2026-02-04 Listed $230,000 BRIGHT MLS
- 2023-03-09 Sold (Public Records) $3,580,000 Public Records
- 2009-03-26 Sold (MLS) $49,000 MRIS
- 2009-03-12 Delisted — MRIS
- 2009-02-26 Price Changed $54,000 MRIS
- 2009-02-10 Relisted — MRIS
- 2008-12-09 Delisted — MRIS
- 2008-11-14 Price Changed $69,900 MRIS
- 2008-10-14 Price Changed $78,000 MRIS
- 2008-09-11 Price Changed $88,900 MRIS
- 2008-08-13 Listed $120,000 MRIS
- 2007-05-14 Sold (Public Records) $270,000 Public Records
- 2003-09-29 Sold (Public Records) $60,000 Public Records
- 2003-05-27 Sold (MLS) $60,000 MRIS
- 2003-04-10 Delisted — MRIS
- 2003-03-19 Listed $64,900 MRIS
- 1997-09-29 Delisted — MRIS
- 1997-08-05 Listed — MRIS
Property tax history
-3.9%/yrLatest (2025): $2,466 · -18.7% YoY. Source: county tax records.
Cash-flow waterfall
monthlySold comps — $/sqft
last 12 mo · ≤1 miLoading sold comps…