 Fourplex
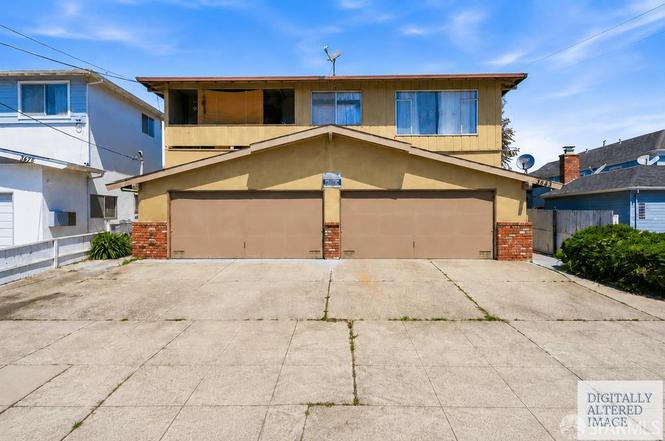
3683 Maybelle Ave · Oakland, CA
Flood risk 3/10 · Minor
- FEMA flood zone
- X (unshaded)
- Chance of flooding over 30 yrs
- 0.2%
- Est. flood insurance / yr
- $507 – $1,088
Fire risk 2/10 · Minimal
- Est. fire insurance / yr
- $659 – $1,223
Heat risk 3/10 · Minor
- Hot days now (above 84°F)
- 7 days/yr
- Hot days in 30 yrs
- 15 days/yr
Wind risk 1/10 · Minimal
- Chance of severe wind over 30 yrs
- —
Air-quality risk 8/10 · Major
- Unhealthy air days now
- 14 days/yr
- Unhealthy air days in 30 yrs
- 14 days/yr
Risk factors via First Street. Map © Google.
Why this score? — see what drove the C+ grade
The composite is a weighted blend of 9 inputs, each scored 0–100. Each bar is that input's sub-score; the figure is the points it added to the 100-point composite (weight × sub-score).
- Cash flow +27.0/30.0
- DSCR +9.3/10.0
- 1% rule +7.6/10.0
- ARV discount +7.3/15.0
- Livability +3.6/5.0
- Schools +3.0/10.0
- Rent growth +2.5/5.0
- Condition / age +2.5/5.0
- Appreciation +0.0/10.0
$849,000
🖨 Deal sheet 📄 Offer letter ✓ Due diligence
Multi-family units
County records classify this as Multi-Family (2-4 Unit). Listing-text estimate: 4 units. confirmed
Listing remarks
3683 Maybelle Ave presents a compelling opportunity to acquire a well-located 4-unit residential income property in Oakland's established Laurel District area. According to public records, the property consists of a 1966-built fourplex totaling approximately 4,188 sq ft and featuring an attractive unit mix of three 2BR/1BA units and one 3BR/1BA unit. The generous unit sizes may be larger than many competing multifamily properties in the area and have historically supported stable long-term occupancy. The property has been owned by the same family for many years and most units remain in largely original condition, creating future value-add potential through modernization as units eventually
Key facts
- Easy access to parks
- 5,301 sq ft lot
- 4 garage spots
Tags
Property features AI
Finance
- Financial info: Four rental units total; four units currently leased; Four units rented month-to-month; Occupied mix: three 2-bedroom units and one 3-bedroom unit; Four independent parking/guest spaces
- HOA & community: No association fee
Exterior
- Parking: Garage parking; Four garage/parking spaces
- Utilities: City utilities; Public water; Public sewer (sewer connected)
- Home design: Residential income property (quadruplex); Contemporary style; Two levels; Entry level information not provided; Facing direction not provided
- Construction: Built in 1966; Wood construction; Composition roof; Concrete perimeter foundation
- Exterior features: Regular-shaped lot
Interior
- Bedrooms: Nine bedrooms total; Units configured as Apartments (four units: A, B, B, D)
- Heating & cooling: Wall furnaces; No cooling
- Interior features: Wall furnace heating; No central air conditioning
- Laundry & utility: Coin-operated common laundry
Neighborhood map
What this means for you Summary
Snapshot
- This is a 3×2.0bd/1.0ba + 1×3.0bd/1.0ba units multifamily listed at $849k.
Deal economics
- At list price, monthly cash flow is $2k ($28k/yr) — positive. Per door: $591/mo.
- The deal already cash-flows at list — no discount required.
- Meets the 1% rule at list price ($11k rent vs $849k).
- Cap rate 9.6% vs local median 2.4% in Oakland — top-decile yield for the area; either an underpriced asset or a hidden risk that comps aren't pricing in. Stress-test before assuming the spread holds.
Location & tenants
- Location reads 71/100 on livability (#224 in CA) — a middle-class / working-renter tenant base. Strengths: amenities A+, commute A+, employment A+; Watch: schools C-, crime F, cost of living F.
- Oakland Unified (urban): math 27% / reading 33% proficiency, ranked #1,007 of 1,400 in CA (top 72%) — families likely to look elsewhere, expect single-tenant / working-renter base with shorter leases; 68% free/reduced lunch — lower-income household profile, screen leases tightly.
- Market conditions: 90 active listings in the ZIP; high-income renter base; 1,742 units permitted in Alameda County in 2024 (856 in 5+ unit buildings).
- At $10,700/mo this rent would consume 99% of the median local household income ($130k/yr) (locally 1071% of renters already pay >50% of income on rent) — very limited rent-growth headroom before tenants either downsize or default.
Forward outlook
- Local home prices are declining (-3.0%/yr); year-one equity from $6k of loan paydown is wiped out by about $25k of value loss. Plan a longer hold.
- Alameda County population projected at +34% by 2050 — long-run rental-demand tailwind backs the buy-and-hold thesis.
- At projected returns (-3.0% appreciation + 3.0% rent growth), your $238k cash investment doubles in ~10 years — after that, you're playing with house money.
Negotiation context
- Only 7 days on market — expect competitive offers; lowballing is unlikely to land.
- Current owner paid $250k; list at $849k implies a 240% gain — meaningful room to come down on a strong offer.
Questions for the listing agent
- Can we see the unit-by-unit rent roll, current vacancy, and any below-market leases? What's the average tenancy length?
- What capital expenditures (roof, boiler, parking lot, exteriors) have been made in the last 5 years, and what's planned in the next 2?
- Built in 1966 — when were the roof, HVAC, electrical panel, plumbing, and water heater last replaced?
- Is there a deadline driving the sale (1031 exchange, divorce, estate, relocation)? That informs how much negotiation room exists.
- Crime grade is F in this area — have there been break-ins, vandalism, or insurance claims at this property in the last 3 years? What carrier currently insures it and at what premium?
- What's the average days-on-market for RENTAL listings here right now (not sales)? A rising rental-DOM trend means longer vacancies and softer asking-rent achievability than the comps imply.
- What's the recent tenant-quality profile in this submarket — average credit score on applications, eviction rate, late-payment / NSF rate, and stable-employment percentage? A property-management company in the area should have these aggregated.
- How much new apartment / multifamily construction is in the pipeline within 1–3 miles? Heavy new supply (>2% of stock underway) typically softens rents 12–24 months out; light construction supports rent growth.
Investment metrics
- 1% rule
- 1.26% ✓
- Cap rate
- 9.63%
- Cash-on-cash
- 11.94%
- DSCR
- 1.53
- GRM
- 6.6
CMA / ARV
- ARV (on-the-fly)
- $845,976
- Comps found
- 3
Show comp detail 3 sales within ~0.75 mi
| Address | Dist | Beds/Ba | Sqft | Sold | Price | $/sf | Match |
|---|---|---|---|---|---|---|---|
| 3639 Patterson Ave | 0.22mi | 9/5.0 (+1) | 4,010 (-4%) | 7mo | $950,000 | $237 | 68 |
| 3619 Brown Ave | 0.28mi | 9/5.0 (+1) | 3,722 (-11%) | 20mo | $750,000 | $202 | 43 |
| 3360 Suter St | 0.66mi | 9/4.0 (+1) | 3,677 (-12%) | 16mo | $660,000 | $179 | 30 |
Match score weights: distance 35% · size 25% · config 20% · recency 20%. Top-matched comps best support the ARV.
Projected returns pro-forma
-3.0% appreciation · 3.0% rent growth · sell at horizon
- IRR
- 1.5%
- Equity multiple
- 1.06×
- Total profit
- $13,309
- Equity at exit
- $126,589
- IRR
- 11.1%
- Equity multiple
- 1.87×
- Total profit
- $206,702
- Equity at exit
- $73,406
Cash invested: $237,720 (down + closing). Projections, not guarantees.
Landlord ↔ Tenant lean methodology
- Overall (CITY)
- 0 Strongly Tenant-Friendly
- State California
- 18 Strongly Tenant-Friendly · D+13
- County
- — inherits STATE
- City Oakland
- 0 Strongly Tenant-Friendly · D+62
ZIP-level market 94619
- Active inventory
- 90
- Price-to-rent
- 27.0×
Monthly cashflow live
- Estimated rent
- $10,700 high interval (Pro) →
- Mortgage (P&I)
- −$4,452
- Tax from tax record
- −$1,283 /mo · $15,392/yr
- Insurance
- −$354
- HOA
- −$0
- Vacancy / Maint / Mgmt
- −$2,247
- Net cashflow
- $2,364
Break-even live
4-unit breakdown (identical units grouped — click to expand)
| Units | Beds | Baths | Est. rent |
|---|---|---|---|
| 3× units | 2.0 | 1 | $7,866 |
| #1 | 2.0 | 1 | $2,622 |
| #2 | 2.0 | 1 | $2,622 |
| #3 | 2.0 | 1 | $2,622 |
| 1× unit | 3.0 | 1 | $2,834 |
| Total (4 units) | $10,700 | ||
UW: 25.0% down · 7.5% · 30yr · 1.5% tax · 5.0% vac · 8.0% maint · 8.0% mgmt
Financing live
Cash to close
- Down payment
- $212,250
- Closing costs
- $25,470
- Reserves months
- —
- Total cash needed
- —
Loan-product check · same deal, 3 products live
Conventional
25% down · 7.5% · 30yr
- Down + closing
- —
- Monthly P&I
- —
- Monthly cashflow
- —
- DSCR
- —
- Eligible?
- —
Personal DTI + credit; lowest rate.
DSCR
20% down · 8.5% · 30yr
- Down + closing
- —
- Monthly P&I
- —
- Monthly cashflow
- —
- DSCR
- —
- Eligible?
- —
No personal income docs; deal must DSCR.
Hard money
10% down · 12.0% · 12mo
- Down + closing
- —
- Monthly P&I
- —
- Monthly cashflow
- —
- DSCR
- —
- Eligible?
- —
Short-term bridge; refi at stabilization.
Listing history 7 events
-
2026-06-18days on market $849,000 Active 7 DOM
-
2026-06-17days on market $849,000 Active 6 DOM
-
2026-06-16days on market $849,000 Active 5 DOM
-
2026-06-15days on market $849,000 Active 4 DOM
-
2026-06-13days on market $849,000 Active 2 DOM
-
2026-06-13remarks 699-char remark
-
2026-06-13$849,000 Active 1 DOM
ⓘ Source: listings_history table (triggers on properties + properties_extension) + one-shot
backfill from property_details.listing_events for pre-trigger history.
Tax reassessment forecast CA · Resets to sale price
- Current annual tax
- $15,392 · $1,283/mo
- Projected year-2 tax
- $15,392 · $1,283/mo
- Expected delta
- $0/yr ($0/mo · 0.0%)
ⓘ Screening estimate from a state-policy table — verify with the county assessor before closing.
Climate risk First Street
- Flood 3/10 Moderate FEMA zone X (unshaded) · 20% chance over 30 yrs
- Wildfire 2/10 Low
- Heat 3/10 Moderate 7 d/yr ≥84°F today · 15 d/yr by 30 yrs out
- Wind 1/10 Low
- Air quality 8/10 Severe 14 unhealthy d/yr today · 14 by 30 yrs out
Nearby sold comps map
Loading sold comps map…
Walkable amenities ~0.75 mi
Loading nearby amenities…
Taxation est. · year 1
- Rental income
- $128,400
- − Mortgage interest
- −$47,557
- − Property taxes
- −$15,392
- − Insurance
- −$4,245
- − Repairs & maintenance
- −$10,272
- − Management
- −$10,272
- − Depreciation
- −$24,698
- Taxable income
- $15,964
- Est. tax owed @ 24.0%
- −$3,831
- After-tax cash flow
- $24,541/yr
For passive investors: Depreciation is non-cash, so a rental often shows a tax loss while cash-flowing — sheltering income. Rental losses are passive: they offset passive income freely, and up to $25,000/yr can offset ordinary (W-2) income if you actively participate and your MAGI is under $100k (phasing out to $0 by $150k); unused losses carry forward. On sale, claimed depreciation is recaptured at up to 25%, and gains may owe capital-gains tax (a 1031 exchange can defer both). Figures are a year-1 estimate at your 24.0% rate — not tax advice; consult a CPA.
Schools (NCES district)
- District
- Oakland Unified
- NCES district ID
- 0628050
- Math proficiency
- 27% ▬ 0.00%
- Reading proficiency
- 33% ▬ 0.00%
- Median HH income
- $55,194
- Composite
- 29.52/100
- National rank
- #11769
- State rank
- #1007 of 1400 in CA
Livability — Oakland
- Score
- 71/100
- State rank
- #224
- US rank
- #7245
Category grades
Schools grade is shown separately in the Schools card above.
Census & demographics
- Census place
- Oakland, CA
- County
- Alameda County · 1,614,355 people
- City population
- 385,993
- Metro
- San Francisco-Oakland-Berkeley, CA
- Population (ZIP)
- 26,831
- Household income
- $129,867
- Rent vs Own
- Severe rent burden
- 1071.0
Population outlook (Alameda County) Hauer SSP2
- Today (2025)
- 1,928,884 people
- By 2030
- 2,069,146 · +7.3%
- By 2040
- 2,338,405 · +21.2%
- By 2050
- 2,586,608 · +34.1%
- By 2075
- 3,061,911 · +58.7%
- By 2100
- 3,234,133 · +67.7%
Race, ethnicity, and origin ACS 2023
- Neighborhood character
- Highly diverse neighborhood (Simpson 0.78)
- Race & ethnicity
- White 32% Hispanic / Latino 23% Black 19% Asian 17% Two or more races 14% Native American 1%
- Hispanic origin (detail)
- Mexican 11%
- Common ancestry
- Italian 2% Lithuanian 2% Portuguese 2%
- Foreign-born
- 21% · Canada, China, Vietnam
- Languages at home
- 67% English-only · Spanish 14% Chinese 8% Other Indo-European 2%
Political lean MEDSL · Alameda
- 2024 margin
- Solid D (+53.6) · D 74.6% · R 21.0% · Other 4.4%
- 2008→2024 swing
- -5.9pp toward R · 2008: 59.5pp · 2024: 53.6pp
- All cycles
- 2024: D+53.6 2020: D+62.5 2016: D+64.4 2012: D+59.8 2008: D+59.5
Not yet ingested
- Civics
- —
Market trends
- HPI YoY
- ▼ -835.69%
- Current HPI
- 259.7097
- Rent YoY
- —
- Metro
- San Francisco-Oakland-Berkeley, CA
- State GDP YoY
- ▲ 3.21%
- F500 in state
- 116
Industry mix (Fortune 500 HQ in CA)
| Industry | F500 HQs | Revenue |
|---|---|---|
| Technology | 27 | $1,492B |
|
||
| Financial Services | 3 | $174B |
|
||
| Retail | 3 | $44B |
|
||
| Insurance | 3 | $26B |
|
||
| Media / Entertainment | 2 | $115B |
|
||
| Pharmaceuticals / Biotech | 2 | $62B |
|
||
Price history
+239.6% since first listed2 events — show timeline
- 2026-06-11 Listed $849,000 San Francisco MLS
- 1986-06-10 Sold (Public Records) $250,000 Public Records
Property tax history
+5.2%/yrLatest (2025): $15,392 · +53.1% YoY. Source: county tax records.
Cash-flow waterfall
monthlySold comps — $/sqft
last 12 mo · ≤1 miLoading sold comps…