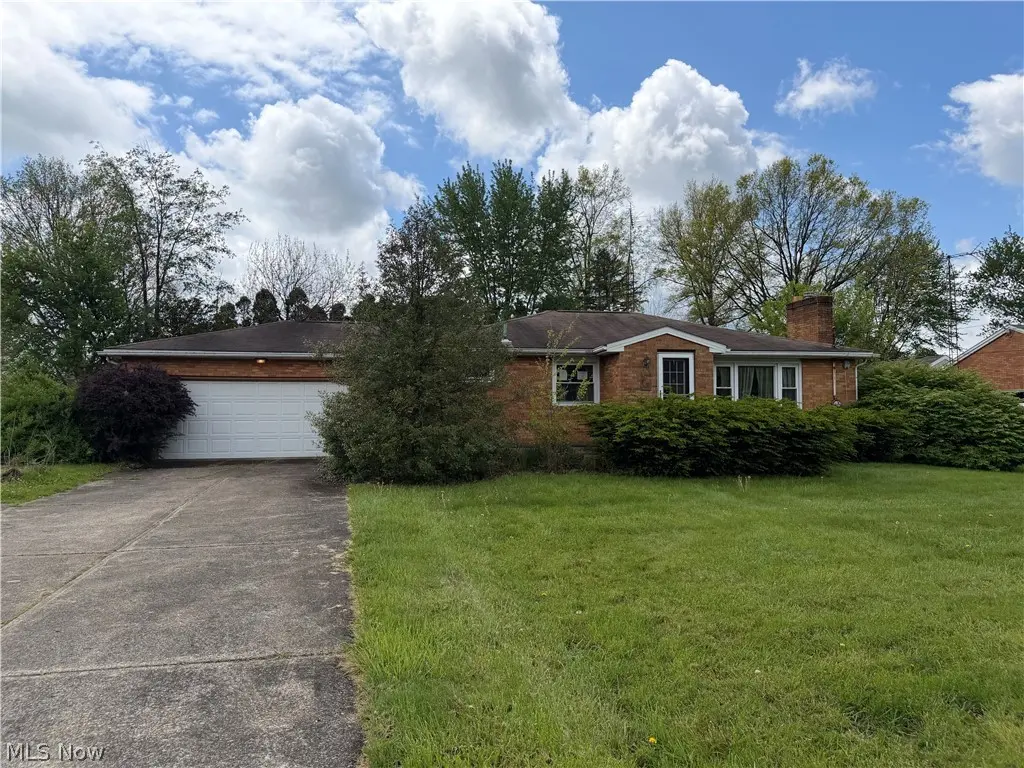
3858 Easton St NE · Canton, OH
Flood risk 1/10 · Minimal
- FEMA flood zone
- X (unshaded)
- Chance of flooding over 30 yrs
- 0.0%
- Est. flood insurance / yr
- $473 – $860
Fire risk 1/10 · Minimal
- Est. fire insurance / yr
- $713 – $1,323
Heat risk 3/10 · Minor
- Hot days now (above 96°F)
- 7 days/yr
- Hot days in 30 yrs
- 17 days/yr
Wind risk 1/10 · Minimal
- Chance of severe wind over 30 yrs
- 0.0%
Air-quality risk 2/10 · Minimal
- Unhealthy air days now
- 1 days/yr
- Unhealthy air days in 30 yrs
- 2 days/yr
Risk factors via First Street. Map © Google.
Why this score? — see what drove the B- grade
The composite is a weighted blend of 9 inputs, each scored 0–100. Each bar is that input's sub-score; the figure is the points it added to the 100-point composite (weight × sub-score).
- Cash flow +25.4/30.0
- ARV discount +15.0/15.0
- DSCR +8.4/10.0
- 1% rule +5.6/10.0
- Schools +5.5/10.0
- Livability +3.6/5.0
- Rent growth +2.5/5.0
- Condition / age +2.5/5.0
- Appreciation +0.0/10.0
$159,900
🖨 Deal sheet 📄 Offer letter ✓ Due diligence
Listing remarks MLS
Great Brick Ranch in this prime Plain location. Situated on just under 1/2 acres. This is going to be a great investment or first family home. Bring your design ideas and make it your own. Sold As Is.
Key facts
- 0.47 acre lot
- 2 garage spots
- Built 1960
Neighborhood map
What this means for you Summary
Snapshot
- This is a 3-bed/1.0-bath single-family listed at $160k.
Deal economics
- At list price, monthly cash flow is $370 ($4k/yr) — positive.
- The deal already cash-flows at list — no discount required.
- Meets the 1% rule at list price ($2k rent vs $160k).
- Recommended offer: $141k (12.0% below list) — sets the bar for market timing.
- Cap rate 9.1% vs local median 5.1% in Canton — top-decile yield for the area; either an underpriced asset or a hidden risk that comps aren't pricing in. Stress-test before assuming the spread holds.
Location & tenants
- Location reads 71/100 on livability (#441 in OH) — a middle-class / working-renter tenant base. Strengths: commute A+, cost of living A+, housing A; Watch: crime F, employment F.
- Plain Local (suburban): math 61% / reading 69% proficiency, ranked #216 of 656 in OH (top 33%) — acceptable for families but not a draw, mixed tenant base, ~2y average lease.
- Market conditions: 72 active listings in the ZIP; 1 comparable units currently listed for rent nearby; solid renter incomes; 528 units permitted in Stark County in 2024 (84 in 5+ unit buildings).
Forward outlook
- Local home prices are declining (-3.0%/yr); year-one equity from $1k of loan paydown is wiped out by about $5k of value loss. Plan a longer hold.
- Stark County population projected to shrink 8% by 2050 — rents likely to lag national; underwrite the cash flow, not the appreciation.
Negotiation context
- It's been on market 156 days — a 12% lower offer ($141k) is reasonable based on typical stale-listing flexibility.
Questions for the listing agent
- It's been on market 156 days. Have you received any prior offers? Is the seller open to a 12% concession, seller financing, or rate buy-down credit?
- Built in 1960 — when were the roof, HVAC, electrical panel, plumbing, and water heater last replaced?
- Why hasn't it sold? Are there any deal-killer items the seller is aware of (foundation, flood, title, zoning, code violations)?
- Is there a deadline driving the sale (1031 exchange, divorce, estate, relocation)? That informs how much negotiation room exists.
- Crime grade is F in this area — have there been break-ins, vandalism, or insurance claims at this property in the last 3 years? What carrier currently insures it and at what premium?
- What's the average days-on-market for RENTAL listings here right now (not sales)? A rising rental-DOM trend means longer vacancies and softer asking-rent achievability than the comps imply.
- What's the recent tenant-quality profile in this submarket — average credit score on applications, eviction rate, late-payment / NSF rate, and stable-employment percentage? A property-management company in the area should have these aggregated.
- How much new for-sale + rental construction is in the pipeline within 1–3 miles? Heavy new supply typically softens prices + rents 12–24 months out; constrained supply supports both.
Investment metrics
- 1% rule
- 1.06% ✓
- Cap rate
- 9.07%
- Cash-on-cash
- 9.91%
- DSCR
- 1.44
- GRM
- 7.9
CMA / ARV
- ARV (median comp)
- $260,781
- List price
- $159,900
- Delta
- -38.68%
- Verdict
- UNDERPRICED
- Comps
- 20 within 2.0 mi
Projected returns pro-forma
-3.0% appreciation · 3.0% rent growth · sell at horizon
- IRR
- -1.4%
- Equity multiple
- 0.95×
- Total profit
- $-2,421
- Equity at exit
- $23,842
- IRR
- 8.2%
- Equity multiple
- 1.62×
- Total profit
- $27,978
- Equity at exit
- $13,825
Cash invested: $44,772 (down + closing). Projections, not guarantees.
Landlord ↔ Tenant lean methodology
- Overall (STATE)
- 73 Landlord-Friendly
- State Ohio
- 73 Landlord-Friendly · R+6
- County
- — inherits STATE
- City
- — inherits STATE
ZIP-level market 44721
- Active inventory
- 72
- Price-to-rent
- 7.9×
Monthly cashflow live
- Estimated rent
- $1,695 medium interval (Pro) →
- Mortgage (P&I)
- −$839
- Tax from tax record
- −$64 /mo · $770/yr
- Insurance
- −$67
- HOA
- −$0
- Vacancy / Maint / Mgmt
- −$356
- Net cashflow
- $370
Break-even live
UW: 25.0% down · 7.5% · 30yr · 1.5% tax · 5.0% vac · 8.0% maint · 8.0% mgmt
Financing live
Cash to close
- Down payment
- $39,975
- Closing costs
- $4,797
- Reserves months
- —
- Total cash needed
- —
Loan-product check · same deal, 3 products live
Conventional
25% down · 7.5% · 30yr
- Down + closing
- —
- Monthly P&I
- —
- Monthly cashflow
- —
- DSCR
- —
- Eligible?
- —
Personal DTI + credit; lowest rate.
DSCR
20% down · 8.5% · 30yr
- Down + closing
- —
- Monthly P&I
- —
- Monthly cashflow
- —
- DSCR
- —
- Eligible?
- —
No personal income docs; deal must DSCR.
Hard money
10% down · 12.0% · 12mo
- Down + closing
- —
- Monthly P&I
- —
- Monthly cashflow
- —
- DSCR
- —
- Eligible?
- —
Short-term bridge; refi at stabilization.
Rent comps 1 comps
| Address | Beds | Baths | Sqft | Rent | $/sqft | DOM | Units | Dist |
|---|---|---|---|---|---|---|---|---|
| 6525 Blossomwood Cir NE Canton, OH | 2.0 | 1.5 | 1400 | $1,695 | $1.21 | 13d | 1 | 0.97mi |
Listing history 21 events
-
2026-06-18days on market $159,900 Active 156 DOM
-
2026-06-17days on market $159,900 Active 155 DOM
-
2026-06-16days on market $159,900 Active 154 DOM
-
2026-06-15days on market $159,900 Active 153 DOM
-
2026-06-14statusdays on market $159,900 Active 151 DOM
-
2026-06-13days on market $159,900 Contingent 150 DOM
-
2026-06-10days on market $159,900 Contingent 148 DOM
-
2026-06-09days on market $159,900 Contingent 147 DOM
-
2026-06-08days on market $159,900 Contingent 146 DOM
-
2026-06-07days on market $159,900 Contingent 145 DOM
-
2026-06-05days on market $159,900 Contingent 142 DOM
-
2026-06-03days on market $159,900 Contingent 141 DOM
-
2026-06-02days on market $159,900 Contingent 140 DOM
-
2026-06-01days on market $159,900 Contingent 139 DOM
-
2026-05-31days on market $159,900 Contingent 138 DOM
-
2026-05-30days on market $159,900 Contingent 137 DOM
-
2026-05-20historical Contingent 200-char remark
Show marketing remark (200 chars)
Great Brick Ranch in this prime Plain location. Situated on just under 1/2 acres. This is going to be a great investment or first family home. Bring your design ideas and make it your own. Sold As Is.
-
2026-05-11price $159,900 200-char remark
Show marketing remark (200 chars)
Great Brick Ranch in this prime Plain location. Situated on just under 1/2 acres. This is going to be a great investment or first family home. Bring your design ideas and make it your own. Sold As Is.
-
2026-03-10price $164,900 200-char remark
Show marketing remark (200 chars)
Great Brick Ranch in this prime Plain location. Situated on just under 1/2 acres. This is going to be a great investment or first family home. Bring your design ideas and make it your own. Sold As Is.
-
2026-02-04price $169,900 200-char remark
Show marketing remark (200 chars)
Great Brick Ranch in this prime Plain location. Situated on just under 1/2 acres. This is going to be a great investment or first family home. Bring your design ideas and make it your own. Sold As Is.
-
2026-01-12$179,900 Active 200-char remark
Show marketing remark (200 chars)
Great Brick Ranch in this prime Plain location. Situated on just under 1/2 acres. This is going to be a great investment or first family home. Bring your design ideas and make it your own. Sold As Is.
ⓘ Source: listings_history table (triggers on properties + properties_extension) + one-shot
backfill from property_details.listing_events for pre-trigger history.
Tax reassessment forecast OH · Partial reset (capped growth)
- Current annual tax
- $770 · $64/mo
- Projected year-2 tax
- $1,632 · $136/mo
- Expected delta
- +$862/yr (+$72/mo · 112.0%)
ⓘ Screening estimate from a state-policy table — verify with the county assessor before closing.
Climate risk First Street
- Flood 1/10 Low FEMA zone X (unshaded) · 0% chance over 30 yrs
- Wildfire 1/10 Low
- Heat 3/10 Moderate 7 d/yr ≥96°F today · 17 d/yr by 30 yrs out
- Wind 1/10 Low 0% chance of damaging wind over 30 yrs
- Air quality 2/10 Low 1 unhealthy d/yr today · 2 by 30 yrs out
Nearby sold comps map
Loading sold comps map…
Walkable amenities ~0.75 mi
Loading nearby amenities…
Taxation est. · year 1
- Rental income
- $20,340
- − Mortgage interest
- −$8,957
- − Property taxes
- −$770
- − Insurance
- −$800
- − Repairs & maintenance
- −$1,627
- − Management
- −$1,627
- − Depreciation
- −$4,652
- Taxable income
- $1,908
- Est. tax owed @ 24.0%
- −$458
- After-tax cash flow
- $3,979/yr
For passive investors: Depreciation is non-cash, so a rental often shows a tax loss while cash-flowing — sheltering income. Rental losses are passive: they offset passive income freely, and up to $25,000/yr can offset ordinary (W-2) income if you actively participate and your MAGI is under $100k (phasing out to $0 by $150k); unused losses carry forward. On sale, claimed depreciation is recaptured at up to 25%, and gains may owe capital-gains tax (a 1031 exchange can defer both). Figures are a year-1 estimate at your 24.0% rate — not tax advice; consult a CPA.
Schools (NCES district)
- District
- Plain Local
- NCES district ID
- 3904993
- Math proficiency
- 61% ▼ -13.00%
- Reading proficiency
- 69% ▼ -5.00%
- Median HH income
- $48,337
- Composite
- 55.04/100
- National rank
- #1293
- State rank
- #216 of 656 in OH
Livability — Canton
- Score
- 71/100
- State rank
- #441
- US rank
- #7259
Category grades
Schools grade is shown separately in the Schools card above.
Census & demographics
- County
- Stark · 366,688 people
- City population
- 103,614
- Metro
- Canton-Massillon, OH
- Population (ZIP)
- 13,722
- Household income
- $95,199
- Rent vs Own
- Severe rent burden
- 8.7
Population outlook (Stark County) Hauer SSP2
- Today (2025)
- 373,708 people
- By 2030
- 371,245 · -0.7%
- By 2040
- 361,331 · -3.3%
- By 2050
- 345,290 · -7.6%
- By 2075
- 302,669 · -19.0%
- By 2100
- 238,870 · -36.1%
Race, ethnicity, and origin ACS 2023
- Neighborhood character
- Predominantly White (88%)
- Race & ethnicity
- White 88% Two or more races 8% Hispanic / Latino 3% Black 2%
- Common ancestry
- Italian 3% Romanian 3% Lithuanian 3%
- Foreign-born
- 2%
- Languages at home
- 98% English-only · Other Indo-European 1%
Political lean MEDSL · Stark
- 2024 margin
- Strong R (+21.9) · D 38.6% · R 60.5%
- 2008→2024 swing
- -27.4pp toward R · 2008: 5.5pp · 2024: -21.9pp
- All cycles
- 2024: R+21.9 2020: R+18.5 2016: R+17.4 2012: R+0.4 2008: D+5.5
Not yet ingested
- Civics
- —
Market trends
- HPI YoY
- ▼ -147.35%
- Current HPI
- 226.5841
- Rent YoY
- —
- Metro
- —
- State GDP YoY
- ▲ 1.98%
- F500 in state
- 48
Industry mix (Fortune 500 HQ in OH)
| Industry | F500 HQs | Revenue |
|---|---|---|
| Insurance | 3 | $145B |
|
||
| Industrial Machinery | 3 | $49B |
|
||
| Financial Services | 3 | $24B |
|
||
| Consumer Goods | 2 | $93B |
|
||
| Aerospace / Defense | 2 | $47B |
|
||
| Utilities | 2 | $33B |
|
||
Price history
-11.1% since first listed5 events — show timeline
- 2026-05-20 Contingent — MLSNOW
- 2026-05-11 Price Changed $159,900 MLSNOW
- 2026-03-10 Price Changed $164,900 MLSNOW
- 2026-02-04 Price Changed $169,900 MLSNOW
- 2026-01-12 Listed $179,900 MLSNOW
Property tax history
-3.7%/yrLatest (2024): $770 · +189.7% YoY. Source: county tax records.
Cash-flow waterfall
monthlySold comps — $/sqft
last 12 mo · ≤1 miLoading sold comps…