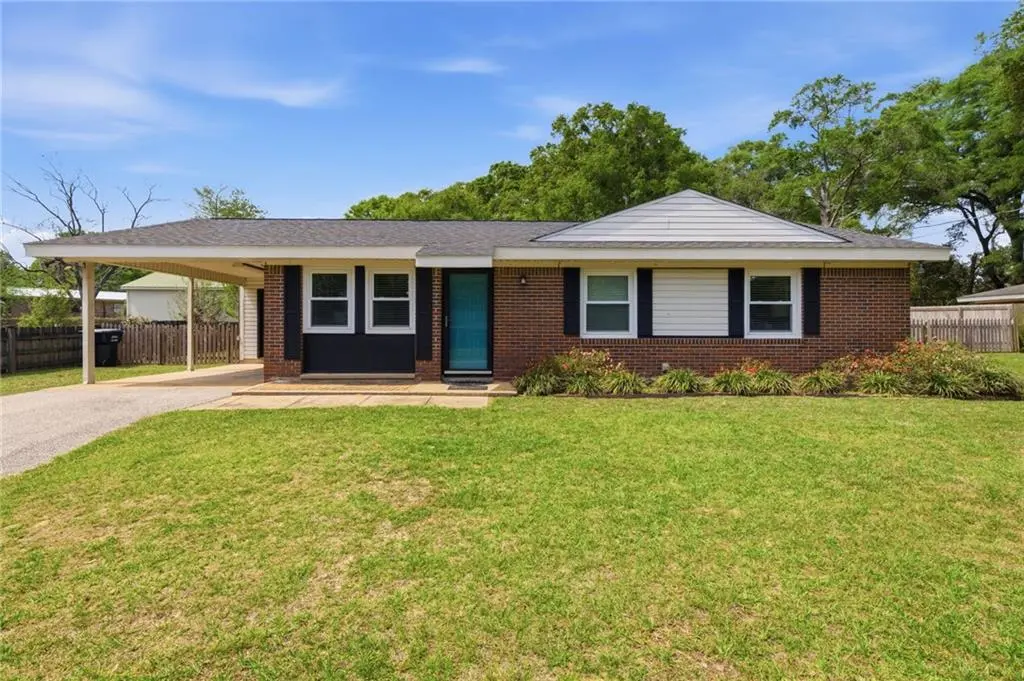
4320 Binghamton Dr · Tillmans Corner, AL
Flood risk 1/10 · Minimal
- FEMA flood zone
- X (unshaded)
- Chance of flooding over 30 yrs
- 0.0%
- Est. flood insurance / yr
- $507 – $1,088
Fire risk 4/10 · Minor
- Est. fire insurance / yr
- $916 – $1,700
Heat risk 9/10 · Severe
- Hot days now (above 105°F)
- 7 days/yr
- Hot days in 30 yrs
- 21 days/yr
Wind risk 9/10 · Severe
- Chance of severe wind over 30 yrs
- 99.0%
Air-quality risk 1/10 · Minimal
- Unhealthy air days now
- 0 days/yr
- Unhealthy air days in 30 yrs
- 0 days/yr
Risk factors via First Street. Map © Google.
Why this score? — see what drove the D- grade
The composite is a weighted blend of 9 inputs, each scored 0–100. Each bar is that input's sub-score; the figure is the points it added to the 100-point composite (weight × sub-score).
- Cash flow +15.7/30.0
- DSCR +4.8/10.0
- ARV discount +4.0/15.0
- Livability +3.1/5.0
- 1% rule +3.0/10.0
- Rent growth +2.5/5.0
- Condition / age +2.5/5.0
- Schools +2.3/10.0
- Appreciation +0.0/10.0
$170,000
🖨 Deal sheet 📄 Offer letter ✓ Due diligence
Listing remarks MLS
One time show and sell. Pride of ownership is evident with this well maintained cottage located minutes from the interstate. This delightful 3 bedroom, 2 bath home boasts of many updates. The roof was replaced in 2020. Outside and inside electrical panel was updated in 2020 and HVAC (inside and out) replaced in 2019. New flooring and water heater installed in 2021. Driveway was repaved in 2020. These are just a few of the updates that have been done. The spacious backyard is fenced with a covered back porch. Listing Agent makes no representation to accuracy of sq. ft. Buyer to verify. Any and all updates are per Seller.
Key facts
- 1 acre lot
- Parking
- Built 1964
Neighborhood map
What this means for you Summary
Snapshot
- This is a 3-bed/2.0-bath single-family listed at $170k.
Deal economics
- At list price, monthly cash flow is $75 ($906/yr) — positive.
- The deal already cash-flows at list — no discount required.
- To meet the 1% rule (rent ≥ 1% of price), the offer needs to be $136k (19.9% below list).
- Recommended offer: $136k (19.9% below list) — sets the bar for 1% rule.
- Cap rate 6.8% vs local median 5.0% in Tillmans Corner — top-decile yield for the area; either an underpriced asset or a hidden risk that comps aren't pricing in. Stress-test before assuming the spread holds.
Location & tenants
- Location reads 61/100 on livability (#260 in AL) — a middle-class / working-renter tenant base. Strengths: cost of living A+, housing A+; Watch: crime D+, amenities F, commute F.
- Mobile County (urban): math 15% / reading 39% proficiency, ranked #81 of 129 in AL (top 63%) — low school quality limits family demand, transient renter base, plan for 1-2y turnover; 67% free/reduced lunch — lower-income household profile, screen leases tightly.
- Zoned schools: Wc Griggs Elementary School (math 18% / reading 52%, grade F, #291 of 627 statewide, top 47%, 619 students, 77% FRL); Theodore High School (math 10% / reading 12%, grade F, #247 of 305 statewide, top 81%, 1,280 students, 60% FRL) — zoned schools at 68% FRL track the district average.
- Market conditions: 142 active listings in the ZIP; 3 comparable units currently listed for rent nearby; rentals leasing fast (median 14d on market — plan ~1-2 weeks tenant-placement turnaround); 1,678 units permitted in Mobile County in 2024 (264 in 5+ unit buildings).
Forward outlook
- Local home prices are declining (-3.0%/yr); year-one equity from $1k of loan paydown is wiped out by about $5k of value loss. Plan a longer hold.
- Mobile County population projected to shrink 8% by 2050 — rents likely to lag national; underwrite the cash flow, not the appreciation.
Negotiation context
- Only 4 days on market — expect competitive offers; lowballing is unlikely to land.
Risks & watch-outs
- Climate carrying-cost: severe wind risk, 99% chance of damaging wind over 30y; extreme-heat days projected 7→21/yr by 2055 (HVAC capex compounding) — expect insurance premiums to compound above CPI over the hold.
Questions for the listing agent
- Built in 1964 — when were the roof, HVAC, electrical panel, plumbing, and water heater last replaced?
- Is there a deadline driving the sale (1031 exchange, divorce, estate, relocation)? That informs how much negotiation room exists.
- Schools are F-rated, which usually means shorter tenancies and higher turnover. Who's the typical renter profile here, and what's been the actual vacancy rate?
- Crime grade is D in this area — have there been break-ins, vandalism, or insurance claims at this property in the last 3 years? What carrier currently insures it and at what premium?
- The area grade is low — what's the realistic commute time and amenity access for the typical tenant pool here? Any planned neighborhood developments (good or bad) we should know about?
- What's the average days-on-market for RENTAL listings here right now (not sales)? A rising rental-DOM trend means longer vacancies and softer asking-rent achievability than the comps imply.
- What's the recent tenant-quality profile in this submarket — average credit score on applications, eviction rate, late-payment / NSF rate, and stable-employment percentage? A property-management company in the area should have these aggregated.
- How much new for-sale + rental construction is in the pipeline within 1–3 miles? Heavy new supply typically softens prices + rents 12–24 months out; constrained supply supports both.
Investment metrics
- 1% rule
- 0.80% ✗
- Cap rate
- 6.83%
- Cash-on-cash
- 1.90%
- DSCR
- 1.08
- GRM
- 10.4
CMA / ARV
- ARV (on-the-fly)
- $157,824
- Comps found
- 5
Show comp detail 5 sales within ~0.75 mi
| Address | Dist | Beds/Ba | Sqft | Sold | Price | $/sf | Match |
|---|---|---|---|---|---|---|---|
| 4320 Binghamton Dr | 0.00mi | 3/2.0 | 1,200 (+4%) | 1mo | $173,000 | $144 | 92 |
| 5674 Nevius Rd | 0.30mi | 2/1.0 (-1) | 1,186 (+3%) | 3mo | $145,000 | $122 | 70 |
| 4291 Volta Dr | 0.04mi | 2/1.0 (-1) | 1,020 (-12%) | 15mo | $140,000 | $137 | 57 |
| 4465 Barden Ave | 0.21mi | 3/1.0 | 1,050 (-9%) | 17mo | $180,000 | $171 | 57 |
| 4759 Bush Ln | 0.64mi | 3/1.0 | 1,204 (+4%) | 18mo | $88,000 | $73 | 44 |
Match score weights: distance 35% · size 25% · config 20% · recency 20%. Top-matched comps best support the ARV.
Projected returns pro-forma
-3.0% appreciation · 3.0% rent growth · sell at horizon
- IRR
- -13.3%
- Equity multiple
- 0.52×
- Total profit
- $-22,828
- Equity at exit
- $25,348
- IRR
- -4.5%
- Equity multiple
- 0.70×
- Total profit
- $-14,043
- Equity at exit
- $14,698
Cash invested: $47,600 (down + closing). Projections, not guarantees.
Landlord ↔ Tenant lean methodology
- Overall (STATE)
- 90 Strongly Landlord-Friendly
- State Alabama
- 90 Strongly Landlord-Friendly · R+15
- County
- — inherits STATE
- City
- — inherits STATE
ZIP-level market 36619
- Home prices YoY
- -20.8%
- Active inventory
- 142
- Price-to-rent
- 10.4×
Monthly cashflow live
- Estimated rent
- $1,361 medium interval (Pro) →
- Mortgage (P&I)
- −$891
- Tax from tax record
- −$37 /mo · $449/yr
- Insurance
- −$71
- HOA
- −$0
- Vacancy / Maint / Mgmt
- −$286
- Net cashflow
- $75
Break-even live
UW: 25.0% down · 7.5% · 30yr · 1.5% tax · 5.0% vac · 8.0% maint · 8.0% mgmt
Financing live
Cash to close
- Down payment
- $42,500
- Closing costs
- $5,100
- Reserves months
- —
- Total cash needed
- —
Loan-product check · same deal, 3 products live
Conventional
25% down · 7.5% · 30yr
- Down + closing
- —
- Monthly P&I
- —
- Monthly cashflow
- —
- DSCR
- —
- Eligible?
- —
Personal DTI + credit; lowest rate.
DSCR
20% down · 8.5% · 30yr
- Down + closing
- —
- Monthly P&I
- —
- Monthly cashflow
- —
- DSCR
- —
- Eligible?
- —
No personal income docs; deal must DSCR.
Hard money
10% down · 12.0% · 12mo
- Down + closing
- —
- Monthly P&I
- —
- Monthly cashflow
- —
- DSCR
- —
- Eligible?
- —
Short-term bridge; refi at stabilization.
Rent comps 3 comps
| Address | Beds | Baths | Sqft | Rent | $/sqft | DOM | Units | Dist |
|---|---|---|---|---|---|---|---|---|
| 5920 Windy Hill Cir S Mobile, AL | 3.0 | 1.0 | 960 | $1,300 | $1.35 | 20d | 1 | 0.19mi |
| 6190 Girby Rd Mobile, AL | 1.0–3.0 | 1.0–2.0 | 1034 | $1,789 | $1.73 | 13d | 15 | 1.33mi |
| 4950 Government Blvd Mobile, AL | 1.0–4.0 | 1.0–2.5 | 1225 | $1,321 | $1.08 | 13d | 7 | 1.40mi |
Listing history 5 events
-
2026-04-06status Pending
-
2026-04-02$170,000 Active
-
2022-08-23soldstatus $149,900
-
2022-08-19soldstatus $149,900 627-char remark
Show marketing remark (627 chars)
One time show and sell. Pride of ownership is evident with this well maintained cottage located minutes from the interstate. This delightful 3 bedroom, 2 bath home boasts of many updates. The roof was replaced in 2020. Outside and inside electrical panel was updated in 2020 and HVAC (inside and out) replaced in 2019. New flooring and water heater installed in 2021. Driveway was repaved in 2020. These are just a few of the updates that have been done. The spacious backyard is fenced with a covered back porch. Listing Agent makes no representation to accuracy of sq. ft. Buyer to verify. Any and all updates are per Seller.
-
2006-09-13soldstatus $87,000
ⓘ Source: listings_history table (triggers on properties + properties_extension) + one-shot
backfill from property_details.listing_events for pre-trigger history.
Tax reassessment forecast AL · Resets to sale price
- Current annual tax
- $449 · $37/mo
- Projected year-2 tax
- $697 · $58/mo
- Expected delta
- +$248/yr (+$21/mo · 55.2%)
ⓘ Screening estimate from a state-policy table — verify with the county assessor before closing.
Climate risk First Street
- Flood 1/10 Low FEMA zone X (unshaded) · 0% chance over 30 yrs
- Wildfire 4/10 Moderate
- Heat 9/10 Extreme 7 d/yr ≥105°F today · 21 d/yr by 30 yrs out
- Wind 9/10 Extreme 99% chance of damaging wind over 30 yrs
- Air quality 1/10 Low 0 unhealthy d/yr today · 0 by 30 yrs out
Nearby sold comps map
Loading sold comps map…
Walkable amenities ~0.75 mi
Loading nearby amenities…
Taxation est. · year 1
- Rental income
- $16,332
- − Mortgage interest
- −$9,523
- − Property taxes
- −$449
- − Insurance
- −$850
- − Repairs & maintenance
- −$1,307
- − Management
- −$1,307
- − Depreciation
- −$4,945
- Taxable loss
- −$2,048
- Est. tax savings @ 24.0%
- +$492
- After-tax cash flow
- $1,397/yr
For passive investors: Depreciation is non-cash, so a rental often shows a tax loss while cash-flowing — sheltering income. Rental losses are passive: they offset passive income freely, and up to $25,000/yr can offset ordinary (W-2) income if you actively participate and your MAGI is under $100k (phasing out to $0 by $150k); unused losses carry forward. On sale, claimed depreciation is recaptured at up to 25%, and gains may owe capital-gains tax (a 1031 exchange can defer both). Figures are a year-1 estimate at your 24.0% rate — not tax advice; consult a CPA.
Schools (NCES district)
- District
- Mobile County
- NCES district ID
- 0102370
- Math proficiency
- 15% ▼ -28.00%
- Reading proficiency
- 39% ▬ 0.00%
- Median HH income
- $42,455
- Composite
- 22.9/100
- National rank
- #8002
- State rank
- #81 of 129 in AL
Livability — Tillmans Corner
- Score
- 61/100
- State rank
- #260
- US rank
- #18090
Category grades
Schools grade is shown separately in the Schools card above.
Census & demographics
- Census place
- Tillmans Corner, AL
- City population
- 14,550
- Population (ZIP)
- 14,550
Population outlook (Mobile County) Hauer SSP2
- Today (2025)
- 415,303 people
- By 2030
- 411,755 · -0.9%
- By 2040
- 399,670 · -3.8%
- By 2050
- 382,616 · -7.9%
- By 2075
- 337,353 · -18.8%
- By 2100
- 283,391 · -31.8%
Race, ethnicity, and origin ACS 2023
- Neighborhood character
- Predominantly White (74%)
- Race & ethnicity
- White 74% Black 11% Two or more races 6% Hispanic / Latino 6% Asian 6%
- Hispanic origin (detail)
- Mexican 2% Puerto Rican 2%
- Common ancestry
- Lithuanian 5% Romanian 1% Portuguese 1%
- Foreign-born
- 4% · Canada, Vietnam
- Languages at home
- 90% English-only · Vietnamese 5% Spanish 4% French/Haitian/Cajun 1%
Political lean MEDSL · Mobile
- 2024 margin
- R (+16.4) · D 41.3% · R 57.7%
- 2008→2024 swing
- -7.7pp toward R · 2008: -8.7pp · 2024: -16.4pp
- All cycles
- 2024: R+16.4 2020: R+11.9 2016: R+13.9 2012: R+9.3 2008: R+8.7
Not yet ingested
- Civics
- —
Market trends
- HPI YoY
- ▼ -51.67%
- Current HPI
- 197.1074
- Rent YoY
- —
- Metro
- —
- State GDP YoY
- ▲ 2.94%
- F500 in state
- 4
Industry mix (Fortune 500 HQ in AL)
| Industry | F500 HQs | Revenue |
|---|---|---|
| Financial Services | 1 | $8B |
|
||
| Healthcare | 1 | $5B |
|
||
Price history
+95.4% since first listed5 events — show timeline
- 2026-04-06 Pending — GCMLS AL
- 2026-04-02 Listed $170,000 GCMLS AL
- 2022-08-23 Sold (Public Records) $149,900 Public Records
- 2022-08-19 Sold (MLS) $149,900 GCMLS AL
- 2006-09-13 Sold (Public Records) $87,000 Public Records
Property tax history
+2.7%/yrLatest (2025): $449 · +6.4% YoY. Source: county tax records.
Cash-flow waterfall
monthlySold comps — $/sqft
last 12 mo · ≤1 miLoading sold comps…