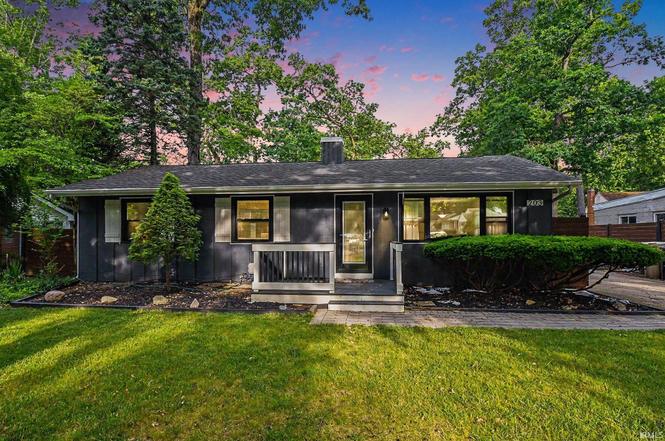
203 Wildemere Dr · South Bend, IN
Flood risk 1/10 · Minimal
- FEMA flood zone
- X (unshaded)
- Chance of flooding over 30 yrs
- 0.0%
- Est. flood insurance / yr
- $473 – $860
Fire risk 1/10 · Minimal
- Est. fire insurance / yr
- $717 – $1,331
Heat risk 2/10 · Minimal
- Hot days now (above 99°F)
- 7 days/yr
- Hot days in 30 yrs
- 15 days/yr
Wind risk 2/10 · Minimal
- Chance of severe wind over 30 yrs
- —
Air-quality risk 3/10 · Minor
- Unhealthy air days now
- 2 days/yr
- Unhealthy air days in 30 yrs
- 3 days/yr
Risk factors via First Street. Map © Google.
Why this score? — see what drove the F grade
The composite is a weighted blend of 9 inputs, each scored 0–100. Each bar is that input's sub-score; the figure is the points it added to the 100-point composite (weight × sub-score).
- Cash flow +7.1/30.0
- Rent growth +4.1/5.0
- Livability +3.2/5.0
- Condition / age +2.5/5.0
- Schools +1.4/10.0
- 1% rule +1.3/10.0
- DSCR +1.3/10.0
- ARV discount +0.0/15.0
- Appreciation +0.0/10.0
$269,900
🖨 Deal sheet 📄 Offer letter ✓ Due diligence
Listing remarks
Open House Saturday, June 20th from 1PM-3PM! Come check out this 3-bedroom, 2-bath ranch in Bercliff Estates, conveniently located near Bethel University! The updated kitchen features a farmhouse sink, stainless steel appliances, and a breakfast bar. The primary suite includes a private full bath and double doors leading to the deck. A spacious four-season sunroom with vaulted ceilings, exposed beams, and a gas fireplace adds additional living space and is the perfect spot to relax year-round. Exterior updates include vinyl siding and windows. Enjoy the fully fenced backyard with a tall privacy fence and large deck, ideal for entertaining, along with a detached 2-car garage and shed that pr
Key facts
- Farmhouse sink
- Updated kitchen
- Private full bath
Tags
Property features AI
Exterior
- Parking: Detached concrete off-street garage with 2 parking spaces
- Utilities: Public water; Public sewer; Electric service
- Home design: Single-family residence, site-built; One story; Level lot
- Construction: Vinyl siding; Asphalt shingle roof
- Exterior features: Deck; Privacy fencing (full fenced yard); Shed(s)
Interior
- Kitchen: Electric range; Microwave; Dishwasher; Refrigerator; Breakfast bar
- Bedrooms: Master located on the main level
- Flooring: Hardwood; Tile; Vinyl
- Bathrooms: Two full bathrooms (both on the main level)
- Heating & cooling: Natural gas forced-air heating; Central air conditioning
- Interior features: Vaulted ceilings; Beamed ceilings; Breakfast bar; Built-in features; Master bedroom on the main level; Full, partially finished basement; One fireplace with gas starter in the family room
- Laundry & utility: Washer and dryer included; Laundry in basement; Water softener (owned); Gas water heater
Neighborhood map
What this means for you Summary
Snapshot
- This is a 3-bed/2.0-bath single-family listed at $270k.
Deal economics
- At list price, monthly cash flow is $-388 ($-5k/yr) — negative.
- To cash-flow at today's rent, offer at most $201k (25.4% below list).
- To meet the 1% rule (rent ≥ 1% of price), the offer needs to be $170k (36.9% below list).
- Recommended offer: $170k (36.9% below list) — sets the bar for 1% rule.
Location & tenants
- Location reads 64/100 on livability (#365 in IN) — a middle-class / working-renter tenant base. Strengths: cost of living A+, housing A+, health & safety A+; Watch: amenities D, employment D, crime F.
- South Bend Community School Corporation (urban): math 12% / reading 21% proficiency, ranked #284 of 301 in IN (top 94%) — low school quality limits family demand, transient renter base, plan for 1-2y turnover; 66% free/reduced lunch — lower-income household profile, screen leases tightly.
- Zoned schools: Nuner Fine Arts Academy (math 8% / reading 12%, grade F, #921 of 994 statewide, top 94%, 479 students, 90% FRL); Jefferson Traditional School (math 12% / reading 22%, grade F, #284 of 330 statewide, top 87%, 516 students, 64% FRL); Adams High School (math 28% / reading 57%, grade F, #195 of 369 statewide, top 53%, 1,976 students, 56% FRL) — zoned schools at 70% FRL track the district average.
- Market conditions: Rents rising fast (+6.3%/yr); 73 active listings in the ZIP; 20 comparable units currently listed for rent nearby; rentals leasing fast (median 14d on market — plan ~1-2 weeks tenant-placement turnaround); 754 units permitted in St. Joseph County in 2024 (460 in 5+ unit buildings).
- This rent runs 32% of the median local income ($63k/yr) — at the standard rent-burdened threshold; future hikes will face affordability resistance.
Forward outlook
- Local home prices are declining (-3.0%/yr); year-one equity from $2k of loan paydown is wiped out by about $8k of value loss. Plan a longer hold.
Negotiation context
- Only 8 days on market — expect competitive offers; lowballing is unlikely to land.
Risks & watch-outs
- Watch-outs: built in 1954 — expect roof / HVAC / electrical / plumbing capex.
Questions for the listing agent
- What do current leases actually rent for vs. the listed asking? Can we see a recent rent roll and the last 12 months of T-12 income?
- Built in 1954 — when were the roof, HVAC, electrical panel, plumbing, and water heater last replaced?
- Is there a deadline driving the sale (1031 exchange, divorce, estate, relocation)? That informs how much negotiation room exists.
- Schools are F-rated, which usually means shorter tenancies and higher turnover. Who's the typical renter profile here, and what's been the actual vacancy rate?
- Crime grade is F in this area — have there been break-ins, vandalism, or insurance claims at this property in the last 3 years? What carrier currently insures it and at what premium?
- The area grade is low — what's the realistic commute time and amenity access for the typical tenant pool here? Any planned neighborhood developments (good or bad) we should know about?
- What's the average days-on-market for RENTAL listings here right now (not sales)? A rising rental-DOM trend means longer vacancies and softer asking-rent achievability than the comps imply.
- What's the recent tenant-quality profile in this submarket — average credit score on applications, eviction rate, late-payment / NSF rate, and stable-employment percentage? A property-management company in the area should have these aggregated.
- How much new for-sale + rental construction is in the pipeline within 1–3 miles? Heavy new supply typically softens prices + rents 12–24 months out; constrained supply supports both.
Investment metrics
- 1% rule
- 0.63% ✗
- Cap rate
- 4.57%
- Cash-on-cash
- -6.16%
- DSCR
- 0.73
- GRM
- 13.2
CMA / ARV
- ARV (on-the-fly)
- $223,744
- Comps found
- 12
Show comp detail 12 sales within ~0.75 mi
| Address | Dist | Beds/Ba | Sqft | Sold | Price | $/sf | Match |
|---|---|---|---|---|---|---|---|
| 317 Sylvan Glen Dr | 0.14mi | 3/2.0 | 1,440 (-2%) | 8mo | $245,000 | $170 | 83 |
| 403 Manchester Dr | 0.35mi | 3/1.5 | 1,330 (-10%) | 2mo | $205,000 | $154 | 64 |
| 3404 Brighton Pl | 0.52mi | 3/1.5 | 1,520 (+3%) | 6mo | $235,900 | $155 | 64 |
| 610 Manchester Dr | 0.43mi | 3/1.5 | 1,576 (+7%) | 3mo | $178,000 | $113 | 63 |
| 506 W Edgar Ave | 0.61mi | 3/2.0 | 1,456 (-1%) | 10mo | $230,000 | $158 | 62 |
| 222 N Tuxedo Dr | 0.70mi | 3/1.0 | 1,476 (+0%) | 5mo | $220,000 | $149 | 59 |
| 3239 Essex Dr | 0.32mi | 3/1.5 | 1,274 (-14%) | 3mo | $208,000 | $163 | 58 |
| 2521 Club Dr | 0.62mi | 3/1.5 | 1,542 (+5%) | 3mo | $233,500 | $151 | 58 |
| 3519 Sorin St | 0.47mi | 4/1.5 (+1) | 1,536 (+4%) | 8mo | $227,000 | $148 | 57 |
| 834 Woodcliff Dr | 0.67mi | 4/2.0 (+1) | 1,576 (+7%) | 1mo | $240,000 | $152 | 52 |
| 2425 Club Dr | 0.67mi | 3/1.5 | 1,540 (+5%) | 10mo | $168,000 | $109 | 51 |
| 910 W Lawrence St | 0.75mi | 3/1.5 | 1,652 (+12%) | 4mo | $225,000 | $136 | 40 |
Match score weights: distance 35% · size 25% · config 20% · recency 20%. Top-matched comps best support the ARV.
Projected returns pro-forma
-3.0% appreciation · 6.27% rent growth · sell at horizon
- IRR
- -23.7%
- Equity multiple
- 0.17×
- Total profit
- $-62,695
- Equity at exit
- $40,243
- IRR
- -12.1%
- Equity multiple
- 0.19×
- Total profit
- $-61,223
- Equity at exit
- $23,336
Cash invested: $75,572 (down + closing). Projections, not guarantees.
Landlord ↔ Tenant lean methodology
- Overall (STATE)
- 90 Strongly Landlord-Friendly
- State Indiana
- 90 Strongly Landlord-Friendly · R+11
- County
- — inherits STATE
- City
- — inherits STATE
ZIP-level market 46615
- Home prices YoY
- -34.0%
- Rents YoY
- 6.3%
- Active inventory
- 73
- Price-to-rent
- 13.2×
Monthly cashflow live
- Estimated rent
- $1,702 high interval (Pro) →
- Mortgage (P&I)
- −$1,415
- Tax from tax record
- −$205 /mo · $2,456/yr
- Insurance
- −$112
- HOA
- −$0
- Vacancy / Maint / Mgmt
- −$357
- Net cashflow
- $-388
Break-even live
UW: 25.0% down · 7.5% · 30yr · 1.5% tax · 5.0% vac · 8.0% maint · 8.0% mgmt
Financing live
Cash to close
- Down payment
- $67,475
- Closing costs
- $8,097
- Reserves months
- —
- Total cash needed
- —
Loan-product check · same deal, 3 products live
Conventional
25% down · 7.5% · 30yr
- Down + closing
- —
- Monthly P&I
- —
- Monthly cashflow
- —
- DSCR
- —
- Eligible?
- —
Personal DTI + credit; lowest rate.
DSCR
20% down · 8.5% · 30yr
- Down + closing
- —
- Monthly P&I
- —
- Monthly cashflow
- —
- DSCR
- —
- Eligible?
- —
No personal income docs; deal must DSCR.
Hard money
10% down · 12.0% · 12mo
- Down + closing
- —
- Monthly P&I
- —
- Monthly cashflow
- —
- DSCR
- —
- Eligible?
- —
Short-term bridge; refi at stabilization.
Rent comps 20 comps
| Address | Beds | Baths | Sqft | Rent | $/sqft | DOM | Units | Dist |
|---|---|---|---|---|---|---|---|---|
| 3001 E Jefferson Blvd South Bend, IN | 1.0–2.0 | 1.0–2.0 | 848 | $1,329 | $1.57 | 13d | 21 | 0.25mi |
| 300 Pin Oak Cir Mishawaka, IN | 1.0–3.0 | 1.0–1.5 | 835 | $1,225 | $1.47 | 13d | 1 | 0.59mi |
| 526 S 28th St South Bend, IN | 2.0 | 1.0 | 1000 | $1,350 | $1.35 | 13d | 1 | 0.65mi |
| 737 S 30th St South Bend, IN | 3.0 | 2.0 | 1000 | $1,600 | $1.60 | 43d | 1 | 0.74mi |
| 931 S 34th St South Bend, IN | 3.0 | 1.5 | 1656 | $1,550 | $0.94 | 43d | 1 | 0.92mi |
| 1160 Helmen Dr South Bend, IN | 3.0 | 2.0 | 1528 | $2,300 | $1.51 | 13d | 1 | 0.92mi |
| 754 S 23rd St South Bend, IN | 3.0 | 1.0 | 884 | $1,300 | $1.47 | 43d | 1 | 1.01mi |
| 819 S 24th St South Bend, IN | 3.0 | 2.0 | 1480 | $1,795 | $1.21 | 43d | 1 | 1.02mi |
| 209 E Edgar Ave Mishawaka, IN | 3.0 | 1.0 | 1400 | $1,400 | $1.00 | 13d | 1 | 1.09mi |
| 117 Palau Ave Mishawaka, IN | 3.0 | 1.0 | 1100 | $1,650 | $1.50 | 13d | 1 | 1.14mi |
| 3530 Northside Blvd South Bend, IN | 1.0–2.0 | 1.0 | 850 | $1,200 | $1.41 | 13d | 1 | 1.20mi |
| 116 W Mishawaka Ave Mishawaka, IN | 3.0 | 1.0–2.0 | 948 | $2,321 | $2.45 | 13d | 31 | 1.20mi |
| 303 Village Dr Mishawaka, IN | 1.0–3.0 | 1.0–1.5 | 918 | $1,975 | $2.15 | 13d | 25 | 1.32mi |
| 365 W Front St Mishawaka, IN | 2.0 | 1.0–2.0 | 825 | $3,050 | $3.70 | 13d | 1 | 1.32mi |
| 211 Columbia St Mishawaka, IN | 4.0 | 2.5 | 1500 | $1,795 | $1.20 | 21d | 1 | 1.33mi |
| 232 E Grove St Mishawaka, IN | 3.0 | 1.0 | 1188 | $1,500 | $1.26 | 13d | 1 | 1.35mi |
| 724 Northwood Dr South Bend, IN | 4.0 | 2.0 | 1594 | $2,600 | $1.63 | 43d | 1 | 1.35mi |
| 1106 S 20th St South Bend, IN | 1.0–3.0 | 1.0–2.0 | 885 | $1,200 | $1.36 | 13d | 1 | 1.36mi |
| 1824 Peachtree Ln South Bend, IN | 3.0 | 1.5 | 1852 | $2,700 | $1.46 | 21d | 1 | 1.40mi |
| 302 Village Dr Mishawaka, IN | 1.0–3.0 | 1.0–1.5 | 950 | $2,043 | $2.15 | 13d | 33 | 1.41mi |
Listing history 7 events
-
2026-06-18days on market $269,900 Active 8 DOM
-
2026-06-17days on market $269,900 Active 7 DOM
-
2026-06-16days on market $269,900 Active 6 DOM
-
2026-06-15days on market $269,900 Active 5 DOM
-
2026-06-14days on market $269,900 Active 3 DOM
-
2026-06-13remarks 699-char remark
-
2026-06-13$269,900 Active 2 DOM
ⓘ Source: listings_history table (triggers on properties + properties_extension) + one-shot
backfill from property_details.listing_events for pre-trigger history.
Tax reassessment forecast IN · Partial reset (capped growth)
- Current annual tax
- $2,456 · $205/mo
- Projected year-2 tax
- $2,456 · $205/mo
- Expected delta
- $0/yr ($0/mo · 0.0%)
ⓘ Screening estimate from a state-policy table — verify with the county assessor before closing.
Climate risk First Street
- Flood 1/10 Low FEMA zone X (unshaded) · 0% chance over 30 yrs
- Wildfire 1/10 Low
- Heat 2/10 Low 7 d/yr ≥99°F today · 15 d/yr by 30 yrs out
- Wind 2/10 Low
- Air quality 3/10 Moderate 2 unhealthy d/yr today · 3 by 30 yrs out
Nearby sold comps map
Loading sold comps map…
Walkable amenities ~0.75 mi
Loading nearby amenities…
Taxation est. · year 1
- Rental income
- $20,428
- − Mortgage interest
- −$15,119
- − Property taxes
- −$2,456
- − Insurance
- −$1,350
- − Repairs & maintenance
- −$1,634
- − Management
- −$1,634
- − Depreciation
- −$7,852
- Taxable loss
- −$9,616
- Est. tax savings @ 24.0%
- +$2,308
- After-tax cash flow
- $-2,344/yr
For passive investors: Depreciation is non-cash, so a rental often shows a tax loss while cash-flowing — sheltering income. Rental losses are passive: they offset passive income freely, and up to $25,000/yr can offset ordinary (W-2) income if you actively participate and your MAGI is under $100k (phasing out to $0 by $150k); unused losses carry forward. On sale, claimed depreciation is recaptured at up to 25%, and gains may owe capital-gains tax (a 1031 exchange can defer both). Figures are a year-1 estimate at your 24.0% rate — not tax advice; consult a CPA.
Schools (NCES district)
- District
- South Bend Community School Corporation
- NCES district ID
- 1810290
- Math proficiency
- 12% ▼ -10.00%
- Reading proficiency
- 21% ▼ -6.00%
- Median HH income
- $41,935
- Composite
- 14.21/100
- National rank
- #9452
- State rank
- #284 of 301 in IN
Livability — South Bend
- Score
- 64/100
- State rank
- #365
- US rank
- #13730
Category grades
Schools grade is shown separately in the Schools card above.
Census & demographics
- Census place
- South Bend, IN
- County
- Saint Joseph County · 189,048 people
- City population
- 99,767
- Metro
- South Bend-Mishawaka, IN-MI
- Population (ZIP)
- 14,190
- Household income
- $62,964
- Rent vs Own
- Severe rent burden
- 420.0
Population outlook (St. Joseph County) Hauer SSP2
- Today (2025)
- 273,186 people
- By 2030
- 273,594 · +0.1%
- By 2040
- 271,641 · -0.6%
- By 2050
- 269,187 · -1.5%
- By 2075
- 263,136 · -3.7%
- By 2100
- 245,659 · -10.1%
Race, ethnicity, and origin ACS 2023
- Neighborhood character
- Predominantly White (65%)
- Race & ethnicity
- White 65% Black 14% Two or more races 11% Hispanic / Latino 10% Asian 3%
- Hispanic origin (detail)
- Mexican 8%
- Common ancestry
- Romanian 6% Italian 2% Serbian 2%
- Foreign-born
- 8% · Canada, Vietnam
- Languages at home
- 87% English-only · Spanish 7% Tagalog/Filipino 1% Other Indo-European 1%
Political lean MEDSL · St. Joseph
- 2024 margin
- Toss-up / Even · D 50.0% · R 48.5% · Other 1.5%
- 2008→2024 swing
- -15.6pp toward R · 2008: 17.1pp · 2024: 1.5pp
- All cycles
- 2024: D+1.5 2020: D+5.8 2016: D+0.2 2012: D+3.5 2008: D+17.1
Not yet ingested
- Civics
- —
Market trends
- HPI YoY
- ▼ -124.82%
- Current HPI
- 242.1938
- Rent YoY
- ▲ 6.27%
- Metro
- South Bend-Mishawaka, IN-MI
- State GDP YoY
- ▲ 2.90%
- F500 in state
- 18
Industry mix (Fortune 500 HQ in IN)
| Industry | F500 HQs | Revenue |
|---|---|---|
| Industrial Machinery | 2 | $37B |
|
||
| Healthcare | 1 | $177B |
|
||
| Pharmaceuticals | 1 | $45B |
|
||
| Metals / Steel | 1 | $18B |
|
||
| Agriculture | 1 | $17B |
|
||
| Packaging | 1 | $12B |
|
||
Price history
1 event — show timeline
- 2026-06-10 Listed $269,900 IRMLS
Property tax history
+0.1%/yrLatest (2025): $2,456 · -10.1% YoY. Source: county tax records.
Cash-flow waterfall
monthlySold comps — $/sqft
last 12 mo · ≤1 miLoading sold comps…