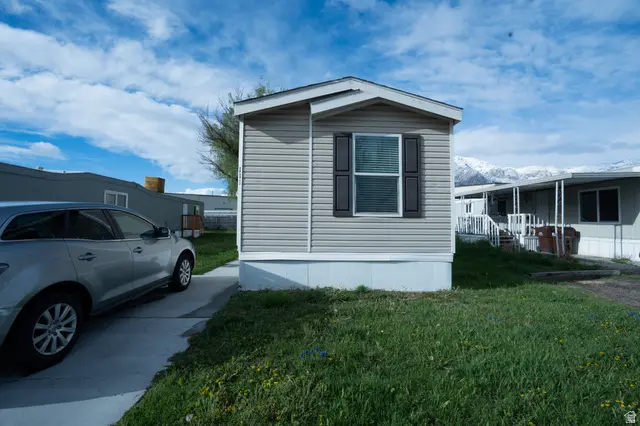
2491 N Highway 89 #111 · Pleasant View, UT
Flood risk 4/10 · Minor
- FEMA flood zone
- X (unshaded)
- Chance of flooding over 30 yrs
- 0.2%
- Est. flood insurance / yr
- $507 – $1,088
Fire risk 1/10 · Minimal
- Est. fire insurance / yr
- $453 – $841
Heat risk 4/10 · Minor
- Hot days now (above 94°F)
- 7 days/yr
- Hot days in 30 yrs
- 18 days/yr
Wind risk 1/10 · Minimal
- Chance of severe wind over 30 yrs
- —
Air-quality risk 3/10 · Minor
- Unhealthy air days now
- 2 days/yr
- Unhealthy air days in 30 yrs
- 3 days/yr
Risk factors via First Street. Map © Google.
Why this score? — see what drove the C grade
The composite is a weighted blend of 9 inputs, each scored 0–100. Each bar is that input's sub-score; the figure is the points it added to the 100-point composite (weight × sub-score).
- Cash flow +22.0/30.0
- 1% rule +10.0/10.0
- ARV discount +7.5/15.0
- DSCR +7.0/10.0
- Livability +3.9/5.0
- Schools +3.2/10.0
- Rent growth +3.1/5.0
- Condition / age +2.5/5.0
- Appreciation +0.0/10.0
$58,000
🖨 Deal sheet 📄 Offer letter ✓ Due diligence
Listing remarks
Step into something special in the sought-after Evergreen Village Community of Pleasant View! Built in 2020, this thoughtfully cared-for 3 bed, 2 bath home features a spacious open floor plan ideal for both relaxing and entertaining. Residents enjoy fantastic community amenities including a park, pool, and clubhouse. Quick access to I-15, plus shopping, schools, and everyday conveniences just minutes away. Schedule your private showing today. Square footage is a courtesy estimate obtained from Evergreen Village; buyer is advised to independently verify
Key facts
- Clubhouse
- Community amenities
- Quick access to i-15
Tags
Property features AI
Finance
- Other: Subdivision: EVERGREEN VILLAGE; Zoning: Single-Family (RES)
- HOA & community: Homeowners association present (Association name: Diana); Monthly association fee; Association fee covers trash and water; Community amenities include clubhouse, management, playground, pool; pets permitted
Exterior
- Parking: 2 open parking spaces (2 total parking spaces)
- Utilities: Natural gas connected; Electricity connected; Public sewer connected; Culinary (domestic) water connected
- Home design: Mobile home; Built in 2020; Property used for residential purposes
- Construction: Built/standing condition
- Exterior features: Uncovered open parking
Interior
- Kitchen: Refrigerator
- Bedrooms: 3 main-level bedrooms
- Flooring: Carpet; Tile
- Bathrooms: 1 full bathroom; 1 three-quarter bathroom
- Heating & cooling: Electric heating; Central air conditioning
- Interior features: Refrigerator included; No basement
Neighborhood map
What this means for you Summary
Snapshot
- This is a 3-bed/2.0-bath manufactured listed at $58k.
Deal economics
- At list price, monthly cash flow is $92 ($1k/yr) — positive.
- The deal already cash-flows at list — no discount required.
- Meets the 1% rule at list price ($2k rent vs $58k).
- Recommended offer: $55k (6.0% below list) — sets the bar for market timing.
Location & tenants
- Location reads 77/100 on livability (#51 in UT, #2,901 nationally) — a middle-class / working-renter tenant base. Strengths: crime A+, commute A+, employment A+; Watch: cost of living D, amenities F, health & safety F.
- Weber District (suburban): math 36% / reading 35% proficiency, ranked #56 of 80 in UT (top 70%) — families likely to look elsewhere, expect single-tenant / working-renter base with shorter leases.
- Zoned schools: Lomond View School (math 63% / reading 56%, grade B-, #59 of 585 statewide, top 10%, 483 students, 14% FRL); Orion Jr High (math 36% / reading 37%, grade F, #88 of 138 statewide, top 66%, 1,063 students, 19% FRL); Weber High (math 33% / reading 49%, grade F, #60 of 171 statewide, top 35%, 2,037 students, 15% FRL).
- Market conditions: Rents rising (+2.3%/yr); 611 active listings in the ZIP; 7 comparable units currently listed for rent nearby; rentals at typical pace (median 14d on market — plan ~3-4 weeks tenant-placement turnaround); solid renter incomes; 1,630 units permitted in Weber County in 2024 (521 in 5+ unit buildings).
Forward outlook
- Local home prices are declining (-3.0%/yr); year-one equity from $401 of loan paydown is wiped out by about $2k of value loss. Plan a longer hold.
- Weber County population projected at +24% by 2050 — long-run rental-demand tailwind backs the buy-and-hold thesis.
Negotiation context
- It's been on market 64 days — a 6% lower offer ($55k) is reasonable based on typical stale-listing flexibility.
- 5 sale attempts since 27y ago; this cycle's ask has dropped $7k (11%) from the opening price — seller is motivated, your offer sets the floor, not the list.
Risks & watch-outs
- Watch-outs: HOA is 52% of rent.
Questions for the listing agent
- It's been on market 64 days. Have you received any prior offers? Is the seller open to a 6% concession, seller financing, or rate buy-down credit?
- What does the HOA fee cover, when was the last increase, and are there any pending special assessments or reserve-fund shortfalls?
- Why hasn't it sold? Are there any deal-killer items the seller is aware of (foundation, flood, title, zoning, code violations)?
- Is there a deadline driving the sale (1031 exchange, divorce, estate, relocation)? That informs how much negotiation room exists.
- Schools are B-rated — typically a magnet for longer-tenancy family renters. What's the average tenant stay here, and is there a school-zone premium baked into asking?
- What's the average days-on-market for RENTAL listings here right now (not sales)? A rising rental-DOM trend means longer vacancies and softer asking-rent achievability than the comps imply.
- What's the recent tenant-quality profile in this submarket — average credit score on applications, eviction rate, late-payment / NSF rate, and stable-employment percentage? A property-management company in the area should have these aggregated.
- How much new for-sale + rental construction is in the pipeline within 1–3 miles? Heavy new supply typically softens prices + rents 12–24 months out; constrained supply supports both.
Investment metrics
- 1% rule
- 3.18% ✓
- Cap rate
- 8.19%
- Cash-on-cash
- 6.79%
- DSCR
- 1.30
- GRM
- 2.6
CMA / ARV
No comps found within radius.
Projected returns pro-forma
-3.0% appreciation · 2.33% rent growth · sell at horizon
- IRR
- -7.0%
- Equity multiple
- 0.74×
- Total profit
- $-4,162
- Equity at exit
- $8,648
- IRR
- 1.3%
- Equity multiple
- 1.09×
- Total profit
- $1,430
- Equity at exit
- $5,015
Cash invested: $16,240 (down + closing). Projections, not guarantees.
Landlord ↔ Tenant lean methodology
- Overall (STATE)
- 86 Strongly Landlord-Friendly
- State Utah
- 86 Strongly Landlord-Friendly · R+15
- County
- — inherits STATE
- City
- — inherits STATE
ZIP-level market 84404
- Rents YoY
- 2.3%
- Active inventory
- 611
- Price-to-rent
- 2.6×
Monthly cashflow live
- Estimated rent
- $1,844 high interval (Pro) →
- Mortgage (P&I)
- −$304
- Tax est. 1.5%
- −$72 /mo · $870/yr
- Insurance
- −$24
- HOA
- −$964
- Vacancy / Maint / Mgmt
- −$387
- Net cashflow
- $92
Break-even live
UW: 25.0% down · 7.5% · 30yr · 1.5% tax · 5.0% vac · 8.0% maint · 8.0% mgmt
Financing live
Cash to close
- Down payment
- $14,500
- Closing costs
- $1,740
- Reserves months
- —
- Total cash needed
- —
Loan-product check · same deal, 3 products live
Conventional
25% down · 7.5% · 30yr
- Down + closing
- —
- Monthly P&I
- —
- Monthly cashflow
- —
- DSCR
- —
- Eligible?
- —
Personal DTI + credit; lowest rate.
DSCR
20% down · 8.5% · 30yr
- Down + closing
- —
- Monthly P&I
- —
- Monthly cashflow
- —
- DSCR
- —
- Eligible?
- —
No personal income docs; deal must DSCR.
Hard money
10% down · 12.0% · 12mo
- Down + closing
- —
- Monthly P&I
- —
- Monthly cashflow
- —
- DSCR
- —
- Eligible?
- —
Short-term bridge; refi at stabilization.
Rent comps 7 comps
| Address | Beds | Baths | Sqft | Rent | $/sqft | DOM | Units | Dist |
|---|---|---|---|---|---|---|---|---|
| 2100 US-89 Harrisville, UT | 2.0–3.0 | 1.0–2.5 | 1373 | $1,839 | $1.34 | 14d | 8 | 0.53mi |
| 1148 Spring Valley Ln Pleasant View, UT | 2.0 | 2.0 | 1148 | $1,551 | $1.35 | 14d | 1 | 0.71mi |
| 1933 N 325 W Ogden, UT | 3.0 | 2.5 | 1374 | $1,795 | $1.31 | 19d | 1 | 1.06mi |
| 282 W 1975 N Ogden, UT | 3.0 | 2.5 | 1362 | $1,700 | $1.25 | 14d | 1 | 1.07mi |
| 2510 Charleston Ave Ogden, UT | 2.0–3.0 | 2.0 | 900 | $1,550 | $1.72 | 14d | 5 | 1.17mi |
| 1502 N 900 W Ogden, UT | 2.0–3.0 | 1.0–1.5 | 1050 | $1,475 | $1.40 | 14d | 8 | 1.24mi |
| 811 W 1340 N Ogden, UT | 1.0–3.0 | 1.0–2.5 | 1106 | $1,859 | $1.68 | 14d | 1 | 1.35mi |
HOA detail
- Monthly dues
- $964 · $11,568/yr
- Likely covers
- pool
Listing history 29 events
-
2026-06-18days on market $58,000 Active 64 DOM
-
2026-06-17days on market $58,000 Active 63 DOM
-
2026-06-16days on market $58,000 Active 62 DOM
-
2026-06-15days on market $58,000 Active 61 DOM
-
2026-06-14days on market $58,000 Active 59 DOM
-
2026-06-10days on market $58,000 Active 56 DOM
-
2026-06-09days on market $58,000 Active 55 DOM
-
2026-06-08days on market $58,000 Active 54 DOM
-
2026-06-07days on market $58,000 Active 53 DOM
-
2026-06-05days on market $58,000 Active 50 DOM
-
2026-06-03days on market $58,000 Active 49 DOM
-
2026-06-02days on market $58,000 Active 48 DOM
-
2026-06-01days on market $58,000 Active 47 DOM
-
2026-05-31days on market $58,000 Active 46 DOM
-
2026-05-31days on market $58,000 Active 45 DOM
-
2026-04-15$65,000 Active
-
2025-11-07historical
-
2025-08-04price $60,000
-
2025-06-09price $66,000
-
2025-05-08$69,000 Active
-
2023-05-13historical
-
2023-04-28price $65,000
-
2023-04-06price $70,000
-
2023-03-11price $75,900
-
2023-02-16$79,000 Active
-
2000-07-20historical
-
2000-01-20$21,500
-
1999-09-20historical
-
1999-09-10$23,100
ⓘ Source: listings_history table (triggers on properties + properties_extension) + one-shot
backfill from property_details.listing_events for pre-trigger history.
Climate risk First Street
- Flood 4/10 Moderate FEMA zone X (unshaded) · 20% chance over 30 yrs
- Wildfire 1/10 Low
- Heat 4/10 Moderate 7 d/yr ≥94°F today · 18 d/yr by 30 yrs out
- Wind 1/10 Low
- Air quality 3/10 Moderate 2 unhealthy d/yr today · 3 by 30 yrs out
Nearby sold comps map
Loading sold comps map…
Walkable amenities ~0.75 mi
Loading nearby amenities…
Taxation est. · year 1
- Rental income
- $22,127
- − Mortgage interest
- −$3,249
- − Property taxes
- −$870
- − Insurance
- −$290
- − Repairs & maintenance
- −$1,770
- − Management
- −$1,770
- − HOA
- −$11,568
- − Depreciation
- −$1,687
- Taxable income
- $922
- Est. tax owed @ 24.0%
- −$221
- After-tax cash flow
- $881/yr
For passive investors: Depreciation is non-cash, so a rental often shows a tax loss while cash-flowing — sheltering income. Rental losses are passive: they offset passive income freely, and up to $25,000/yr can offset ordinary (W-2) income if you actively participate and your MAGI is under $100k (phasing out to $0 by $150k); unused losses carry forward. On sale, claimed depreciation is recaptured at up to 25%, and gains may owe capital-gains tax (a 1031 exchange can defer both). Figures are a year-1 estimate at your 24.0% rate — not tax advice; consult a CPA.
Schools (NCES district)
- District
- Weber District
- NCES district ID
- 4901200
- Math proficiency
- 36% ▼ -4.00%
- Reading proficiency
- 35% ▼ -5.00%
- Median HH income
- $65,750
- Composite
- 32.28/100
- National rank
- #5757
- State rank
- #56 of 80 in UT
Livability — Pleasant View
- Score
- 77/100
- State rank
- #51
- US rank
- #2901
Category grades
Schools grade is shown separately in the Schools card above.
Census & demographics
- Census place
- Pleasant View, UT
- County
- Weber County · 260,557 people
- Metro
- Ogden-Clearfield, UT
- Population (ZIP)
- 66,587
- Household income
- $85,057
- Rent vs Own
- Severe rent burden
- 1201.0
Population outlook (Weber County) Hauer SSP2
- Today (2025)
- 274,329 people
- By 2030
- 288,577 · +5.2%
- By 2040
- 314,848 · +14.8%
- By 2050
- 338,710 · +23.5%
- By 2075
- 384,412 · +40.1%
- By 2100
- 409,305 · +49.2%
Race, ethnicity, and origin ACS 2023
- Neighborhood character
- Predominantly White (70%)
- Race & ethnicity
- White 70% Hispanic / Latino 24% Two or more races 7% Asian 1%
- Hispanic origin (detail)
- Mexican 20%
- Common ancestry
- Italian 5% Slovak 4% Iranian 3%
- Foreign-born
- 8% · Canada
- Languages at home
- 83% English-only · Spanish 15% Other Indo-European 1%
Political lean MEDSL · Weber
- 2024 margin
- Strong R (+23.5) · D 36.8% · R 60.3% · Other 2.9%
- 2008→2024 swing
- +4.1pp toward D · 2008: -27.6pp · 2024: -23.5pp
- All cycles
- 2024: R+23.5 2020: R+22.7 2016: R+20.0 2012: R+46.0 2008: R+27.6
Not yet ingested
- Civics
- —
Market trends
- HPI YoY
- ▼ -317.85%
- Current HPI
- 323.2499
- Rent YoY
- ▲ 2.33%
- Metro
- Ogden-Clearfield, UT
- State GDP YoY
- ▲ 3.54%
- F500 in state
- 2
Industry mix (Fortune 500 HQ in UT)
| Industry | F500 HQs | Revenue |
|---|---|---|
| Financial Services | 1 | $3B |
|
||
Price history
+181.4% since first listed14 events — show timeline
- 2026-04-15 Listed $65,000 WFRMLS
- 2025-11-07 Listing Removed — WFRMLS
- 2025-08-04 Price Changed $60,000 WFRMLS
- 2025-06-09 Price Changed $66,000 WFRMLS
- 2025-05-08 Listed $69,000 WFRMLS
- 2023-05-13 Listing Removed — WFRMLS
- 2023-04-28 Price Changed $65,000 WFRMLS
- 2023-04-06 Price Changed $70,000 WFRMLS
- 2023-03-11 Price Changed $75,900 WFRMLS
- 2023-02-16 Listed $79,000 WFRMLS
- 2000-07-20 Listing Removed — WFRMLS
- 2000-01-20 Listed $21,500 WFRMLS
- 1999-09-20 Listing Removed — WFRMLS
- 1999-09-10 Listed $23,100 WFRMLS
Cash-flow waterfall
monthlySold comps — $/sqft
last 12 mo · ≤1 miLoading sold comps…