 Duplex
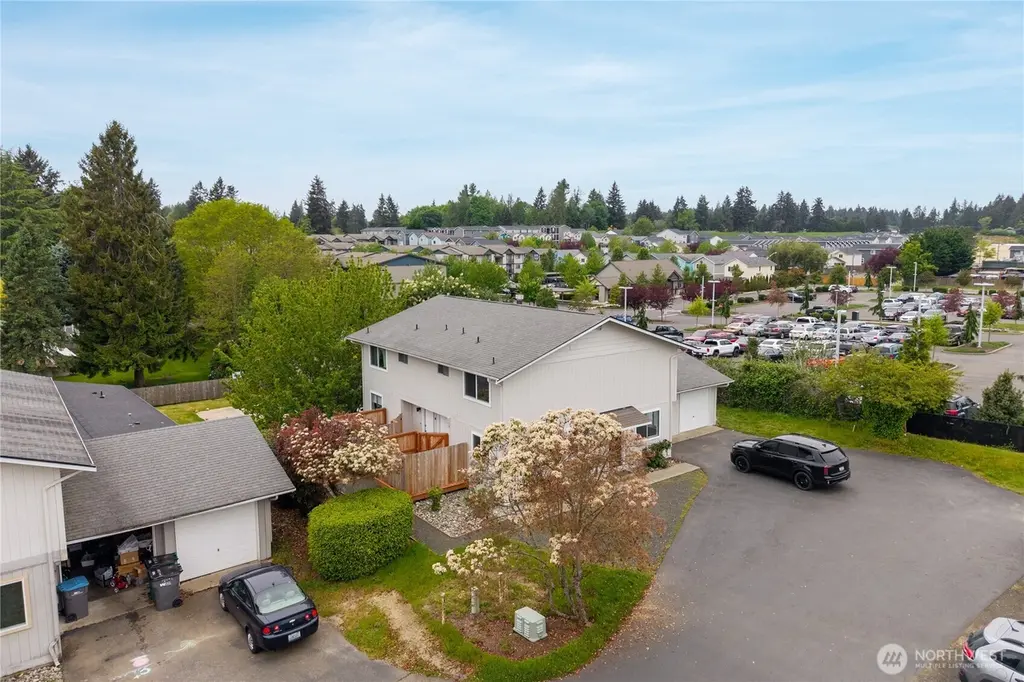
1034 Hanford Ave · Bremerton, WA
Flood risk 1/10 · Minimal
- FEMA flood zone
- X (unshaded)
- Chance of flooding over 30 yrs
- 0.0%
- Est. flood insurance / yr
- $507 – $1,088
Fire risk 1/10 · Minimal
- Est. fire insurance / yr
- $604 – $1,122
Heat risk 3/10 · Minor
- Hot days now (above 86°F)
- 7 days/yr
- Hot days in 30 yrs
- 15 days/yr
Wind risk 1/10 · Minimal
- Chance of severe wind over 30 yrs
- —
Air-quality risk 7/10 · Major
- Unhealthy air days now
- 9 days/yr
- Unhealthy air days in 30 yrs
- 10 days/yr
Risk factors via First Street. Map © Google.
Why this score? — see what drove the D grade
The composite is a weighted blend of 9 inputs, each scored 0–100. Each bar is that input's sub-score; the figure is the points it added to the 100-point composite (weight × sub-score).
- Cash flow +15.7/30.0
- ARV discount +5.3/15.0
- DSCR +4.9/10.0
- Livability +4.3/5.0
- Schools +3.9/10.0
- 1% rule +3.2/10.0
- Rent growth +2.6/5.0
- Condition / age +2.5/5.0
- Appreciation +0.0/10.0
$595,000
🖨 Deal sheet (PDF) 📄 Offer letter ✓ Due diligence
Multi-family units
County records classify this as Multi-Family (2-4 Unit). Listing-text estimate: 2 units. confirmed
Listing remarks
Townhouse-style duplex featuring two large 1,286 SF 3BD/1.5BTH units, each with in-unit W/ D and private garage. Unit B fully remodeled with new LVP flooring, remodeled baths, interior paint, updated lighting, and stainless appliances—ideal for owner-user or lease at $2,400 based on area rent comps. Unit A rented at $1,950 (below market) with upside to ~$2,200 (supported by neighboring identical duplex rents). Tenants pay utilities directly. Property includes 2 garages + additional storage, copper plumbing, some updated windows, roof replaced 2014, and mature low-maintenance landscaping. 6.6% current cap rate with upside to 7.6% at market rents.
Key facts
- Fully remodeled
- Private garage
- Stainless appliances
Tags
Property features AI
Finance
- Financial info: Listing accepts cash and conventional financing; Gross scheduled income: $51,600; Gross adjusted income: $49,020; Total monthly income: $4,300; Net operating income: $39,496; Total expenses: $9,524; Insurance expense: $2,616; Other expenses: $2,100; Gross rent multiplier: 11.5; Vacancy rate: 5%; Total units in building: 2 (no units below grade)
Exterior
- Parking: Covered parking for 2 vehicles; 2-car garage
- Utilities: Electric service; Sewer connected
- Home design: Duplex (residential income, multi-family); 2 stories; Poured concrete foundation
- Construction: Wood construction; Composition roof
- Exterior features: Wood exterior; Wood products used on exterior
Interior
- Kitchen: Each unit includes a range/oven; Each unit includes a refrigerator; Each unit includes a dishwasher
- Bedrooms: Both units are 3-bedroom units
- Flooring: Vinyl, vinyl plank and carpet
- Bathrooms: Both units have 2 bathrooms
- Heating & cooling: Forced air heating; No central cooling
- Interior features: Vinyl, vinyl plank and carpet flooring
- Laundry & utility: Each unit has a washer and dryer
Neighborhood map
What this means for you Summary
Snapshot
- This is a 2 × 3-bed/1.5-bath units multifamily listed at $595k.
Deal economics
- At list price, monthly cash flow is $265 ($3k/yr) — positive. Per door: $133/mo.
- The deal already cash-flows at list — no discount required.
- To meet the 1% rule (rent ≥ 1% of price), the offer needs to be $490k (17.6% below list).
- Recommended offer: $490k (17.6% below list) — sets the bar for 1% rule.
- Cap rate 6.8% vs local median 3.5% in Bremerton — top-decile yield for the area; either an underpriced asset or a hidden risk that comps aren't pricing in. Stress-test before assuming the spread holds.
Location & tenants
- Location reads 86/100 on livability (#22 in WA, #431 nationally) — a professional / high-income tenant draw. Strengths: amenities A+, commute A+, housing A+; Watch: crime F.
- Bremerton School District (urban): math 36% / reading 51% proficiency, ranked #194 of 291 in WA (top 67%) — families likely to look elsewhere, expect single-tenant / working-renter base with shorter leases.
- Zoned schools: Armin Jahr Elementary (380 students, 83% FRL); Mountain View Middle School (844 students, 71% FRL); Bremerton High School (1,221 students, 66% FRL) — zoned schools average 73% FRL vs 55% district-wide (18 pts higher); higher-poverty schools than district average — tighter screening recommended.
- Market conditions: Rents flat; 97 active listings in the ZIP; solid renter incomes; 1,294 units permitted in Kitsap County in 2024 (302 in 5+ unit buildings).
- At $4,903/mo this rent would consume 78% of the median local household income ($76k/yr) (locally 1418% of renters already pay >50% of income on rent) — very limited rent-growth headroom before tenants either downsize or default.
Forward outlook
- Local home prices are declining (-3.0%/yr); year-one equity from $4k of loan paydown is wiped out by about $18k of value loss. Plan a longer hold.
- Kitsap County population projected at +8% by 2050 — modest demand growth; plan on rents tracking national, not racing it.
Negotiation context
- It's been on market 18 days — a 2% lower offer ($586k) is reasonable based on typical stale-listing flexibility.
- 3 sale attempts since 20y ago; this cycle's ask is 23700% above the opening price — seller raised mid-cycle; expect resistance to lowballs.
- Current owner paid $182k; list at $595k implies a 227% gain — meaningful room to come down on a strong offer.
Questions for the listing agent
- Can we see the unit-by-unit rent roll, current vacancy, and any below-market leases? What's the average tenancy length?
- What capital expenditures (roof, boiler, parking lot, exteriors) have been made in the last 5 years, and what's planned in the next 2?
- Is there a deadline driving the sale (1031 exchange, divorce, estate, relocation)? That informs how much negotiation room exists.
- Schools are B-rated — typically a magnet for longer-tenancy family renters. What's the average tenant stay here, and is there a school-zone premium baked into asking?
- Crime grade is F in this area — have there been break-ins, vandalism, or insurance claims at this property in the last 3 years? What carrier currently insures it and at what premium?
- The area grade is low — what's the realistic commute time and amenity access for the typical tenant pool here? Any planned neighborhood developments (good or bad) we should know about?
- What's the average days-on-market for RENTAL listings here right now (not sales)? A rising rental-DOM trend means longer vacancies and softer asking-rent achievability than the comps imply.
- What's the recent tenant-quality profile in this submarket — average credit score on applications, eviction rate, late-payment / NSF rate, and stable-employment percentage? A property-management company in the area should have these aggregated.
- How much new apartment / multifamily construction is in the pipeline within 1–3 miles? Heavy new supply (>2% of stock underway) typically softens rents 12–24 months out; light construction supports rent growth.
Investment metrics
- 1% rule
- 0.82% ✗
- Cap rate
- 6.83%
- Cash-on-cash
- 1.91%
- DSCR
- 1.09
- GRM
- 10.1
CMA / ARV
- ARV (median comp)
- $567,794
- List price
- $595,000
- Delta
- 4.79%
- Verdict
- FAIR
- Comps
- 10 within 1.0 mi
Projected returns pro-forma
-3.0% appreciation · 0.55% rent growth · sell at horizon
- IRR
- -15.8%
- Equity multiple
- 0.45×
- Total profit
- $-91,546
- Equity at exit
- $88,716
- IRR
- -11.7%
- Equity multiple
- 0.37×
- Total profit
- $-105,001
- Equity at exit
- $51,445
Cash invested: $166,600 (down + closing). Projections, not guarantees.
Landlord ↔ Tenant lean methodology
- Overall (STATE)
- 28 Tenant-Leaning
- State Washington
- 28 Tenant-Leaning · D+8
- County
- — inherits STATE
- City
- — inherits STATE
ZIP-level market 98310
- Rents YoY
- 0.6%
- Active inventory
- 97
- Price-to-rent
- 20.2×
Monthly cashflow live
- Estimated rent
- $4,903 high interval (Pro) →
- Mortgage (P&I)
- −$3,120
- Tax from tax record
- −$240 /mo · $2,878/yr
- Insurance
- −$248
- HOA
- −$0
- Vacancy / Maint / Mgmt
- −$1,030
- Net cashflow
- $265
Break-even live
Sensitivity live
| Price | -10% $602 | -5% $434 | +0% $265 | +5% $97 | +10% $-71 |
|---|---|---|---|---|---|
| Rent | -10% $-122 | -5% $72 | +0% $265 | +5% $459 | +10% $653 |
| Rate | -1.0pp $565 | -0.5pp $417 | base $265 | +0.5pp $111 | +1.0pp $-46 |
2-unit breakdown (identical units grouped — click to expand)
| Units | Beds | Baths | Est. rent |
|---|---|---|---|
| 2× units | 3 | 1.5 | $4,904 |
| #1 | 3 | 1.5 | $2,452 |
| #2 | 3 | 1.5 | $2,452 |
| Total (2 units) | $4,903 | ||
UW: 25.0% down · 7.5% · 30yr · 1.5% tax · 5.0% vac · 8.0% maint · 8.0% mgmt
Financing live
Cash to close
- Down payment
- $148,750
- Closing costs
- $17,850
- Reserves months
- —
- Total cash needed
- —
Loan-product check · same deal, 3 products live
Conventional
25% down · 7.5% · 30yr
- Down + closing
- —
- Monthly P&I
- —
- Monthly cashflow
- —
- DSCR
- —
- Eligible?
- —
Personal DTI + credit; lowest rate.
DSCR
20% down · 8.5% · 30yr
- Down + closing
- —
- Monthly P&I
- —
- Monthly cashflow
- —
- DSCR
- —
- Eligible?
- —
No personal income docs; deal must DSCR.
Hard money
10% down · 12.0% · 12mo
- Down + closing
- —
- Monthly P&I
- —
- Monthly cashflow
- —
- DSCR
- —
- Eligible?
- —
Short-term bridge; refi at stabilization.
Listing history 22 events
-
2026-06-02days on market $595,000 Active 18 DOM
-
2026-06-01days on market $595,000 Active 17 DOM
-
2026-05-31days on market $595,000 Active 16 DOM
-
2026-05-30days on market $595,000 Active 15 DOM
-
2026-05-15$595,000 Active
-
2014-08-05historical
-
2014-07-30soldstatus $182,000 Sold
-
2014-07-30soldstatus $182,000
-
2014-03-14status Pending Short Sale
-
2014-02-27status Pending
-
2014-02-07price $190,000
-
2014-01-22price $200,000
-
2014-01-11price $210,000
-
2013-12-26price $220,000
-
2013-12-10price $230,000
-
2013-11-21price $240,000
-
2013-10-29$250,000 Active
-
2007-02-16soldstatus $335,000
-
2007-01-20historical
-
2006-10-26$335,000
-
2004-09-30soldstatus $299,000
-
2003-06-13soldstatus $218,360
ⓘ Source: listings_history table (triggers on properties + properties_extension) + one-shot
backfill from property_details.listing_events for pre-trigger history.
Tax reassessment forecast WA · Resets to sale price
- Current annual tax
- $2,878 · $240/mo
- Projected year-2 tax
- $5,831 · $486/mo
- Expected delta
- +$2,953/yr (+$246/mo · 102.6%)
ⓘ Screening estimate from a state-policy table — verify with the county assessor before closing.
Climate risk First Street
- Flood 1/10 Low FEMA zone X (unshaded) · 0% chance over 30 yrs
- Wildfire 1/10 Low
- Heat 3/10 Moderate 7 d/yr ≥86°F today · 15 d/yr by 30 yrs out
- Wind 1/10 Low
- Air quality 7/10 Severe 9 unhealthy d/yr today · 10 by 30 yrs out
Nearby sold comps map
Loading sold comps map…
Walkable amenities ~0.75 mi
Loading nearby amenities…
Taxation est. · year 1
- Rental income
- $58,836
- − Mortgage interest
- −$33,329
- − Property taxes
- −$2,878
- − Insurance
- −$2,975
- − Repairs & maintenance
- −$4,707
- − Management
- −$4,707
- − Depreciation
- −$17,309
- Taxable loss
- −$7,069
- Est. tax savings @ 24.0%
- +$1,696
- After-tax cash flow
- $4,881/yr
For passive investors: Depreciation is non-cash, so a rental often shows a tax loss while cash-flowing — sheltering income. Rental losses are passive: they offset passive income freely, and up to $25,000/yr can offset ordinary (W-2) income if you actively participate and your MAGI is under $100k (phasing out to $0 by $150k); unused losses carry forward. On sale, claimed depreciation is recaptured at up to 25%, and gains may owe capital-gains tax (a 1031 exchange can defer both). Figures are a year-1 estimate at your 24.0% rate — not tax advice; consult a CPA.
Schools (NCES district)
- District
- Bremerton School District
- NCES district ID
- 5300660
- Math proficiency
- 36% ▼ -3.00%
- Reading proficiency
- 51% ▲ 1.00%
- Median HH income
- $46,765
- Composite
- 39.34/100
- National rank
- #8163
- State rank
- #194 of 291 in WA
Livability — Bremerton
- Score
- 86/100
- State rank
- #22
- US rank
- #431
Category grades
Schools grade is shown separately in the Schools card above.
Census & demographics
- Census place
- Bremerton, WA
- County
- Kitsap County · 243,099 people
- City population
- 94,488
- Metro
- Bremerton-Silverdale-Port Orchard, WA
- Population (ZIP)
- 22,643
- Household income
- $75,878
- Rent vs Own
- Severe rent burden
- 1418.0
Population outlook (Kitsap County) Hauer SSP2
- Today (2025)
- 277,525 people
- By 2030
- 285,040 · +2.7%
- By 2040
- 294,957 · +6.3%
- By 2050
- 300,622 · +8.3%
- By 2075
- 315,580 · +13.7%
- By 2100
- 304,340 · +9.7%
Race, ethnicity, and origin ACS 2023
- Neighborhood character
- Diverse neighborhood (Simpson 0.60)
- Race & ethnicity
- White 61% Hispanic / Latino 15% Two or more races 13% Asian 6% Black 5% Pacific Islander 4%
- Hispanic origin (detail)
- Mexican 7%
- Common ancestry
- Italian 4% Portuguese 4% Lithuanian 3%
- Foreign-born
- 11% · Canada, China
- Languages at home
- 84% English-only · Spanish 6% Other Asian/Pacific 3% Tagalog/Filipino 3%
Political lean MEDSL · Kitsap
- 2024 margin
- Strong D (+20.9) · D 58.8% · R 37.9% · Other 3.3%
- 2008→2024 swing
- +8.6pp toward D · 2008: 12.3pp · 2024: 20.9pp
- All cycles
- 2024: D+20.9 2020: D+18.1 2016: D+11.6 2012: D+11.1 2008: D+12.3
Not yet ingested
- Civics
- —
Market trends
- HPI YoY
- ▼ -533.38%
- Current HPI
- 374.6915
- Rent YoY
- ▲ 0.55%
- Metro
- Bremerton-Silverdale-Port Orchard, WA
- State GDP YoY
- ▲ 4.65%
- F500 in state
- 22
Industry mix (Fortune 500 HQ in WA)
| Industry | F500 HQs | Revenue |
|---|---|---|
| Retail | 2 | $269B |
|
||
| Technology / Retail | 1 | $638B |
|
||
| Technology | 1 | $245B |
|
||
| Telecommunications | 1 | $38B |
|
||
| Food / Beverage | 1 | $36B |
|
||
| Automotive / Trucks | 1 | $34B |
|
||
Price history
-98.9% since first listed18 events — show timeline
- 2026-06-11 Listed for Rent $2,500 APPFOLIO
- 2014-08-05 Delisted — NWMLS as Distributed by MLS Grid
- 2014-07-30 Sold (Public Records) $182,000 Public Records
- 2014-07-30 Sold (MLS) $182,000 NWMLS as Distributed by MLS Grid
- 2014-03-14 Pending — NWMLS as Distributed by MLS Grid
- 2014-02-27 Pending — NWMLS as Distributed by MLS Grid
- 2014-02-07 Price Changed $190,000 NWMLS as Distributed by MLS Grid
- 2014-01-22 Price Changed $200,000 NWMLS as Distributed by MLS Grid
- 2014-01-11 Price Changed $210,000 NWMLS as Distributed by MLS Grid
- 2013-12-26 Price Changed $220,000 NWMLS as Distributed by MLS Grid
- 2013-12-10 Price Changed $230,000 NWMLS as Distributed by MLS Grid
- 2013-11-21 Price Changed $240,000 NWMLS as Distributed by MLS Grid
- 2013-10-29 Listed $250,000 NWMLS as Distributed by MLS Grid
- 2007-02-16 Sold (MLS) $335,000 NWMLS as Distributed by MLS Grid
- 2007-01-20 Delisted — NWMLS as Distributed by MLS Grid
- 2006-10-26 Listed $335,000 NWMLS as Distributed by MLS Grid
- 2004-09-30 Sold (Public Records) $299,000 Public Records
- 2003-06-13 Sold (Public Records) $218,360 Public Records
Property tax history
+1.5%/yrLatest (2019): $2,878 · -10.2% YoY. Source: county tax records.
Cash-flow waterfall
monthlySold comps — $/sqft
last 12 mo · ≤1 miLoading sold comps…