15 12th Ave · Lake Lorraine, FL
Flood risk 1/10 · Minimal
- FEMA flood zone
- X (unshaded)
- Chance of flooding over 30 yrs
- 0.0%
- Est. flood insurance / yr
- $507 – $1,088
Fire risk 3/10 · Minor
- Est. fire insurance / yr
- $947 – $1,759
Heat risk 10/10 · Severe
- Hot days now (above 104°F)
- 7 days/yr
- Hot days in 30 yrs
- 23 days/yr
Wind risk 9/10 · Severe
- Chance of severe wind over 30 yrs
- 99.0%
Air-quality risk 2/10 · Minimal
- Unhealthy air days now
- 1 days/yr
- Unhealthy air days in 30 yrs
- 2 days/yr
Risk factors via First Street. Map © Google.
Why this score? — see what drove the C- grade
The composite is a weighted blend of 9 inputs, each scored 0–100. Each bar is that input's sub-score; the figure is the points it added to the 100-point composite (weight × sub-score).
- ARV discount +15.0/15.0
- Cash flow +14.7/30.0
- Schools +5.2/10.0
- DSCR +4.5/10.0
- Livability +3.5/5.0
- 1% rule +3.1/10.0
- Condition / age +2.5/5.0
- Rent growth +2.0/5.0
- Appreciation +0.0/10.0
$265,000
🖨 Deal sheet (PDF) 📄 Offer letter ✓ Due diligence
Listing remarks
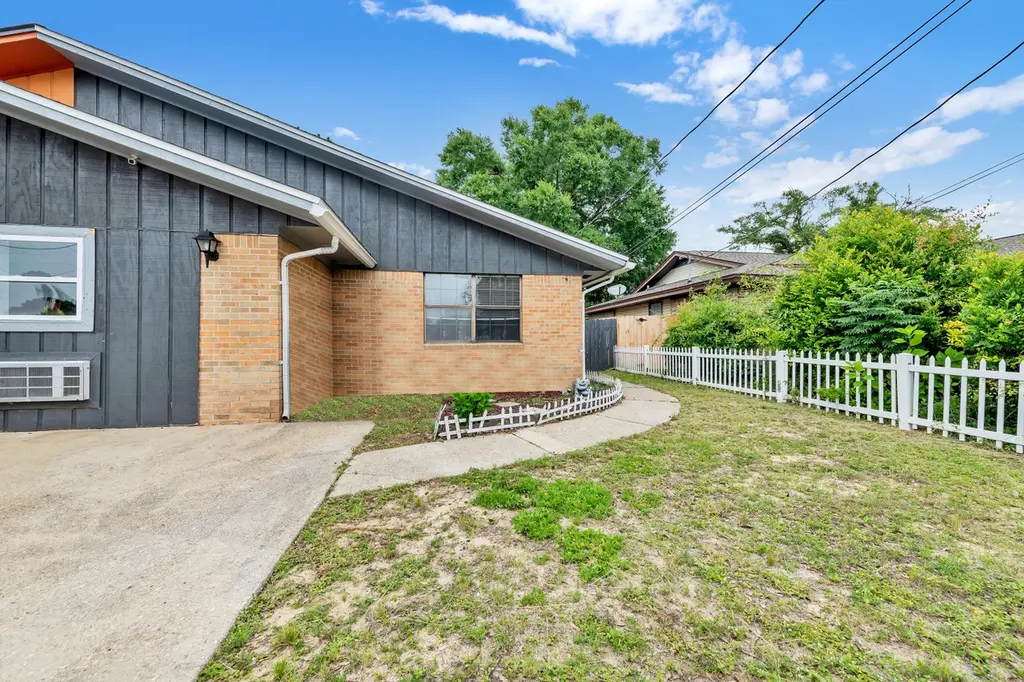
Move in ready and conveniently located near military bases, schools, shopping, and dining, this 3 bedroom, 2 bathroom home offers comfort and convenience. The bright interior features abundant natural light, fresh paint, and durable LVP flooring throughout. Major updates include a new roof installed in 2022 and an HVAC system replaced in 2019. The fenced backyard provides privacy and space to relax or entertain. Schedule your showing today.
Key facts
- Hvac system replaced
- Move in ready
- Fenced backyard
Tags
Property features AI
Finance
- HOA & community: Subdivision: PORT DIXIE PATIO HOMES
Exterior
- Parking: 1-car garage; 2 driveway spaces
- Utilities: Public water; Public sewer; Electric heating controls; Central electric air (AC - Central Elect)
- Home design: Single-story home; Built in 1983; Architectural style: Other; City street frontage and city road access
- Construction: Built in 1983
- Exterior features: Private yard; Rain gutters; Privacy fencing
Interior
- Kitchen: Kitchen located on the first level; Microwave; Refrigerator
- Bedrooms: 3 bedrooms (all on the first level)
- Flooring: Vinyl flooring
- Bathrooms: 2 full bathrooms; Master bathroom with shower only and walk-in closet
- Heating & cooling: Central heating; Central air conditioning
- Interior features: Newly painted; Split bedroom layout; Washer/dryer hookup
- Laundry & utility: Washer/dryer hookup
Neighborhood map
What this means for you Summary
Snapshot
- This is a 3-bed/2.0-bath townhouse listed at $265k.
Deal economics
- At list price, monthly cash flow is $67 ($801/yr) — positive.
- The deal already cash-flows at list — no discount required.
- To meet the 1% rule (rent ≥ 1% of price), the offer needs to be $215k (19.0% below list).
- Recommended offer: $215k (19.0% below list) — sets the bar for 1% rule.
- Cap rate 6.6% vs local median 4.3% in Lake Lorraine — top-decile yield for the area; either an underpriced asset or a hidden risk that comps aren't pricing in. Stress-test before assuming the spread holds.
Location & tenants
- Location reads 69/100 on livability (#488 in FL) — a middle-class / working-renter tenant base. Strengths: crime A+, employment A+, housing A+; Watch: cost of living C-, health & safety C-, amenities F.
- Okaloosa (other): math 60% / reading 60% proficiency, ranked #12 of 73 in FL (top 16%) — acceptable for families but not a draw, mixed tenant base, ~2y average lease.
- Zoned schools: Shalimar Elementary School (math 54% / reading 61%, grade C+, #764 of 2,144 statewide, top 36%, 614 students, 63% FRL); Choctawhatchee Senior High School (math 42% / reading 50%, grade D-, #220 of 667 statewide, top 33%, 1,677 students, 52% FRL) — zoned schools average 58% FRL vs 36% district-wide (21 pts higher); higher-poverty schools than district average — tighter screening recommended.
- Market conditions: Rents soft (-2.0%/yr); 112 active listings in the ZIP; 18 comparable units currently listed for rent nearby; rentals lingering (median 46d on market — plan ~5-8 weeks vacancy on turnover, expect pricing pressure); 72% of comp listings sitting > 30 days — soft ceiling on asking rent; solid renter incomes; 1,268 units permitted in Okaloosa County in 2024 (175 in 5+ unit buildings).
Forward outlook
- Local home prices are declining (-3.0%/yr); year-one equity from $2k of loan paydown is wiped out by about $8k of value loss. Plan a longer hold.
- Okaloosa County population projected at +37% by 2050 — long-run rental-demand tailwind backs the buy-and-hold thesis.
Negotiation context
- Only 13 days on market — expect competitive offers; lowballing is unlikely to land.
- Current owner paid $228k; 16% above their basis — modest negotiation headroom, anchor on the comps not their cost.
Risks & watch-outs
- Climate carrying-cost: severe wind risk, 99% chance of damaging wind over 30y; extreme-heat days projected 7→23/yr by 2055 (HVAC capex compounding) — expect insurance premiums to compound above CPI over the hold.
Questions for the listing agent
- Is there a deadline driving the sale (1031 exchange, divorce, estate, relocation)? That informs how much negotiation room exists.
- Schools are D-rated, which usually means shorter tenancies and higher turnover. Who's the typical renter profile here, and what's been the actual vacancy rate?
- What's the average days-on-market for RENTAL listings here right now (not sales)? A rising rental-DOM trend means longer vacancies and softer asking-rent achievability than the comps imply.
- What's the recent tenant-quality profile in this submarket — average credit score on applications, eviction rate, late-payment / NSF rate, and stable-employment percentage? A property-management company in the area should have these aggregated.
- How much new for-sale + rental construction is in the pipeline within 1–3 miles? Heavy new supply typically softens prices + rents 12–24 months out; constrained supply supports both.
Investment metrics
- 1% rule
- 0.81% ✗
- Cap rate
- 6.60%
- Cash-on-cash
- 1.08%
- DSCR
- 1.05
- GRM
- 10.3
CMA / ARV
- ARV (on-the-fly)
- $321,307
- Comps found
- 10
Show comp detail 10 sales within ~0.75 mi
| Address | Dist | Beds/Ba | Sqft | Sold | Price | $/sf | Match |
|---|---|---|---|---|---|---|---|
| 91 5th St | 0.06mi | 3/2.0 | 1,452 (-11%) | 12mo | $275,000 | $189 | 69 |
| 42 7th Ave #127 | 0.45mi | 3/2.5 | 1,550 (-5%) | 0mo | $244,500 | $158 | 68 |
| 44 5Th St Unit 138 | 0.46mi | 3/2.5 | 1,612 (-1%) | 11mo | $286,000 | $177 | 65 |
| 32 7th Ave #120 | 0.44mi | 3/2.0 | 1,520 (-7%) | 5mo | $300,000 | $197 | 64 |
| 43 12th Ave | 0.11mi | 2/2.0 (-1) | 1,435 (-12%) | 8mo | $175,000 | $122 | 63 |
| 111 Post Oak Pl | 0.51mi | 3/2.0 | 1,460 (-10%) | 4mo | $295,000 | $202 | 55 |
| 285 Shalimar Dr | 0.60mi | 2/2.0 (-1) | 1,466 (-10%) | 11mo | $520,000 | $355 | 41 |
| 34 5th Ave Unit A | 0.59mi | 2/2.5 (-1) | 1,414 (-13%) | 3mo | $220,000 | $156 | 41 |
| 221 Shalimar Dr | 0.70mi | 3/2.5 | 1,717 (+5%) | 20mo | $450,000 | $262 | 39 |
| 243 Shalimar Dr | 0.65mi | 2/2.5 (-1) | 1,432 (-12%) | 24mo | $425,000 | $297 | 23 |
Match score weights: distance 35% · size 25% · config 20% · recency 20%. Top-matched comps best support the ARV.
Projected returns pro-forma
-3.0% appreciation · 0.0% rent growth · sell at horizon
- IRR
- -17.7%
- Equity multiple
- 0.39×
- Total profit
- $-45,073
- Equity at exit
- $39,512
- IRR
- -16.0%
- Equity multiple
- 0.21×
- Total profit
- $-58,458
- Equity at exit
- $22,912
Cash invested: $74,200 (down + closing). Projections, not guarantees.
Landlord ↔ Tenant lean methodology
- Overall (STATE)
- 87 Strongly Landlord-Friendly
- State Florida
- 87 Strongly Landlord-Friendly · R+3
- County
- — inherits STATE
- City
- — inherits STATE
ZIP-level market 32579
- Home prices YoY
- -23.6%
- Rents YoY
- -2.0%
- Active inventory
- 112
- Price-to-rent
- 10.3×
Monthly cashflow live
- Estimated rent
- $2,146 high interval (Pro) →
- Mortgage (P&I)
- −$1,390
- Tax from tax record
- −$129 /mo · $1,544/yr
- Insurance
- −$110
- HOA
- −$0
- Vacancy / Maint / Mgmt
- −$451
- Net cashflow
- $67
Break-even live
Sensitivity live
| Price | -10% $217 | -5% $142 | +0% $67 | +5% $-8 | +10% $-83 |
|---|---|---|---|---|---|
| Rent | -10% $-103 | -5% $-18 | +0% $67 | +5% $152 | +10% $236 |
| Rate | -1.0pp $200 | -0.5pp $134 | base $67 | +0.5pp $-2 | +1.0pp $-72 |
UW: 25.0% down · 7.5% · 30yr · 1.5% tax · 5.0% vac · 8.0% maint · 8.0% mgmt
Financing live
Cash to close
- Down payment
- $66,250
- Closing costs
- $7,950
- Reserves months
- —
- Total cash needed
- —
Loan-product check · same deal, 3 products live
Conventional
25% down · 7.5% · 30yr
- Down + closing
- —
- Monthly P&I
- —
- Monthly cashflow
- —
- DSCR
- —
- Eligible?
- —
Personal DTI + credit; lowest rate.
DSCR
20% down · 8.5% · 30yr
- Down + closing
- —
- Monthly P&I
- —
- Monthly cashflow
- —
- DSCR
- —
- Eligible?
- —
No personal income docs; deal must DSCR.
Hard money
10% down · 12.0% · 12mo
- Down + closing
- —
- Monthly P&I
- —
- Monthly cashflow
- —
- DSCR
- —
- Eligible?
- —
Short-term bridge; refi at stabilization.
Rent comps 18 comps
| Address | Beds | Baths | Sqft | Rent | $/sqft | DOM | Units | Dist |
|---|---|---|---|---|---|---|---|---|
| 89 Spinnaker Ln Shalimar, FL | 3.0 | 2.0 | 1376 | $2,395 | $1.74 | 15d | 1 | 0.26mi |
| 64 7th Ave Shalimar, FL | 3.0 | 2.0 | 1460 | $1,995 | $1.37 | 45d | 1 | 0.50mi |
| 68 7th Ave Shalimar, FL | 3.0 | 2.0 | 1460 | $1,995 | $1.37 | 46d | 1 | 0.51mi |
| 100 8th Ave Shalimar, FL | 1.0–4.0 | 1.0–2.0 | 932 | $1,550 | $1.66 | 45d | 1 | 0.57mi |
| 10 2nd St Shalimar, FL | 3.0 | 2.0 | 1649 | $2,350 | $1.43 | 15d | 1 | 0.68mi |
| 40 4th Ave #9 Shalimar, FL | 2.0 | 1.5 | 1100 | $1,550 | $1.41 | 45d | 1 | 0.72mi |
| 40 11th St Unit K86 Shalimar, FL | 2.0 | 1.5 | 1216 | $1,749 | $1.44 | 45d | 1 | 0.81mi |
| 40 11th St Shalimar, FL | 2.0 | 1.0 | 1216 | $1,549 | $1.27 | 23d | 1 | 0.81mi |
| 116 4th Ave Shalimar, FL | 3.0 | 2.5 | 1750 | $1,995 | $1.14 | 45d | 1 | 0.85mi |
| 38 11th St #103 Shalimar, FL | 3.0 | 2.5 | 1300 | $1,750 | $1.35 | 45d | 1 | 0.85mi |
| 27 11th St Shalimar, FL | 2.0 | 1.5 | 1400 | $1,550 | $1.11 | 45d | 1 | 0.89mi |
| 133 4th Ave Shalimar, FL | 3.0 | 2.5 | 1248 | $2,000 | $1.60 | 15d | 1 | 0.90mi |
| 145 4th Ave Shalimar, FL | 2.0 | 2.0 | 1260 | $1,625 | $1.29 | 45d | 1 | 0.92mi |
| 6 Pinehurst Dr Shalimar, FL | 4.0 | 2.0 | 2124 | $2,795 | $1.32 | 45d | 1 | 1.17mi |
| 45 Warwick Dr Shalimar, FL | 2.0 | 2.0 | 1150 | $2,800 | $2.43 | 23d | 1 | 1.26mi |
| 810 Eglin Pkwy Fort Walton Beach, FL | 3.0 | 3.5 | 1905 | $2,995 | $1.57 | 45d | 1 | 1.26mi |
| 413 Waterway Ln Fort Walton Beach, FL | 2.0 | 3.0 | 1350 | $1,475 | $1.09 | 45d | 1 | 1.40mi |
| 941 Harrelson St Fort Walton Beach, FL | 2.0 | 2.5 | 1332 | $1,895 | $1.42 | 45d | 1 | 1.43mi |
Listing history 10 events
-
2026-06-21days on market $265,000 Active 13 DOM
-
2026-06-18days on market $265,000 Active 10 DOM
-
2026-06-17days on market $265,000 Active 9 DOM
-
2026-06-16days on market $265,000 Active 8 DOM
-
2026-06-15days on market $265,000 Active 7 DOM
-
2026-06-14days on market $265,000 Active 5 DOM
-
2026-06-13days on market $265,000 Active 4 DOM
-
2026-06-10days on market $265,000 Active 2 DOM
-
2026-06-09remarks 444-char remark
-
2026-06-09$265,000 Active 1 DOM
ⓘ Source: listings_history table (triggers on properties + properties_extension) + one-shot
backfill from property_details.listing_events for pre-trigger history.
Tax reassessment forecast FL · Resets to sale price
- Current annual tax
- $1,544 · $129/mo
- Projected year-2 tax
- $2,200 · $183/mo
- Expected delta
- +$656/yr (+$55/mo · 42.5%)
ⓘ Screening estimate from a state-policy table — verify with the county assessor before closing.
Climate risk First Street
- Flood 1/10 Low FEMA zone X (unshaded) · 0% chance over 30 yrs
- Wildfire 3/10 Moderate
- Heat 10/10 Extreme 7 d/yr ≥104°F today · 23 d/yr by 30 yrs out
- Wind 9/10 Extreme 99% chance of damaging wind over 30 yrs
- Air quality 2/10 Low 1 unhealthy d/yr today · 2 by 30 yrs out
Nearby sold comps map
Loading sold comps map…
Walkable amenities ~0.75 mi
Loading nearby amenities…
Taxation est. · year 1
- Rental income
- $25,754
- − Mortgage interest
- −$14,844
- − Property taxes
- −$1,544
- − Insurance
- −$1,325
- − Repairs & maintenance
- −$2,060
- − Management
- −$2,060
- − Depreciation
- −$7,709
- Taxable loss
- −$3,788
- Est. tax savings @ 24.0%
- +$909
- After-tax cash flow
- $1,710/yr
For passive investors: Depreciation is non-cash, so a rental often shows a tax loss while cash-flowing — sheltering income. Rental losses are passive: they offset passive income freely, and up to $25,000/yr can offset ordinary (W-2) income if you actively participate and your MAGI is under $100k (phasing out to $0 by $150k); unused losses carry forward. On sale, claimed depreciation is recaptured at up to 25%, and gains may owe capital-gains tax (a 1031 exchange can defer both). Figures are a year-1 estimate at your 24.0% rate — not tax advice; consult a CPA.
Schools (NCES district)
- District
- Okaloosa
- NCES district ID
- 1201380
- Math proficiency
- 60% ▼ -12.00%
- Reading proficiency
- 60% ▼ -4.00%
- Median HH income
- $55,601
- Composite
- 51.62/100
- National rank
- #1705
- State rank
- #12 of 73 in FL
Livability — Lake Lorraine
- Score
- 69/100
- State rank
- #488
- US rank
- #8959
Category grades
Schools grade is shown separately in the Schools card above.
Census & demographics
- Census place
- Lake Lorraine, FL
- County
- Okaloosa County · 194,352 people
- City population
- 10,775
- Metro
- Crestview-Fort Walton Beach-Destin, FL
- Population (ZIP)
- 10,506
- Household income
- $104,510
- Rent vs Own
- Severe rent burden
- 271.0
Population outlook (Okaloosa County) Hauer SSP2
- Today (2025)
- 235,133 people
- By 2030
- 253,483 · +7.8%
- By 2040
- 289,537 · +23.1%
- By 2050
- 322,954 · +37.3%
- By 2075
- 399,624 · +70.0%
- By 2100
- 425,311 · +80.9%
Race, ethnicity, and origin ACS 2023
- Neighborhood character
- Predominantly White (75%)
- Race & ethnicity
- White 75% Hispanic / Latino 12% Two or more races 8% Black 4% Asian 3% Pacific Islander 2% Native American 1%
- Hispanic origin (detail)
- Mexican 5%
- Common ancestry
- Lithuanian 4% Italian 3% Slovak 3%
- Foreign-born
- 7% · Canada, South Korea
- Languages at home
- 87% English-only · Spanish 5% Other Asian/Pacific 2% German/W. Germanic 2%
Political lean MEDSL · Okaloosa
- 2024 margin
- Solid R (+42.4) · D 28.2% · R 70.7% · Other 1.1%
- 2008→2024 swing
- +2.5pp toward D · 2008: -44.9pp · 2024: -42.4pp
- All cycles
- 2024: R+42.4 2020: R+39.1 2016: R+47.8 2012: R+49.4 2008: R+44.9
Not yet ingested
- Civics
- —
Market trends
- HPI YoY
- ▼ -86.93%
- Current HPI
- 281.2637
- Rent YoY
- ▼ -1.97%
- Metro
- Crestview-Fort Walton Beach-Destin, FL
- State GDP YoY
- ▲ 3.28%
- F500 in state
- 36
Industry mix (Fortune 500 HQ in FL)
| Industry | F500 HQs | Revenue |
|---|---|---|
| Industrial Technology | 2 | $29B |
|
||
| Insurance | 2 | $17B |
|
||
| Retail | 1 | $60B |
|
||
| Technology Distribution | 1 | $58B |
|
||
| Homebuilding | 1 | $35B |
|
||
| Technology Manufacturing | 1 | $35B |
|
||
Price history
+16.0% since first listed2 events — show timeline
- 2026-06-08 Listed $265,000 ECAR
- 2023-01-10 Sold (Public Records) $228,500 Public Records
Property tax history
+4.8%/yrLatest (2025): $1,544 · -36.3% YoY. Source: county tax records.
Cash-flow waterfall
monthlySold comps — $/sqft
last 12 mo · ≤1 miLoading sold comps…