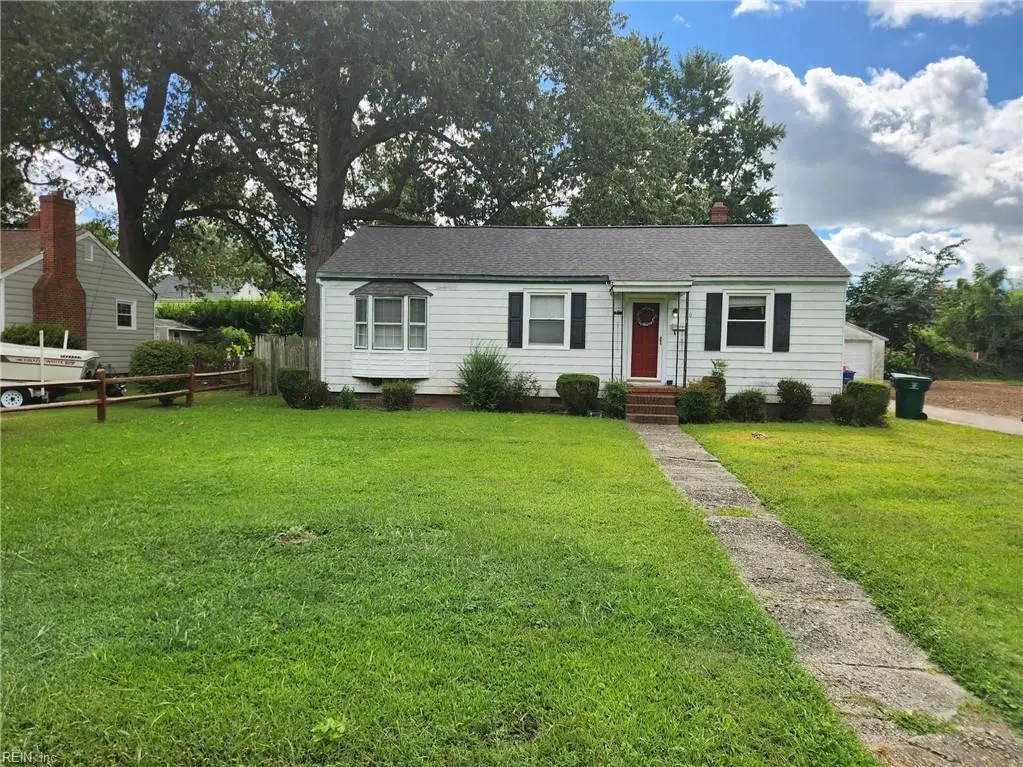
20 Fontaine Rd · Newport News, VA
Flood risk 1/10 · Minimal
- FEMA flood zone
- X (unshaded)
- Chance of flooding over 30 yrs
- 0.0%
- Est. flood insurance / yr
- $507 – $1,088
Fire risk 1/10 · Minimal
- Est. fire insurance / yr
- $666 – $1,236
Heat risk 9/10 · Severe
- Hot days now (above 105°F)
- 7 days/yr
- Hot days in 30 yrs
- 17 days/yr
Wind risk 8/10 · Major
- Chance of severe wind over 30 yrs
- 80.0%
Air-quality risk 2/10 · Minimal
- Unhealthy air days now
- 0 days/yr
- Unhealthy air days in 30 yrs
- 1 days/yr
Risk factors via First Street. Map © Google.
Why this score? — see what drove the D+ grade
The composite is a weighted blend of 9 inputs, each scored 0–100. Each bar is that input's sub-score; the figure is the points it added to the 100-point composite (weight × sub-score).
- ARV discount +14.7/15.0
- Cash flow +12.2/30.0
- Rent growth +4.0/5.0
- Schools +3.8/10.0
- Livability +3.8/5.0
- DSCR +3.6/10.0
- 1% rule +3.3/10.0
- Condition / age +2.5/5.0
- Appreciation +0.0/10.0
$235,000
🖨 Deal sheet (PDF) 📄 Offer letter ✓ Due diligence
Listing remarks MLS
THIS IS A GREAT FIXER-UPPER. LOADED WITH CHARM, THIS IS A WONDERFUL HOME TO GET SOME SWEAT EQUITY OR REHAB AND RESALE. HVAC LESS THAN A YEAR OLD, ROOF 2 YEARS OLD, ELECTRIC WATER HEATER 2 YEARS OLD. HOME CONVEYS AS-IS WHERE-IS. SELLER TO MAKE NO REPAIRS OR CONCESSIONS.
Key facts
- Roof 2 years old
- 0.27 acre lot
- 3 garage spots
Tags
Neighborhood map
What this means for you Summary
Snapshot
- This is a 3-bed/1.0-bath single-family listed at $235k.
Deal economics
- At list price, monthly cash flow is $-49 ($-585/yr) — negative.
- To cash-flow at today's rent, offer at most $226k (3.7% below list).
- To meet the 1% rule (rent ≥ 1% of price), the offer needs to be $196k (16.7% below list).
- Recommended offer: $196k (16.7% below list) — sets the bar for 1% rule.
- Cap rate 6.0% vs local median 4.2% in Newport News — top-decile yield for the area; either an underpriced asset or a hidden risk that comps aren't pricing in. Stress-test before assuming the spread holds.
Location & tenants
- Location reads 75/100 on livability (#123 in VA, #4,018 nationally) — a middle-class / working-renter tenant base. Strengths: health & safety A+, cost of living A, housing A; Watch: crime F, commute F.
- Newport News City Public School District (urban): math 34% / reading 54% proficiency, ranked #112 of 131 in VA (top 86%) — families likely to look elsewhere, expect single-tenant / working-renter base with shorter leases.
- Zoned schools: Riverside Elementary (math 29% / reading 51%, grade F, #898 of 1,108 statewide, top 81%, 481 students, 90% FRL); Homer L. Hines Middle (math 28% / reading 47%, grade F, #315 of 342 statewide, top 93%, 877 students, 85% FRL); Warwick High (math 42% / reading 77%, grade C+, #247 of 319 statewide, top 80%, 1,645 students, 86% FRL) — zoned schools average 87% FRL vs 55% district-wide (32 pts higher); higher-poverty schools than district average — tighter screening recommended.
- Market conditions: Rents rising fast (+6.0%/yr); 89 active listings in the ZIP; 14 comparable units currently listed for rent nearby; rentals at typical pace (median 17d on market — plan ~3-4 weeks tenant-placement turnaround); 522 units permitted in Newport News city in 2024 (458 in 5+ unit buildings).
- This rent runs 33% of the median local income ($71k/yr) — at the standard rent-burdened threshold; future hikes will face affordability resistance.
Forward outlook
- Local home prices are declining (-3.0%/yr); year-one equity from $2k of loan paydown is wiped out by about $7k of value loss. Plan a longer hold.
- Newport News County population projected to shrink 8% by 2050 — rents likely to lag national; underwrite the cash flow, not the appreciation.
Negotiation context
- It's been on market 286 days — a 12% lower offer ($207k) is reasonable based on typical stale-listing flexibility.
- Current owner paid $76k; list at $235k implies a 208% gain — meaningful room to come down on a strong offer.
Risks & watch-outs
- Watch-outs: built in 1939 — expect roof / HVAC / electrical / plumbing capex.
- Climate carrying-cost: severe wind risk, 80% chance of damaging wind over 30y; extreme-heat days projected 7→17/yr by 2055 (HVAC capex compounding) — expect insurance premiums to compound above CPI over the hold.
Questions for the listing agent
- What do current leases actually rent for vs. the listed asking? Can we see a recent rent roll and the last 12 months of T-12 income?
- It's been on market 286 days. Have you received any prior offers? Is the seller open to a 17% concession, seller financing, or rate buy-down credit?
- Built in 1939 — when were the roof, HVAC, electrical panel, plumbing, and water heater last replaced?
- Why hasn't it sold? Are there any deal-killer items the seller is aware of (foundation, flood, title, zoning, code violations)?
- Is there a deadline driving the sale (1031 exchange, divorce, estate, relocation)? That informs how much negotiation room exists.
- Schools are B-rated — typically a magnet for longer-tenancy family renters. What's the average tenant stay here, and is there a school-zone premium baked into asking?
- Crime grade is F in this area — have there been break-ins, vandalism, or insurance claims at this property in the last 3 years? What carrier currently insures it and at what premium?
- The area grade is low — what's the realistic commute time and amenity access for the typical tenant pool here? Any planned neighborhood developments (good or bad) we should know about?
- What's the average days-on-market for RENTAL listings here right now (not sales)? A rising rental-DOM trend means longer vacancies and softer asking-rent achievability than the comps imply.
- What's the recent tenant-quality profile in this submarket — average credit score on applications, eviction rate, late-payment / NSF rate, and stable-employment percentage? A property-management company in the area should have these aggregated.
- How much new for-sale + rental construction is in the pipeline within 1–3 miles? Heavy new supply typically softens prices + rents 12–24 months out; constrained supply supports both.
Investment metrics
- 1% rule
- 0.83% ✗
- Cap rate
- 6.04%
- Cash-on-cash
- -0.89%
- DSCR
- 0.96
- GRM
- 10.0
CMA / ARV
- ARV (median comp)
- $279,415
- List price
- $235,000
- Delta
- -15.90%
- Verdict
- UNDERPRICED
- Comps
- 20 within 1.0 mi
Show comp detail 12 sales within ~0.75 mi
| Address | Dist | Beds/Ba | Sqft | Sold | Price | $/sf | Match |
|---|---|---|---|---|---|---|---|
| 51 Harpersville Rd | 0.27mi | 3/1.0 | 1,434 (-2%) | 5mo | $175,000 | $122 | 79 |
| 41 Harpersville Rd | 0.28mi | 3/2.0 | 1,365 (-7%) | 2mo | $280,000 | $205 | 69 |
| 1220 Tyler Ave | 0.56mi | 3/1.0 | 1,434 (-2%) | 2mo | $225,000 | $157 | 68 |
| 103 Smith Ln | 0.58mi | 3/2.0 | 1,480 (+1%) | 5mo | $298,000 | $201 | 64 |
| 33 Rutledge Rd | 0.68mi | 3/1.0 | 1,507 (+2%) | 2mo | $290,000 | $192 | 63 |
| 15 Colonial Pl | 0.55mi | 3/1.5 | 1,320 (-10%) | 6mo | $215,000 | $163 | 50 |
| 15 Sanford Dr | 0.69mi | 3/1.5 | 1,613 (+10%) | 2mo | $325,000 | $201 | 48 |
| 12 Colonial Pl | 0.58mi | 4/2.0 (+1) | 1,637 (+11%) | 0mo | $340,000 | $208 | 45 |
| 18 Belinda Dr | 0.51mi | 4/2.0 (+1) | 1,654 (+12%) | 2mo | $330,000 | $200 | 44 |
| 43 Ferguson Ln | 0.71mi | 3/2.0 | 1,302 (-11%) | 4mo | $299,000 | $230 | 40 |
| 144 Nelson Dr | 0.64mi | 4/2.0 (+1) | 1,660 (+13%) | 4mo | $260,000 | $157 | 37 |
| 36 Davis Ave | 0.72mi | 3/2.0 | 1,253 (-15%) | 5mo | $271,000 | $216 | 34 |
Match score weights: distance 35% · size 25% · config 20% · recency 20%. Top-matched comps best support the ARV.
Projected returns pro-forma
-3.0% appreciation · 5.99% rent growth · sell at horizon
- IRR
- -14.5%
- Equity multiple
- 0.47×
- Total profit
- $-35,107
- Equity at exit
- $35,039
- IRR
- -1.6%
- Equity multiple
- 0.88×
- Total profit
- $-8,048
- Equity at exit
- $20,319
Cash invested: $65,800 (down + closing). Projections, not guarantees.
Landlord ↔ Tenant lean methodology
- Overall (STATE)
- 55 Moderately Landlord-Leaning
- State Virginia
- 55 Moderately Landlord-Leaning · D+2
- County
- — inherits STATE
- City
- — inherits STATE
ZIP-level market 23601
- Home prices YoY
- -13.0%
- Rents YoY
- 6.0%
- Active inventory
- 89
- Price-to-rent
- 10.0×
Monthly cashflow live
- Estimated rent
- $1,958 high interval (Pro) →
- Mortgage (P&I)
- −$1,232
- Tax from tax record
- −$265 /mo · $3,186/yr
- Insurance
- −$98
- HOA
- −$0
- Vacancy / Maint / Mgmt
- −$411
- Net cashflow
- $-49
Break-even live
Sensitivity live
| Price | -10% $84 | -5% $18 | +0% $-49 | +5% $-115 | +10% $-182 |
|---|---|---|---|---|---|
| Rent | -10% $-203 | -5% $-126 | +0% $-49 | +5% $29 | +10% $106 |
| Rate | -1.0pp $70 | -0.5pp $11 | base $-49 | +0.5pp $-110 | +1.0pp $-172 |
UW: 25.0% down · 7.5% · 30yr · 1.5% tax · 5.0% vac · 8.0% maint · 8.0% mgmt
Financing live
Cash to close
- Down payment
- $58,750
- Closing costs
- $7,050
- Reserves months
- —
- Total cash needed
- —
Loan-product check · same deal, 3 products live
Conventional
25% down · 7.5% · 30yr
- Down + closing
- —
- Monthly P&I
- —
- Monthly cashflow
- —
- DSCR
- —
- Eligible?
- —
Personal DTI + credit; lowest rate.
DSCR
20% down · 8.5% · 30yr
- Down + closing
- —
- Monthly P&I
- —
- Monthly cashflow
- —
- DSCR
- —
- Eligible?
- —
No personal income docs; deal must DSCR.
Hard money
10% down · 12.0% · 12mo
- Down + closing
- —
- Monthly P&I
- —
- Monthly cashflow
- —
- DSCR
- —
- Eligible?
- —
Short-term bridge; refi at stabilization.
Rent comps 14 comps
| Address | Beds | Baths | Sqft | Rent | $/sqft | DOM | Units | Dist |
|---|---|---|---|---|---|---|---|---|
| 404 Lennon Dr Newport News, VA | 3.0 | 2.0 | 1193 | $1,500 | $1.26 | 46d | 1 | 0.64mi |
| 13 Frances St Newport News, VA | 3.0 | 1.0 | 1016 | $1,595 | $1.57 | 45d | 1 | 0.67mi |
| 32 Gambol St Newport News, VA | 3.0 | 2.5 | 1650 | $2,500 | $1.52 | 4d | 1 | 0.72mi |
| 11112 Mintwood Pl Newport News, VA | 2.0–3.0 | 1.0 | 862 | $1,630 | $1.89 | 3d | 10 | 0.83mi |
| 72 Ferguson Ln Newport News, VA | 3.0 | 2.0 | 1473 | $2,200 | $1.49 | 3d | 1 | 0.90mi |
| 100 Tricia Ln Newport News, VA | 2.0 | 1.0 | 900 | $1,250 | $1.39 | 25d | 1 | 0.92mi |
| 761 Adams Dr Newport News, VA | 3.0 | 1.0 | 750 | $1,806 | $2.41 | 3d | 17 | 0.93mi |
| 311 Mimosa Dr Newport News, VA | 4.0 | 2.0 | 1754 | $2,350 | $1.34 | 45d | 1 | 0.96mi |
| 27 Nutmeg Quarter Pl Newport News, VA | 3.0 | 2.0 | 1608 | $2,600 | $1.62 | 9d | 1 | 0.96mi |
| 23 Green Ct Newport News, VA | 3.0 | 1.5 | 1200 | $2,000 | $1.67 | 16d | 1 | 0.99mi |
| 674 Summer Day Ct Newport News, VA | 2.0–3.0 | 2.0 | 986 | $1,502 | $1.52 | 5d | 4 | 1.11mi |
| 101 Basswood Dr Newport News, VA | 4.0 | 2.0 | 1409 | $2,395 | $1.70 | 45d | 1 | 1.31mi |
| 39 Westover Rd Newport News, VA | 3.0 | 1.5 | 1850 | $2,000 | $1.08 | 16d | 1 | 1.48mi |
| 268 Town Pointe Way Newport News, VA | 3.0 | 2.5 | 1587 | $2,200 | $1.39 | 45d | 1 | 1.49mi |
Listing history 17 events
-
2026-06-21days on market $235,000 Active 286 DOM
-
2026-06-18days on market $235,000 Active 283 DOM
-
2026-06-17days on market $235,000 Active 282 DOM
-
2026-06-16days on market $235,000 Active 281 DOM
-
2026-06-15days on market $235,000 Active 280 DOM
-
2026-06-09days on market $235,000 Active 274 DOM
-
2026-06-08days on market $235,000 Active 273 DOM
-
2026-06-07days on market $235,000 Active 272 DOM
-
2026-06-03days on market $235,000 Active 268 DOM
-
2026-06-02days on market $235,000 Active 267 DOM
-
2026-06-01days on market $235,000 Active 266 DOM
-
2026-05-31days on market $235,000 Active 265 DOM
-
2025-09-24price $235,000 269-char remark
Show marketing remark (269 chars)
THIS IS A GREAT FIXER-UPPER. LOADED WITH CHARM, THIS IS A WONDERFUL HOME TO GET SOME SWEAT EQUITY OR REHAB AND RESALE. HVAC LESS THAN A YEAR OLD, ROOF 2 YEARS OLD, ELECTRIC WATER HEATER 2 YEARS OLD. HOME CONVEYS AS-IS WHERE-IS. SELLER TO MAKE NO REPAIRS OR CONCESSIONS.
-
2025-09-08$231,000 Active 269-char remark
Show marketing remark (269 chars)
THIS IS A GREAT FIXER-UPPER. LOADED WITH CHARM, THIS IS A WONDERFUL HOME TO GET SOME SWEAT EQUITY OR REHAB AND RESALE. HVAC LESS THAN A YEAR OLD, ROOF 2 YEARS OLD, ELECTRIC WATER HEATER 2 YEARS OLD. HOME CONVEYS AS-IS WHERE-IS. SELLER TO MAKE NO REPAIRS OR CONCESSIONS.
-
1997-06-09soldstatus $76,333
-
1990-04-27soldstatus $76,900
-
1977-08-01soldstatus $27,950
ⓘ Source: listings_history table (triggers on properties + properties_extension) + one-shot
backfill from property_details.listing_events for pre-trigger history.
Tax reassessment forecast VA · Resets to sale price
- Current annual tax
- $3,186 · $265/mo
- Projected year-2 tax
- $3,186 · $265/mo
- Expected delta
- $0/yr ($0/mo · 0.0%)
ⓘ Screening estimate from a state-policy table — verify with the county assessor before closing.
Climate risk First Street
- Flood 1/10 Low FEMA zone X (unshaded) · 0% chance over 30 yrs
- Wildfire 1/10 Low
- Heat 9/10 Extreme 7 d/yr ≥105°F today · 17 d/yr by 30 yrs out
- Wind 8/10 Severe 80% chance of damaging wind over 30 yrs
- Air quality 2/10 Low 0 unhealthy d/yr today · 1 by 30 yrs out
Nearby sold comps map
Loading sold comps map…
Walkable amenities ~0.75 mi
Loading nearby amenities…
Taxation est. · year 1
- Rental income
- $23,498
- − Mortgage interest
- −$13,164
- − Property taxes
- −$3,186
- − Insurance
- −$1,175
- − Repairs & maintenance
- −$1,880
- − Management
- −$1,880
- − Depreciation
- −$6,836
- Taxable loss
- −$4,622
- Est. tax savings @ 24.0%
- +$1,109
- After-tax cash flow
- $524/yr
For passive investors: Depreciation is non-cash, so a rental often shows a tax loss while cash-flowing — sheltering income. Rental losses are passive: they offset passive income freely, and up to $25,000/yr can offset ordinary (W-2) income if you actively participate and your MAGI is under $100k (phasing out to $0 by $150k); unused losses carry forward. On sale, claimed depreciation is recaptured at up to 25%, and gains may owe capital-gains tax (a 1031 exchange can defer both). Figures are a year-1 estimate at your 24.0% rate — not tax advice; consult a CPA.
Schools (NCES district)
- District
- Newport News City Public School District
- NCES district ID
- 5102640
- Math proficiency
- 34% ▼ -37.00%
- Reading proficiency
- 54% ▼ -10.00%
- Median HH income
- $49,644
- Composite
- 37.7/100
- National rank
- #4360
- State rank
- #112 of 131 in VA
Livability — Newport News
- Score
- 75/100
- State rank
- #123
- US rank
- #4018
Category grades
Schools grade is shown separately in the Schools card above.
Census & demographics
- Census place
- Newport News, VA
- County
- Newport News City · 178,950 people
- City population
- 178,950
- Metro
- Virginia Beach-Norfolk-Newport News, VA-NC
- Population (ZIP)
- 26,645
- Household income
- $71,279
- Rent vs Own
- Severe rent burden
- 1175.0
Population outlook (Newport News County) Hauer SSP2
- Today (2025)
- 181,076 people
- By 2030
- 179,683 · -0.8%
- By 2040
- 174,649 · -3.5%
- By 2050
- 167,407 · -7.5%
- By 2075
- 147,597 · -18.5%
- By 2100
- 122,144 · -32.5%
Race, ethnicity, and origin ACS 2023
- Neighborhood character
- Diverse neighborhood (Simpson 0.59)
- Race & ethnicity
- White 51% Black 38% Two or more races 7% Hispanic / Latino 5%
- Hispanic origin (detail)
- Mexican 2% Puerto Rican 3%
- Common ancestry
- Slovak 2% Iranian 2% Romanian 1%
- Foreign-born
- 5% · Canada
- Languages at home
- 94% English-only · Spanish 2% French/Haitian/Cajun 1% Arabic 1%
Political lean MEDSL · Newport News
- 2024 margin
- Strong D (+28.8) · D 63.7% · R 34.9% · Other 1.4%
- 2008→2024 swing
- +0.1pp no change · 2008: 28.7pp · 2024: 28.8pp
- All cycles
- 2024: D+28.8 2020: D+32.9 2016: D+25.4 2012: D+30.0 2008: D+28.7
Not yet ingested
- Civics
- —
Market trends
- HPI YoY
- ▼ -42.06%
- Current HPI
- 281.5503
- Rent YoY
- ▲ 5.99%
- Metro
- Virginia Beach-Norfolk-Newport News, VA-NC
- State GDP YoY
- ▲ 2.40%
- F500 in state
- 50
Industry mix (Fortune 500 HQ in VA)
| Industry | F500 HQs | Revenue |
|---|---|---|
| Aerospace / Defense | 4 | $236B |
|
||
| Technology / Defense | 3 | $32B |
|
||
| Financial Services | 2 | $176B |
|
||
| Utilities | 2 | $27B |
|
||
| Insurance | 2 | $25B |
|
||
| Technology | 2 | $15B |
|
||
Price history
+740.8% since first listed5 events — show timeline
- 2025-09-24 Price Changed $235,000 REINMLS
- 2025-09-08 Listed $231,000 REINMLS
- 1997-06-09 Sold (Public Records) $76,333 Public Records
- 1990-04-27 Sold (Public Records) $76,900 Public Records
- 1977-08-01 Sold (Public Records) $27,950 Public Records
Property tax history
+4.1%/yrLatest (2026): $3,186 · +8.0% YoY. Source: county tax records.
Cash-flow waterfall
monthlySold comps — $/sqft
last 12 mo · ≤1 miLoading sold comps…