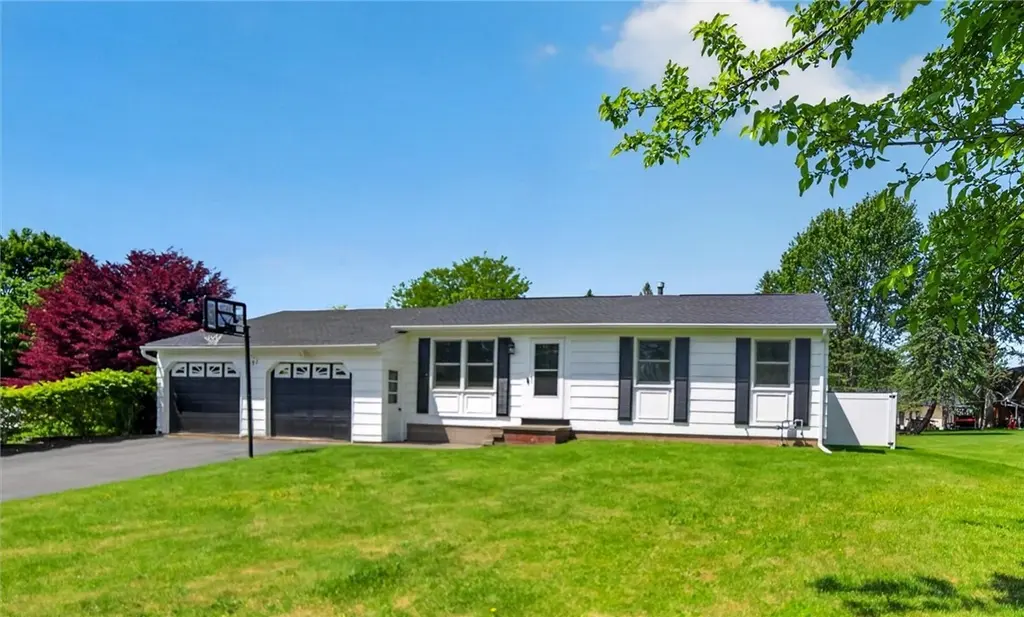
251 Farmview Dr · Gananda, NY
Flood risk 1/10 · Minimal
- FEMA flood zone
- X
- Chance of flooding over 30 yrs
- 0.0%
- Est. flood insurance / yr
- $473 – $860
Fire risk 3/10 · Minor
- Est. fire insurance / yr
- $691 – $1,283
Heat risk 2/10 · Minimal
- Hot days now (above 95°F)
- 7 days/yr
- Hot days in 30 yrs
- 16 days/yr
Wind risk 1/10 · Minimal
- Chance of severe wind over 30 yrs
- —
Air-quality risk 2/10 · Minimal
- Unhealthy air days now
- 1 days/yr
- Unhealthy air days in 30 yrs
- 1 days/yr
Risk factors via First Street. Map © Google.
Why this score? — see what drove the B+ grade
The composite is a weighted blend of 9 inputs, each scored 0–100. Each bar is that input's sub-score; the figure is the points it added to the 100-point composite (weight × sub-score).
- Cash flow +27.5/30.0
- ARV discount +15.0/15.0
- DSCR +9.7/10.0
- 1% rule +9.0/10.0
- Schools +6.8/10.0
- Rent growth +2.5/5.0
- Livability +2.5/5.0
- Condition / age +2.5/5.0
- Appreciation +0.0/10.0
$214,900
🖨 Deal sheet 📄 Offer letter ✓ Due diligence
Listing remarks MLS
Hard to find Ranch. 3 bedroom, 1.5 bath. Half acre lot. Anderson Windows in 2011. Furnace A/C in 2011. New Roof in 2019. New Garage Doors in 2012. Driveway in 2012. Partially finished basement. Kitchen appliances stay. large family room with fireplace. More! Note: Penfield Schools. Tax Star $750.86. This is a Must See Home!
Key facts
- 1st floor living
- Ranch style
- 0.46 acre lot
Tags
Property features AI
Exterior
- Parking: Attached garage with electricity and storage; Garage door opener; Driveway; Approximately 2.5 garage spaces
- Utilities: Electricity connected (circuit breakers); Public water connected; Sewer connected; Cable available
- Home design: Single-story home; Existing construction; Entry level on main floor; City street frontage
- Construction: Composite siding; Copper plumbing; Architectural shingle roof; Block foundation; Built previously (existing)
- Exterior features: Blacktop driveway; Fully fenced yard; Open patio; Patio; Porch
Interior
- Kitchen: Gas oven; Gas range; Microwave; Range hood; Dishwasher; Refrigerator; Disposal; Exhaust fan
- Bedrooms: Three main-level bedrooms; Bedroom on main level
- Flooring: Laminate; Varies
- Bathrooms: One full bathroom; One half bathroom; Two main-level bathrooms
- Heating & cooling: Gas forced-air heating; Central air conditioning
- Interior features: Cathedral ceilings; Separate/formal dining room; Entrance foyer; Separate/formal living room; Home office; Pantry; Sliding glass doors; Window treatments; Programmable thermostat; Drapes; Thermal windows
- Laundry & utility: Washer; Dryer; Laundry located in basement; Gas water heater
Neighborhood map
What this means for you Summary
Snapshot
- This is a 3-bed/1.5-bath single-family listed at $215k.
Deal economics
- At list price, monthly cash flow is $637 ($8k/yr) — positive.
- The deal already cash-flows at list — no discount required.
- Meets the 1% rule at list price ($3k rent vs $215k).
- Cap rate 9.8% vs local median 3.2% in Gananda — top-decile yield for the area; either an underpriced asset or a hidden risk that comps aren't pricing in. Stress-test before assuming the spread holds.
Location & tenants
- Location reads: area grade B — affects rentability + tenant quality, not the cash-flow math above.
- Penfield Central School District (suburban): math 77% / reading 79% proficiency, ranked #67 of 590 in NY (top 11%) — strong family-tenant draw, lease renewals of 3-5y typical; only 11% free/reduced lunch — higher-income household profile.
- Market conditions: 49 active listings in the ZIP; 1 comparable units currently listed for rent nearby; 259 units permitted in Wayne County in 2024 (90 in 5+ unit buildings).
Forward outlook
- Local home prices are declining (-3.0%/yr); year-one equity from $1k of loan paydown is wiped out by about $6k of value loss. Plan a longer hold.
- Wayne County population projected at -24% by 2050 — secular population decline; favor cash flow + early exit over multi-decade hold.
- At projected returns (-3.0% appreciation + 3.0% rent growth), your $60k cash investment doubles in ~9 years — after that, you're playing with house money.
Negotiation context
- Only 10 days on market — expect competitive offers; lowballing is unlikely to land.
- 3 sale attempts since 13y ago with the ask held roughly flat each time — persistent listings suggest the price (not the market) is what's stuck; bring a comps-based counter.
- Current owner paid $150k; 43% above their basis — modest negotiation headroom, anchor on the comps not their cost.
Risks & watch-outs
- Watch-outs: property tax is 2.9% of price.
Questions for the listing agent
- Built in 1967 — when were the roof, HVAC, electrical panel, plumbing, and water heater last replaced?
- Property tax is high relative to price — has the assessment been appealed recently, and will the sale trigger a re-assessment?
- Is there a deadline driving the sale (1031 exchange, divorce, estate, relocation)? That informs how much negotiation room exists.
- What's the average days-on-market for RENTAL listings here right now (not sales)? A rising rental-DOM trend means longer vacancies and softer asking-rent achievability than the comps imply.
- What's the recent tenant-quality profile in this submarket — average credit score on applications, eviction rate, late-payment / NSF rate, and stable-employment percentage? A property-management company in the area should have these aggregated.
- How much new for-sale + rental construction is in the pipeline within 1–3 miles? Heavy new supply typically softens prices + rents 12–24 months out; constrained supply supports both.
Investment metrics
- 1% rule
- 1.40% ✓
- Cap rate
- 9.85%
- Cash-on-cash
- 12.70%
- DSCR
- 1.57
- GRM
- 6.0
CMA / ARV
- ARV (on-the-fly)
- $308,140
- Comps found
- 8
Show comp detail 8 sales within ~0.75 mi
| Address | Dist | Beds/Ba | Sqft | Sold | Price | $/sf | Match |
|---|---|---|---|---|---|---|---|
| 294 Mildahn Rd | 0.31mi | 3/2.5 | 1,440 (+1%) | 1mo | $3,000 | $2 | 79 |
| 361 Rt-441 | 0.32mi | 3/1.0 | 1,421 (+0%) | 18mo | $213,000 | $150 | 68 |
| 201 Plumegrass Run | 0.34mi | 3/2.5 | 1,463 (+3%) | 12mo | $340,000 | $232 | 64 |
| 365 Highfield Dr | 0.27mi | 3/1.5 | 1,476 (+4%) | 23mo | $271,500 | $184 | 62 |
| 447 Walworth Penfield Rd | 0.51mi | 3/1.5 | 1,364 (-4%) | 21mo | $250,000 | $183 | 52 |
| 562 Crows Nest Ln | 0.71mi | 3/1.0 | 1,560 (+10%) | 1mo | $338,000 | $217 | 48 |
| 441 Parkside Trl | 0.68mi | 3/2.5 | 1,556 (+10%) | 1mo | $412,500 | $265 | 48 |
| 3504 Scenic Way | 0.51mi | 3/3.5 | 1,578 (+11%) | 4mo | $355,000 | $225 | 46 |
Match score weights: distance 35% · size 25% · config 20% · recency 20%. Top-matched comps best support the ARV.
Projected returns pro-forma
-3.0% appreciation · 3.0% rent growth · sell at horizon
- IRR
- 2.6%
- Equity multiple
- 1.10×
- Total profit
- $5,932
- Equity at exit
- $32,042
- IRR
- 12.2%
- Equity multiple
- 1.97×
- Total profit
- $58,194
- Equity at exit
- $18,581
Cash invested: $60,172 (down + closing). Projections, not guarantees.
Landlord ↔ Tenant lean methodology
- Overall (STATE)
- 15 Strongly Tenant-Friendly
- State New York
- 15 Strongly Tenant-Friendly · D+10
- County
- — inherits STATE
- City
- — inherits STATE
ZIP-level market 14502
- Home prices YoY
- -26.0%
- Active inventory
- 49
- Price-to-rent
- 6.0×
Monthly cashflow live
- Estimated rent
- $3,000 medium interval (Pro) →
- Mortgage (P&I)
- −$1,127
- Tax from tax record
- −$517 /mo · $6,200/yr
- Insurance
- −$90
- HOA
- −$0
- Vacancy / Maint / Mgmt
- −$630
- Net cashflow
- $637
Break-even live
UW: 25.0% down · 7.5% · 30yr · 1.5% tax · 5.0% vac · 8.0% maint · 8.0% mgmt
Financing live
Cash to close
- Down payment
- $53,725
- Closing costs
- $6,447
- Reserves months
- —
- Total cash needed
- —
Loan-product check · same deal, 3 products live
Conventional
25% down · 7.5% · 30yr
- Down + closing
- —
- Monthly P&I
- —
- Monthly cashflow
- —
- DSCR
- —
- Eligible?
- —
Personal DTI + credit; lowest rate.
DSCR
20% down · 8.5% · 30yr
- Down + closing
- —
- Monthly P&I
- —
- Monthly cashflow
- —
- DSCR
- —
- Eligible?
- —
No personal income docs; deal must DSCR.
Hard money
10% down · 12.0% · 12mo
- Down + closing
- —
- Monthly P&I
- —
- Monthly cashflow
- —
- DSCR
- —
- Eligible?
- —
Short-term bridge; refi at stabilization.
Rent comps 1 comps
| Address | Beds | Baths | Sqft | Rent | $/sqft | DOM | Units | Dist |
|---|---|---|---|---|---|---|---|---|
| 294 Mildahn Rd Walworth, NY | 3.0 | 2.5 | 1440 | $3,000 | $2.08 | 19d | 1 | 0.29mi |
Listing history 8 events
-
2026-06-16status $214,900 Pending 10 DOM
-
2026-06-15days on market $214,900 Active 10 DOM
-
2026-06-13days on market $214,900 Active 8 DOM
-
2026-06-10days on market $214,900 Active 5 DOM
-
2026-06-09days on market $214,900 Active 4 DOM
-
2026-06-09days on market $214,900 Active 3 DOM
-
2026-06-07remarks 683-char remark
-
2026-06-07$214,900 Active 2 DOM
ⓘ Source: listings_history table (triggers on properties + properties_extension) + one-shot
backfill from property_details.listing_events for pre-trigger history.
Tax reassessment forecast NY · Partial reset (capped growth)
- Current annual tax
- $6,200 · $517/mo
- Projected year-2 tax
- $6,200 · $517/mo
- Expected delta
- $0/yr ($0/mo · 0.0%)
ⓘ Screening estimate from a state-policy table — verify with the county assessor before closing.
Climate risk First Street
- Flood 1/10 Low FEMA zone X · 0% chance over 30 yrs
- Wildfire 3/10 Moderate
- Heat 2/10 Low 7 d/yr ≥95°F today · 16 d/yr by 30 yrs out
- Wind 1/10 Low
- Air quality 2/10 Low 1 unhealthy d/yr today · 1 by 30 yrs out
Nearby sold comps map
Loading sold comps map…
Walkable amenities ~0.75 mi
Loading nearby amenities…
Taxation est. · year 1
- Rental income
- $36,000
- − Mortgage interest
- −$12,038
- − Property taxes
- −$6,200
- − Insurance
- −$1,074
- − Repairs & maintenance
- −$2,880
- − Management
- −$2,880
- − Depreciation
- −$6,252
- Taxable income
- $4,676
- Est. tax owed @ 24.0%
- −$1,122
- After-tax cash flow
- $6,519/yr
For passive investors: Depreciation is non-cash, so a rental often shows a tax loss while cash-flowing — sheltering income. Rental losses are passive: they offset passive income freely, and up to $25,000/yr can offset ordinary (W-2) income if you actively participate and your MAGI is under $100k (phasing out to $0 by $150k); unused losses carry forward. On sale, claimed depreciation is recaptured at up to 25%, and gains may owe capital-gains tax (a 1031 exchange can defer both). Figures are a year-1 estimate at your 24.0% rate — not tax advice; consult a CPA.
Schools (NCES district)
- District
- Penfield Central School District
- NCES district ID
- 3622710
- Math proficiency
- 77% ▼ -3.00%
- Reading proficiency
- 79% ▲ 10.00%
- Median HH income
- $74,802
- Composite
- 68.37/100
- National rank
- #347
- State rank
- #67 of 590 in NY
Livability — Gananda
No livability data for this city. (Only ~50 U.S. cities are tracked.)
Census & demographics
- Census place
- Gananda, NY
- Population (ZIP)
- 10,515
Population outlook (Wayne County) Hauer SSP2
- Today (2025)
- 85,662 people
- By 2030
- 81,945 · -4.3%
- By 2040
- 73,735 · -13.9%
- By 2050
- 65,029 · -24.1%
- By 2075
- 47,451 · -44.6%
- By 2100
- 31,574 · -63.1%
Race, ethnicity, and origin ACS 2023
- Neighborhood character
- Predominantly White (88%)
- Race & ethnicity
- White 88% Two or more races 6% Asian 3% Black 1% Hispanic / Latino 1%
- Common ancestry
- Iranian 8% Romanian 7% Lithuanian 3%
- Foreign-born
- 4% · China, South Korea
- Languages at home
- 94% English-only · Russian/Polish/Slavic 2% Other Indo-European 2% Chinese 1%
Political lean MEDSL · Wayne
- 2024 margin
- Strong R (+23.1) · D 38.5% · R 61.5%
- 2008→2024 swing
- -13.2pp toward R · 2008: -9.9pp · 2024: -23.1pp
- All cycles
- 2024: R+23.1 2020: R+19.6 2016: R+26.1 2012: R+9.3 2008: R+9.9
Not yet ingested
- Civics
- —
Market trends
- HPI YoY
- ▼ -85.25%
- Current HPI
- 242.5682
- Rent YoY
- —
- Metro
- —
- State GDP YoY
- ▲ 2.60%
- F500 in state
- 92
Industry mix (Fortune 500 HQ in NY)
| Industry | F500 HQs | Revenue |
|---|---|---|
| Financial Services | 10 | $950B |
|
||
| Consumer Goods | 9 | $162B |
|
||
| Insurance | 4 | $225B |
|
||
| Telecommunications | 2 | $144B |
|
||
| Pharmaceuticals | 2 | $112B |
|
||
| Media / Entertainment | 2 | $69B |
|
||
Price history
+86.9% since first listed12 events — show timeline
- 2026-06-05 Listed $214,900 UNYREIS
- 2019-09-30 Sold (Public Records) $149,900 Public Records
- 2019-09-30 Sold (Public Records) $149,900 Public Records
- 2019-09-30 Sold (MLS) $149,900 UNYREIS
- 2019-08-07 Pending — UNYREIS
- 2019-08-02 Contingent — UNYREIS
- 2019-07-31 Price Changed $149,900 UNYREIS
- 2019-07-16 Listed $150,000 UNYREIS
- 2013-06-06 Sold (Public Records) $121,000 Public Records
- 2013-06-05 Sold (MLS) $121,000 UNYREIS
- 2013-03-03 Listed $122,500 UNYREIS
- 2009-09-02 Sold (Public Records) $115,000 Public Records
Property tax history
+4.0%/yrLatest (2025): $6,200 · -2.3% YoY. Source: county tax records.
Cash-flow waterfall
monthlySold comps — $/sqft
last 12 mo · ≤1 miLoading sold comps…