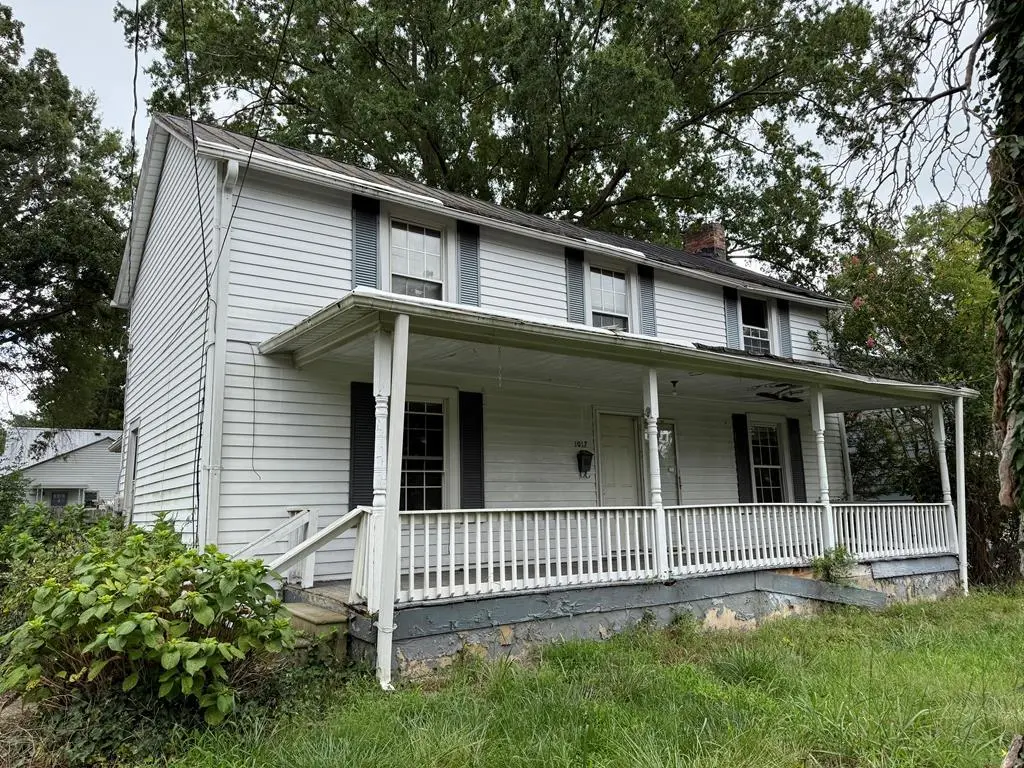
1017 South Ave · South Boston, VA
Flood risk 1/10 · Minimal
- FEMA flood zone
- X (unshaded)
- Chance of flooding over 30 yrs
- 0.0%
- Est. flood insurance / yr
- $507 – $1,088
Fire risk 3/10 · Minor
- Est. fire insurance / yr
- $666 – $1,236
Heat risk 6/10 · Moderate
- Hot days now (above 104°F)
- 7 days/yr
- Hot days in 30 yrs
- 17 days/yr
Wind risk 4/10 · Minor
- Chance of severe wind over 30 yrs
- 16.0%
Air-quality risk 2/10 · Minimal
- Unhealthy air days now
- 1 days/yr
- Unhealthy air days in 30 yrs
- 1 days/yr
Risk factors via First Street. Map © Google.
Why this score? — see what drove the B- grade
The composite is a weighted blend of 9 inputs, each scored 0–100. Each bar is that input's sub-score; the figure is the points it added to the 100-point composite (weight × sub-score).
- Cash flow +30.0/30.0
- 1% rule +10.0/10.0
- DSCR +10.0/10.0
- ARV discount +7.5/15.0
- Livability +3.7/5.0
- Schools +3.6/10.0
- Rent growth +2.5/5.0
- Condition / age +2.5/5.0
- Appreciation +0.0/10.0
$55,000
🖨 Deal sheet (PDF) 📄 Offer letter ✓ Due diligence
Listing remarks MLS
Investor special in the heart of downtown South Boston! Spacious 4BR/2BA home with approx. 2,556 sq. ft. Prime in-town location within walking distance to shops & dining. Ready for renovation - ideal for flip, rental or restoration. Sold AS IS. This home will not qualify for government backed loans in its current condition.
Key facts
- Ready for renovation
- In-town location
- Sold as is
Tags
Neighborhood map
What this means for you Summary
Snapshot
- This is a 3-bed/2.0-bath single-family listed at $55k.
Deal economics
- At list price, monthly cash flow is $825 ($10k/yr) — positive.
- The deal already cash-flows at list — no discount required.
- Meets the 1% rule at list price ($1k rent vs $55k).
- Recommended offer: $52k (6.0% below list) — sets the bar for market timing.
- Cap rate 24.3% vs local median 5.0% in South Boston — top-decile yield for the area; either an underpriced asset or a hidden risk that comps aren't pricing in. Stress-test before assuming the spread holds.
Location & tenants
- Location reads 74/100 on livability (#147 in VA, #4,742 nationally) — a middle-class / working-renter tenant base. Strengths: cost of living A+, housing A+, health & safety A+; Watch: crime F, amenities F, commute F.
- Halifax County Public School District (town): math 29% / reading 59% proficiency, ranked #116 of 131 in VA (top 88%) — families likely to look elsewhere, expect single-tenant / working-renter base with shorter leases.
- Zoned schools: South Boston Elementary (math 18% / reading 48%, grade F, #986 of 1,108 statewide, top 89%, 666 students, 93% FRL); Halifax County Middle (math 27% / reading 60%, grade D, #285 of 342 statewide, top 84%, 925 students, 92% FRL); Halifax County High (math 40% / reading 69%, grade C-, #281 of 319 statewide, top 90%, 1,397 students, 90% FRL) — zoned schools average 92% FRL vs 58% district-wide (34 pts higher); higher-poverty schools than district average — tighter screening recommended.
- Market conditions: 66 active listings in the ZIP; 97 units permitted in Halifax County in 2024 (0 in 5+ unit buildings).
Forward outlook
- Local home prices are declining (-3.0%/yr); year-one equity from $380 of loan paydown is wiped out by about $2k of value loss. Plan a longer hold.
- Halifax County population projected at -22% by 2050 — secular population decline; favor cash flow + early exit over multi-decade hold.
- At projected returns (-3.0% appreciation + 3.0% rent growth), your $15k cash investment doubles in ~2 years — after that, you're playing with house money.
Negotiation context
- It's been on market 65 days — a 6% lower offer ($52k) is reasonable based on typical stale-listing flexibility.
- 5 sale attempts since 3y ago with the ask held roughly flat each time — persistent listings suggest the price (not the market) is what's stuck; bring a comps-based counter.
Risks & watch-outs
- Watch-outs: built in 1950 — expect roof / HVAC / electrical / plumbing capex.
- Climate carrying-cost: extreme-heat days projected 7→17/yr by 2055 (HVAC capex compounding) — expect insurance premiums to compound above CPI over the hold.
Questions for the listing agent
- It's been on market 65 days. Have you received any prior offers? Is the seller open to a 6% concession, seller financing, or rate buy-down credit?
- Built in 1950 — when were the roof, HVAC, electrical panel, plumbing, and water heater last replaced?
- Why hasn't it sold? Are there any deal-killer items the seller is aware of (foundation, flood, title, zoning, code violations)?
- Is there a deadline driving the sale (1031 exchange, divorce, estate, relocation)? That informs how much negotiation room exists.
- Schools are B-rated — typically a magnet for longer-tenancy family renters. What's the average tenant stay here, and is there a school-zone premium baked into asking?
- Crime grade is F in this area — have there been break-ins, vandalism, or insurance claims at this property in the last 3 years? What carrier currently insures it and at what premium?
- What's the average days-on-market for RENTAL listings here right now (not sales)? A rising rental-DOM trend means longer vacancies and softer asking-rent achievability than the comps imply.
- What's the recent tenant-quality profile in this submarket — average credit score on applications, eviction rate, late-payment / NSF rate, and stable-employment percentage? A property-management company in the area should have these aggregated.
- How much new for-sale + rental construction is in the pipeline within 1–3 miles? Heavy new supply typically softens prices + rents 12–24 months out; constrained supply supports both.
Investment metrics
- 1% rule
- 2.69% ✓
- Cap rate
- 24.29%
- Cash-on-cash
- 64.27%
- DSCR
- 3.86
- GRM
- 3.1
CMA / ARV
- ARV (median comp)
- $202,177
- List price
- $55,000
- Delta
- -72.80%
- Verdict
- UNDERPRICED
- Comps
- 20 within 1.0 mi
Show comp detail 5 sales within ~0.75 mi
| Address | Dist | Beds/Ba | Sqft | Sold | Price | $/sf | Match |
|---|---|---|---|---|---|---|---|
| 1801 Wilkerson St | 0.20mi | 3/3.0 | 2,479 (-3%) | 14mo | $367,500 | $148 | 70 |
| 1204 South Ave Unit - | 0.11mi | 3/2.5 | 2,225 (-13%) | 7mo | $227,000 | $102 | 66 |
| 506 Bellwood Ln | 0.65mi | 4/2.5 (+1) | 2,489 (-3%) | 11mo | $327,450 | $132 | 50 |
| 1316 Hodges St | 0.18mi | 4/1.5 (+1) | 2,286 (-11%) | 21mo | $247,000 | $108 | 49 |
| 4505 Brentwood Dr | 0.72mi | 4/2.5 (+1) | 2,250 (-12%) | 2mo | $368,000 | $164 | 38 |
Match score weights: distance 35% · size 25% · config 20% · recency 20%. Top-matched comps best support the ARV.
Projected returns pro-forma
-3.0% appreciation · 3.0% rent growth · sell at horizon
- IRR
- 63.4%
- Equity multiple
- 3.83×
- Total profit
- $43,619
- Equity at exit
- $8,201
- IRR
- 67.8%
- Equity multiple
- 7.86×
- Total profit
- $105,629
- Equity at exit
- $4,755
Cash invested: $15,400 (down + closing). Projections, not guarantees.
Landlord ↔ Tenant lean methodology
- Overall (STATE)
- 55 Moderately Landlord-Leaning
- State Virginia
- 55 Moderately Landlord-Leaning · D+2
- County
- — inherits STATE
- City
- — inherits STATE
ZIP-level market 24592
- Home prices YoY
- -27.0%
- Active inventory
- 66
- Price-to-rent
- 3.1×
Monthly cashflow live
- Estimated rent
- $1,482 medium interval (Pro) →
- Mortgage (P&I)
- −$288
- Tax from tax record
- −$34 /mo · $412/yr
- Insurance
- −$23
- HOA
- −$0
- Lot rent
- −$0
- Vacancy / Maint / Mgmt
- −$311
- Net cashflow
- $825
Break-even live
Sensitivity live
| Price | -10% $856 | -5% $840 | +0% $825 | +5% $809 | +10% $794 |
|---|---|---|---|---|---|
| Rent | -10% $708 | -5% $766 | +0% $825 | +5% $883 | +10% $942 |
| Rate | -1.0pp $852 | -0.5pp $839 | base $825 | +0.5pp $811 | +1.0pp $796 |
UW: 25.0% down · 7.5% · 30yr · 1.5% tax · 5.0% vac · 8.0% maint · 8.0% mgmt
Financing live
Cash to close
- Down payment
- $13,750
- Closing costs
- $1,650
- Reserves months
- —
- Total cash needed
- —
Loan-product check · same deal, 3 products live
Conventional
25% down · 7.5% · 30yr
- Down + closing
- —
- Monthly P&I
- —
- Monthly cashflow
- —
- DSCR
- —
- Eligible?
- —
Personal DTI + credit; lowest rate.
DSCR
20% down · 8.5% · 30yr
- Down + closing
- —
- Monthly P&I
- —
- Monthly cashflow
- —
- DSCR
- —
- Eligible?
- —
No personal income docs; deal must DSCR.
Hard money
10% down · 12.0% · 12mo
- Down + closing
- —
- Monthly P&I
- —
- Monthly cashflow
- —
- DSCR
- —
- Eligible?
- —
Short-term bridge; refi at stabilization.
Listing history 29 events
-
2026-06-15days on market $55,000 Active 65 DOM
-
2026-06-15days on market $55,000 Active 64 DOM
-
2026-06-13days on market $55,000 Active 63 DOM
-
2026-06-12days on market $55,000 Active 62 DOM
-
2026-06-09days on market $55,000 Active 59 DOM
-
2026-06-08days on market $55,000 Active 58 DOM
-
2026-06-08days on market $55,000 Active 57 DOM
-
2026-06-07days on market $55,000 Active 56 DOM
-
2026-06-03days on market $55,000 Active 53 DOM
-
2026-06-02days on market $55,000 Active 52 DOM
-
2026-06-01days on market $55,000 Active 51 DOM
-
2026-05-31days on market $55,000 Active 50 DOM
-
2026-04-12$55,000 Active 332-char remark
Show marketing remark (332 chars)
Investor special in the heart of downtown South Boston! Spacious 4BR/2BA home with approx. 2,556 sq. ft. Prime in-town location within walking distance to shops & dining. Ready for renovation - ideal for flip, rental or restoration. Sold AS IS. This home will not qualify for government backed loans in its current condition.
-
2026-01-26price $55,000
-
2025-12-03status Active
-
2025-12-03price $65,000
-
2025-10-14status Pending
-
2025-09-11historical Active Under Contract
-
2025-08-21$60,000 Active
-
2025-02-26soldstatus $48,000 Closed
-
2025-02-26soldstatus $48,000
-
2025-01-31status Pending
-
2024-12-18price $44,900
-
2024-11-14price $49,900
-
2024-10-10price $54,900
-
2024-09-06price $59,900
-
2024-08-06price $64,900
-
2024-07-03$70,700 Active
-
2023-10-25$82,725 Active
ⓘ Source: listings_history table (triggers on properties + properties_extension) + one-shot
backfill from property_details.listing_events for pre-trigger history.
Tax reassessment forecast VA · Resets to sale price
- Current annual tax
- $412 · $34/mo
- Projected year-2 tax
- $451 · $38/mo
- Expected delta
- +$39/yr (+$3/mo · 9.4%)
ⓘ Screening estimate from a state-policy table — verify with the county assessor before closing.
Climate risk First Street
- Flood 1/10 Low FEMA zone X (unshaded) · 0% chance over 30 yrs
- Wildfire 3/10 Moderate
- Heat 6/10 Major 7 d/yr ≥104°F today · 17 d/yr by 30 yrs out
- Wind 4/10 Moderate 16% chance of damaging wind over 30 yrs
- Air quality 2/10 Low 1 unhealthy d/yr today · 1 by 30 yrs out
Nearby sold comps map
Loading sold comps map…
Walkable amenities ~0.75 mi
Loading nearby amenities…
Taxation est. · year 1
- Rental income
- $17,779
- − Mortgage interest
- −$3,081
- − Property taxes
- −$412
- − Insurance
- −$275
- − Repairs & maintenance
- −$1,422
- − Management
- −$1,422
- − Depreciation
- −$1,600
- Taxable income
- $9,566
- Est. tax owed @ 24.0%
- −$2,296
- After-tax cash flow
- $7,601/yr
For passive investors: Depreciation is non-cash, so a rental often shows a tax loss while cash-flowing — sheltering income. Rental losses are passive: they offset passive income freely, and up to $25,000/yr can offset ordinary (W-2) income if you actively participate and your MAGI is under $100k (phasing out to $0 by $150k); unused losses carry forward. On sale, claimed depreciation is recaptured at up to 25%, and gains may owe capital-gains tax (a 1031 exchange can defer both). Figures are a year-1 estimate at your 24.0% rate — not tax advice; consult a CPA.
Schools (NCES district)
- District
- Halifax County Public School District
- NCES district ID
- 5101770
- Math proficiency
- 29% ▼ -51.00%
- Reading proficiency
- 59% ▼ -15.00%
- Median HH income
- $36,137
- Composite
- 36.36/100
- National rank
- #4687
- State rank
- #116 of 131 in VA
Livability — South Boston
- Score
- 74/100
- State rank
- #147
- US rank
- #4742
Category grades
Schools grade is shown separately in the Schools card above.
Census & demographics
- Census place
- South Boston, VA
- Population (ZIP)
- 14,411
Population outlook (Halifax County) Hauer SSP2
- Today (2025)
- 32,892 people
- By 2030
- 31,438 · -4.4%
- By 2040
- 28,350 · -13.8%
- By 2050
- 25,553 · -22.3%
- By 2075
- 20,217 · -38.5%
- By 2100
- 14,645 · -55.5%
Race, ethnicity, and origin ACS 2023
- Neighborhood character
- Majority White (55%)
- Race & ethnicity
- White 55% Black 40% Two or more races 3% Hispanic / Latino 1%
- Common ancestry
- Iranian 1% Romanian 1%
- Foreign-born
- 2% · Canada
- Languages at home
- 98% English-only · Spanish 1% Other Indo-European 1%
Political lean MEDSL · Halifax
- 2024 margin
- Strong R (+21.1) · D 39.1% · R 60.2%
- 2008→2024 swing
- -18.2pp toward R · 2008: -2.8pp · 2024: -21.1pp
- All cycles
- 2024: R+21.1 2020: R+15.1 2016: R+16.6 2012: R+5.6 2008: R+2.8
Not yet ingested
- Civics
- —
Market trends
- HPI YoY
- ▼ -70.37%
- Current HPI
- 190.3767
- Rent YoY
- —
- Metro
- —
- State GDP YoY
- ▲ 2.40%
- F500 in state
- 50
Industry mix (Fortune 500 HQ in VA)
| Industry | F500 HQs | Revenue |
|---|---|---|
| Aerospace / Defense | 4 | $236B |
|
||
| Technology / Defense | 3 | $32B |
|
||
| Financial Services | 2 | $176B |
|
||
| Utilities | 2 | $27B |
|
||
| Insurance | 2 | $25B |
|
||
| Technology | 2 | $15B |
|
||
Price history
-33.5% since first listed17 events — show timeline
- 2026-04-12 Listed $55,000 SPLLAR
- 2026-01-26 Price Changed $55,000 SPLLAR
- 2025-12-03 Relisted — SPLLAR
- 2025-12-03 Price Changed $65,000 SPLLAR
- 2025-10-14 Pending — SPLLAR
- 2025-09-11 Contingent — SPLLAR
- 2025-08-21 Listed $60,000 SPLLAR
- 2025-02-26 Sold (Public Records) $48,000 Public Records
- 2025-02-26 Sold (MLS) $48,000 LMLS
- 2025-01-31 Pending — LMLS
- 2024-12-18 Price Changed $44,900 LMLS
- 2024-11-14 Price Changed $49,900 LMLS
- 2024-10-10 Price Changed $54,900 LMLS
- 2024-09-06 Price Changed $59,900 LMLS
- 2024-08-06 Price Changed $64,900 LMLS
- 2024-07-03 Listed $70,700 LMLS
- 2023-10-25 Listed $82,725 DRRAR
Property tax history
+0.3%/yrLatest (2025): $412 · +0.0% YoY. Source: county tax records.
Cash-flow waterfall
monthlySold comps — $/sqft
last 12 mo · ≤1 miLoading sold comps…