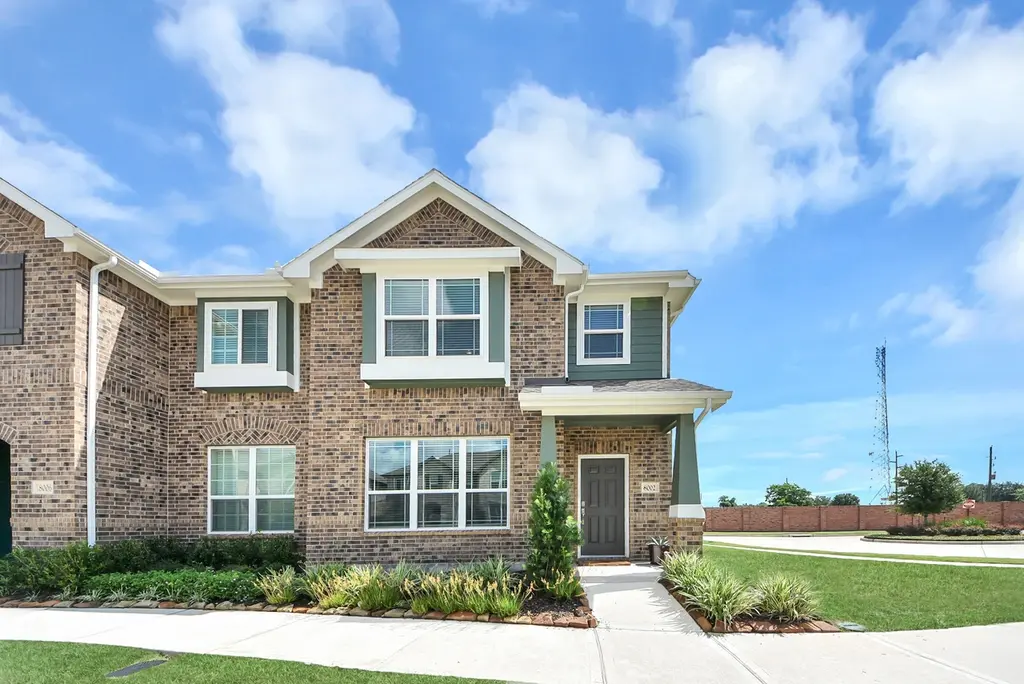
8002 Scanlan Oak · Sienna, TX
Flood risk No data
- FEMA flood zone
- —
- Chance of flooding over 30 yrs
- —
- Est. flood insurance / yr
- —
Fire risk No data
- Est. fire insurance / yr
- —
Heat risk No data
- Hot days now (above threshold)
- —
- Hot days in 30 yrs
- —
Wind risk No data
- Chance of severe wind over 30 yrs
- —
Air-quality risk No data
- Unhealthy air days now
- —
- Unhealthy air days in 30 yrs
- —
Risk factors via First Street. Map © Google.
Why this score? — see what drove the B grade
The composite is a weighted blend of 9 inputs, each scored 0–100. Each bar is that input's sub-score; the figure is the points it added to the 100-point composite (weight × sub-score).
- Cash flow +25.3/30.0
- ARV discount +13.1/15.0
- 1% rule +9.0/10.0
- DSCR +8.3/10.0
- Schools +4.5/10.0
- Appreciation +4.2/10.0
- Rent growth +2.5/5.0
- Livability +2.5/5.0
- Condition / age +2.5/5.0
$305,000
🖨 Deal sheet (PDF) 📄 Offer letter ✓ Due diligence
Listing remarks
WOW check out this lightly lived in 2 year young beauty! Mr & Mrs Clean live here as it shows like a model! You're greeted by Craftsman feel exterior as you enter a very spacius 21x18 living/dining combo room. Hard surface wood look flooring downstairs, high ceilings + an extra window in dining area adds light as this home has an end unit location-neighbor on only 1 side! Dining is large enough for either a round or rectangular table. Living is very spacious & will hold all of your furniture needs! Amazing kitchen opens to living/dining & has a brkfst bar too! Granite, stainless steel appliances, gas cooktop/oven & tons of cabinet/counter space spoil you in this kit
Key facts
- Dual sinks
- End unit location
- Tile flooring
Tags
Property features AI
Finance
- HOA & community: Sienna Community Association; Annual association fee; Association amenities include: basketball court, clubhouse, dog park, fitness center, grounds maintenance, picnic area, playground, park, pool, tennis courts; Association fee covers common areas and grounds maintenance
Exterior
- Parking: Attached 2-car garage; Additional parking; Garage with door opener
- Security: Owned security system; Smoke detectors
- Utilities: Public water; Public sewer
- Home design: Residential property; 2 stories; Faces south; Full ownership
- Construction: Built in 2024; Brick, cement siding, and wood siding exterior; Composition roof; Slab foundation; Built by History Maker Homes
- Exterior features: Tennis court(s); Front yard; Side yard; Concrete road surface; Association pool
Interior
- Kitchen: Dishwasher; Gas cooktop; Gas oven; Oven; Microwave; Disposal; Pantry; Breakfast bar
- Bedrooms: Primary bedroom (second floor) — 16x14; Bedroom (second floor) — 12x10; Bedroom (second floor) — 12x10
- Flooring: Carpet; Plank; Tile; Vinyl
- Bathrooms: 2 full bathrooms; 1 half bathroom; Primary bathroom (second floor) — 16x6; Bathroom (second floor) — 10x5; Half bath (first floor) — 9x4
- Heating & cooling: Central heating (gas) with zoned controls; Central air conditioning (electric) with zoned controls
- Interior features: Breakfast bar; Double vanity; Granite counters; High ceilings; Kitchen/family room combo; Primary bedroom with bath; Pantry; Tub/shower combination; Vanity; Window treatments; Ceiling fans; Living/dining room; Programmable thermostat; Low emissivity windows; Window coverings; Ventilation
- Laundry & utility: Laundry in utility room (second floor) — 7x5; Washer; Dryer; Electric dryer hookup; Tankless water heater
Neighborhood map
What this means for you Summary
Snapshot
- This is a 3-bed/2.5-bath townhouse listed at $305k.
Deal economics
- At list price, monthly cash flow is $694 ($8k/yr) — positive.
- The deal already cash-flows at list — no discount required.
- Meets the 1% rule at list price ($4k rent vs $305k).
- Cap rate 9.0% vs local median 3.3% in Sienna — top-decile yield for the area; either an underpriced asset or a hidden risk that comps aren't pricing in. Stress-test before assuming the spread holds.
Location & tenants
- Location reads: area grade B — affects rentability + tenant quality, not the cash-flow math above.
- Fort Bend ISD (suburban): math 44% / reading 53% proficiency, ranked #140 of 826 in TX (top 17%) — families likely to look elsewhere, expect single-tenant / working-renter base with shorter leases.
- Zoned schools: Scanlan Oaks El (math 68% / reading 67%, grade B+, #189 of 4,322 statewide, top 5%, 1,052 students, 31% FRL); Ronald Thornton Middle (math 40% / reading 52%, grade D+, #462 of 1,662 statewide, top 28%, 1,529 students, 41% FRL); Ridge Point H S (math 61% / reading 69%, grade B, #198 of 1,632 statewide, top 12%, 3,170 students, 31% FRL) — zoned schools at 34% FRL track the district average.
- Market conditions: Rents soft (-0.1%/yr); 1234 active listings in the ZIP; 3 comparable units currently listed for rent nearby; rentals at typical pace (median 25d on market — plan ~3-4 weeks tenant-placement turnaround); high-income renter base; 12,093 units permitted in Fort Bend County in 2024 (815 in 5+ unit buildings).
- This rent runs 40% of the median local income ($129k/yr) — at the standard rent-burdened threshold; future hikes will face affordability resistance.
Forward outlook
- Local home prices are declining (-1.7%/yr); year-one equity from $2k of loan paydown is wiped out by about $5k of value loss. Plan a longer hold.
- Fort Bend County population projected at +75% by 2050 — long-run rental-demand tailwind backs the buy-and-hold thesis.
Negotiation context
- Only 12 days on market — expect competitive offers; lowballing is unlikely to land.
Risks & watch-outs
- Watch-outs: property tax is 2.9% of price.
Questions for the listing agent
- Property tax is high relative to price — has the assessment been appealed recently, and will the sale trigger a re-assessment?
- What does the HOA fee cover, when was the last increase, and are there any pending special assessments or reserve-fund shortfalls?
- Is there a deadline driving the sale (1031 exchange, divorce, estate, relocation)? That informs how much negotiation room exists.
- What's the average days-on-market for RENTAL listings here right now (not sales)? A rising rental-DOM trend means longer vacancies and softer asking-rent achievability than the comps imply.
- What's the recent tenant-quality profile in this submarket — average credit score on applications, eviction rate, late-payment / NSF rate, and stable-employment percentage? A property-management company in the area should have these aggregated.
- How much new for-sale + rental construction is in the pipeline within 1–3 miles? Heavy new supply typically softens prices + rents 12–24 months out; constrained supply supports both.
Investment metrics
- 1% rule
- 1.40% ✓
- Cap rate
- 9.02%
- Cash-on-cash
- 9.75%
- DSCR
- 1.43
- GRM
- 6.0
CMA / ARV
- ARV (on-the-fly)
- $348,480
- Comps found
- 11
Show comp detail 11 sales within ~0.75 mi
| Address | Dist | Beds/Ba | Sqft | Sold | Price | $/sf | Match |
|---|---|---|---|---|---|---|---|
| 8033 Scanlan Oak | 0.04mi | 3/2.5 | 1,778 (-8%) | 2mo | $299,000 | $168 | 83 |
| 8001 Scanlan Trl | 0.08mi | 3/2.5 | 1,747 (-10%) | 2mo | $284,990 | $163 | 78 |
| 8033 Scanlan Trl | 0.09mi | 3/2.5 | 1,736 (-10%) | 3mo | $285,000 | $164 | 76 |
| 8022 Scanlan Trce | 0.11mi | 3/2.5 | 1,723 (-11%) | 12mo | $293,000 | $170 | 67 |
| 8006 Scanlan Oak -bldg 17 | 0.01mi | 3/2.5 | 1,745 (-10%) | 20mo | $314,990 | $181 | 66 |
| 8002 Scanlan Oak -17 | 0.00mi | 3/2.5 | 1,766 (-9%) | 23mo | $317,990 | $180 | 66 |
| 2930 Scanlan Meadow - Bldg 19 | 0.03mi | 3/2.5 | 1,743 (-10%) | 20mo | $309,990 | $178 | 66 |
| 2910 Scanlan Meadow - Bldg 18 | 0.04mi | 3/2.5 | 1,745 (-10%) | 21mo | $319,990 | $183 | 64 |
| 8018 Scanlan Oak | 0.02mi | 3/2.5 | 1,747 (-10%) | 23mo | $314,990 | $180 | 64 |
| 8014 Scanlan Oak -17 | 0.01mi | 3/2.5 | 1,700 (-12%) | 22mo | $319,990 | $188 | 61 |
| 8051 Scanlan Trace - Bldg 1 | 0.16mi | 3/2.5 | 1,743 (-10%) | 21mo | $328,490 | $188 | 59 |
Match score weights: distance 35% · size 25% · config 20% · recency 20%. Top-matched comps best support the ARV.
Projected returns pro-forma
-1.67% appreciation · 0.0% rent growth · sell at horizon
- IRR
- 0.0%
- Equity multiple
- 1.00×
- Total profit
- $74
- Equity at exit
- $63,967
- IRR
- 4.0%
- Equity multiple
- 1.31×
- Total profit
- $26,157
- Equity at exit
- $59,249
Cash invested: $85,400 (down + closing). Projections, not guarantees.
Landlord ↔ Tenant lean methodology
- Overall (STATE)
- 87 Strongly Landlord-Friendly
- State Texas
- 87 Strongly Landlord-Friendly · R+5
- County
- — inherits STATE
- City
- — inherits STATE
ZIP-level market 77459
- Home prices YoY
- -0.8%
- Rents YoY
- -0.1%
- Active inventory
- 1234
- Price-to-rent
- 6.0×
Monthly cashflow live
- Estimated rent
- $4,260 medium interval (Pro) →
- Mortgage (P&I)
- −$1,599
- Tax from tax record
- −$730 /mo · $8,762/yr
- Insurance
- −$127
- HOA
- −$215
- Lot rent
- −$0
- Vacancy / Maint / Mgmt
- −$895
- Net cashflow
- $694
Break-even live
Sensitivity live
| Price | -10% $866 | -5% $780 | +0% $694 | +5% $607 | +10% $521 |
|---|---|---|---|---|---|
| Rent | -10% $357 | -5% $526 | +0% $694 | +5% $862 | +10% $1,030 |
| Rate | -1.0pp $847 | -0.5pp $771 | base $694 | +0.5pp $615 | +1.0pp $534 |
UW: 25.0% down · 7.5% · 30yr · 1.5% tax · 5.0% vac · 8.0% maint · 8.0% mgmt
Financing live
Cash to close
- Down payment
- $76,250
- Closing costs
- $9,150
- Reserves months
- —
- Total cash needed
- —
Loan-product check · same deal, 3 products live
Conventional
25% down · 7.5% · 30yr
- Down + closing
- —
- Monthly P&I
- —
- Monthly cashflow
- —
- DSCR
- —
- Eligible?
- —
Personal DTI + credit; lowest rate.
DSCR
20% down · 8.5% · 30yr
- Down + closing
- —
- Monthly P&I
- —
- Monthly cashflow
- —
- DSCR
- —
- Eligible?
- —
No personal income docs; deal must DSCR.
Hard money
10% down · 12.0% · 12mo
- Down + closing
- —
- Monthly P&I
- —
- Monthly cashflow
- —
- DSCR
- —
- Eligible?
- —
Short-term bridge; refi at stabilization.
Rent comps 3 comps
| Address | Beds | Baths | Sqft | Rent | $/sqft | DOM | Units | Dist |
|---|---|---|---|---|---|---|---|---|
| 2142 Ironwood Pass Dr Missouri City, TX | 4.0 | 3.0 | 2140 | $6,000 | $2.80 | 0d | 1 | 1.25mi |
| 1714 Forest Mist Dr Missouri City, TX | 3.0 | 3.0 | 1979 | $3,000 | $1.52 | 46d | 1 | 1.36mi |
| 8719 Fox Trail Dr Missouri City, TX | 4.0 | 3.5 | 2143 | $6,000 | $2.80 | 24d | 1 | 1.43mi |
HOA detail
- Monthly dues
- $215 · $2,580/yr
- Likely covers
- gas
Listing history 8 events
-
2026-06-22days on market $305,000 Active 12 DOM
-
2026-06-21days on market $305,000 Active 11 DOM
-
2026-06-18days on market $305,000 Active 8 DOM
-
2026-06-17days on market $305,000 Active 7 DOM
-
2026-06-16days on market $305,000 Active 6 DOM
-
2026-06-15days on market $305,000 Active 5 DOM
-
2026-06-13remarks 683-char remark
-
2026-06-13$305,000 Active 3 DOM
ⓘ Source: listings_history table (triggers on properties + properties_extension) + one-shot
backfill from property_details.listing_events for pre-trigger history.
Tax reassessment forecast TX · Resets to sale price
- Current annual tax
- $8,762 · $730/mo
- Projected year-2 tax
- $8,762 · $730/mo
- Expected delta
- $0/yr ($0/mo · 0.0%)
ⓘ Screening estimate from a state-policy table — verify with the county assessor before closing.
Nearby sold comps map
Loading sold comps map…
Walkable amenities ~0.75 mi
Loading nearby amenities…
Taxation est. · year 1
- Rental income
- $51,121
- − Mortgage interest
- −$17,085
- − Property taxes
- −$8,762
- − Insurance
- −$1,525
- − Repairs & maintenance
- −$4,090
- − Management
- −$4,090
- − HOA
- −$2,580
- − Depreciation
- −$8,873
- Taxable income
- $4,118
- Est. tax owed @ 24.0%
- −$988
- After-tax cash flow
- $7,338/yr
For passive investors: Depreciation is non-cash, so a rental often shows a tax loss while cash-flowing — sheltering income. Rental losses are passive: they offset passive income freely, and up to $25,000/yr can offset ordinary (W-2) income if you actively participate and your MAGI is under $100k (phasing out to $0 by $150k); unused losses carry forward. On sale, claimed depreciation is recaptured at up to 25%, and gains may owe capital-gains tax (a 1031 exchange can defer both). Figures are a year-1 estimate at your 24.0% rate — not tax advice; consult a CPA.
Schools (NCES district)
- District
- Fort Bend ISD
- NCES district ID
- 4819650
- Math proficiency
- 44% ▼ -15.00%
- Reading proficiency
- 53% ▼ -4.00%
- Median HH income
- $82,360
- Composite
- 44.61/100
- National rank
- #2779
- State rank
- #140 of 826 in TX
Livability — Sienna
No livability data for this city. (Only ~50 U.S. cities are tracked.)
Census & demographics
- Census place
- Sienna, TX
- County
- Fort Bend County · 836,777 people
- Metro
- Houston-The Woodlands-Sugar Land, TX
- Population (ZIP)
- 84,221
- Household income
- $129,151
- Rent vs Own
- Severe rent burden
- 1004.0
Population outlook (Fort Bend County) Hauer SSP2
- Today (2025)
- 1,004,526 people
- By 2030
- 1,153,104 · +14.8%
- By 2040
- 1,453,718 · +44.7%
- By 2050
- 1,753,781 · +74.6%
- By 2075
- 2,455,772 · +144.5%
- By 2100
- 2,930,528 · +191.7%
Race, ethnicity, and origin ACS 2023
- Neighborhood character
- Highly diverse neighborhood (Simpson 0.75)
- Race & ethnicity
- White 34% Black 26% Asian 22% Hispanic / Latino 13% Two or more races 10%
- Hispanic origin (detail)
- Mexican 7%
- Common ancestry
- Lithuanian 2% Slovak 1% Italian 1%
- Foreign-born
- 21% · Canada, China, Vietnam
- Languages at home
- 73% English-only · Other Asian/Pacific 8% Spanish 7% Other Indo-European 5%
Political lean MEDSL · Fort Bend
- 2024 margin
- Toss-up / Even · D 49.5% · R 47.9% · Other 2.6%
- 2008→2024 swing
- +4.0pp toward D · 2008: -2.4pp · 2024: 1.6pp
- All cycles
- 2024: D+1.6 2020: D+10.6 2016: D+6.6 2012: R+6.8 2008: R+2.4
Not yet ingested
- Civics
- —
Market trends
- HPI YoY
- ▼ -1.67%
- Current HPI
- 212.3573
- Rent YoY
- ▼ -0.15%
- Metro
- Houston-The Woodlands-Sugar Land, TX
- State GDP YoY
- ▲ 3.95%
- F500 in state
- 110
Industry mix (Fortune 500 HQ in TX)
| Industry | F500 HQs | Revenue |
|---|---|---|
| Energy | 16 | $1,198B |
|
||
| Technology | 5 | $198B |
|
||
| Engineering / Construction | 4 | $72B |
|
||
| Energy Services | 3 | $60B |
|
||
| Utilities | 3 | $41B |
|
||
| Healthcare | 2 | $330B |
|
||
Price history
1 event — show timeline
- 2026-06-10 Listed $305,000 HARMLS
Cash-flow waterfall
monthlySold comps — $/sqft
last 12 mo · ≤1 miLoading sold comps…