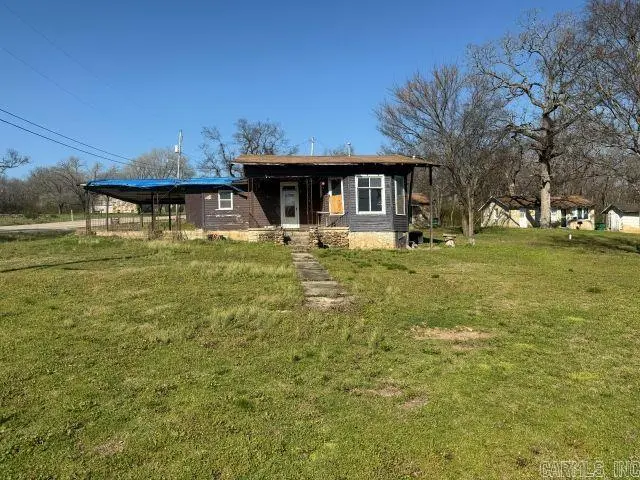
400 N Estes Ave · Yellville, AR
Flood risk 1/10 · Minimal
- FEMA flood zone
- —
- Chance of flooding over 30 yrs
- 0.0%
- Est. flood insurance / yr
- —
Fire risk 6/10 · Moderate
- Est. fire insurance / yr
- $1,499 – $2,785
Heat risk 5/10 · Moderate
- Hot days now (above 106°F)
- 7 days/yr
- Hot days in 30 yrs
- 21 days/yr
Wind risk 2/10 · Minimal
- Chance of severe wind over 30 yrs
- 1.0%
Air-quality risk 1/10 · Minimal
- Unhealthy air days now
- 0 days/yr
- Unhealthy air days in 30 yrs
- 0 days/yr
Risk factors via First Street. Map © Google.
Why this score? — see what drove the B- grade
The composite is a weighted blend of 9 inputs, each scored 0–100. Each bar is that input's sub-score; the figure is the points it added to the 100-point composite (weight × sub-score).
- Cash flow +30.0/30.0
- 1% rule +10.0/10.0
- DSCR +10.0/10.0
- ARV discount +7.5/15.0
- Schools +3.2/10.0
- Livability +3.2/5.0
- Rent growth +2.5/5.0
- Condition / age +1.0/5.0
- Appreciation +0.0/10.0
$30,000
🖨 Deal sheet 📄 Offer letter ✓ Due diligence
Listing remarks MLS
Looking for a fixer upper this is it! Home has been rewired and is ready to make it what you vision. Could reconfigure to add a second bath. Walking distance to churches, banks, grocery store, post office and the school. Schedule a showing today!
Key facts
- Walking distance
- Rewired
- 2 parking spots
Tags
Neighborhood map
What this means for you Summary
Snapshot
- This is a 3-bed/1.0-bath single-family listed at $30k. Condition is rated poor.
Deal economics
- At list price, monthly cash flow is $586 ($7k/yr) — positive.
- The deal already cash-flows at list — no discount required.
- Meets the 1% rule at list price ($1k rent vs $30k).
- Recommended offer: $27k (9.0% below list) — sets the bar for market timing.
- Cap rate 29.7% vs local median 3.2% in Yellville — top-decile yield for the area; either an underpriced asset or a hidden risk that comps aren't pricing in. Stress-test before assuming the spread holds.
Location & tenants
- Location reads 64/100 on livability (#181 in AR) — a middle-class / working-renter tenant base. Strengths: cost of living A+, health & safety A+, housing A; Watch: schools D-, amenities F, commute F.
- Yellville-Summit School District (rural): math 41% / reading 37% proficiency, ranked #90 of 238 in AR (top 38%) — families likely to look elsewhere, expect single-tenant / working-renter base with shorter leases.
- Market conditions: 166 active listings in the ZIP; 237 units permitted in Marion County in 2024 (0 in 5+ unit buildings).
Forward outlook
- Local home prices are declining (-3.0%/yr); year-one equity from $207 of loan paydown is wiped out by about $900 of value loss. Plan a longer hold.
- Marion County population projected at -24% by 2050 — secular population decline; favor cash flow + early exit over multi-decade hold.
- At projected returns (-3.0% appreciation + 3.0% rent growth), your $8k cash investment doubles in ~2 years — after that, you're playing with house money.
Negotiation context
- It's been on market 91 days — a 9% lower offer ($27k) is reasonable based on typical stale-listing flexibility.
- 5 sale attempts; this cycle's ask has dropped $9k (23%) from the opening price — seller is motivated, your offer sets the floor, not the list.
Risks & watch-outs
- Climate carrying-cost: major wildfire risk; extreme-heat days projected 7→21/yr by 2055 (HVAC capex compounding) — expect insurance premiums to compound above CPI over the hold.
Questions for the listing agent
- It's been on market 91 days. Have you received any prior offers? Is the seller open to a 9% concession, seller financing, or rate buy-down credit?
- Have any recent inspections been done? Can we get a copy of the seller's disclosures and any deferred-maintenance estimates?
- Why hasn't it sold? Are there any deal-killer items the seller is aware of (foundation, flood, title, zoning, code violations)?
- Is there a deadline driving the sale (1031 exchange, divorce, estate, relocation)? That informs how much negotiation room exists.
- Schools are D-rated, which usually means shorter tenancies and higher turnover. Who's the typical renter profile here, and what's been the actual vacancy rate?
- What's the average days-on-market for RENTAL listings here right now (not sales)? A rising rental-DOM trend means longer vacancies and softer asking-rent achievability than the comps imply.
- What's the recent tenant-quality profile in this submarket — average credit score on applications, eviction rate, late-payment / NSF rate, and stable-employment percentage? A property-management company in the area should have these aggregated.
- How much new for-sale + rental construction is in the pipeline within 1–3 miles? Heavy new supply typically softens prices + rents 12–24 months out; constrained supply supports both.
Investment metrics
- 1% rule
- 3.35% ✓
- Cap rate
- 29.72%
- Cash-on-cash
- 83.67%
- DSCR
- 4.72
- GRM
- 2.5
CMA / ARV
- ARV (median comp)
- $115,472
- List price
- $30,000
- Delta
- -74.02%
- Verdict
- UNDERPRICED
- Comps
- 20 within 1.0 mi
Show comp detail 11 sales within ~0.75 mi
| Address | Dist | Beds/Ba | Sqft | Sold | Price | $/sf | Match |
|---|---|---|---|---|---|---|---|
| 315 Gear St | 0.18mi | 3/1.0 | 1,084 (+4%) | 0mo | $53,000 | $49 | 84 |
| 102 E 5th St | 0.14mi | 2/1.0 (-1) | 1,049 (+1%) | 6mo | $140,000 | $133 | 83 |
| 502 Hackberry Ln | 0.11mi | 3/1.0 | 1,148 (+10%) | 1mo | $140,000 | $122 | 77 |
| 816 N Wickersham St | 0.40mi | 3/1.5 | 1,080 (+4%) | 12mo | $150,000 | $139 | 63 |
| 901 N Estes Ave | 0.43mi | 3/2.0 | 1,113 (+7%) | 4mo | $140,000 | $126 | 61 |
| 608 Estes Ave | 0.23mi | 2/1.0 (-1) | 896 (-14%) | 3mo | $117,000 | $131 | 58 |
| 1001 N Estes Ave | 0.52mi | 3/1.5 | 1,152 (+11%) | 2mo | $140,000 | $122 | 54 |
| 416 N Berry St | 0.25mi | 2/2.0 (-1) | 978 (-6%) | 20mo | $122,500 | $125 | 52 |
| 909 N Panther Ave | 0.53mi | 3/1.0 | 1,125 (+8%) | 13mo | $135,000 | $120 | 51 |
| 1013 Broadway | 0.57mi | 3/2.0 | 1,187 (+14%) | 2mo | $165,000 | $139 | 44 |
| 1112 N Estes Ave | 0.71mi | 3/2.0 | 1,190 (+14%) | 16mo | $165,000 | $139 | 26 |
Match score weights: distance 35% · size 25% · config 20% · recency 20%. Top-matched comps best support the ARV.
Projected returns pro-forma
-3.0% appreciation · 3.0% rent growth · sell at horizon
- IRR
- 84.0%
- Equity multiple
- 4.86×
- Total profit
- $32,457
- Equity at exit
- $4,473
- IRR
- 87.3%
- Equity multiple
- 10.09×
- Total profit
- $76,358
- Equity at exit
- $2,594
Cash invested: $8,400 (down + closing). Projections, not guarantees.
Landlord ↔ Tenant lean methodology
- Overall (STATE)
- 92 Strongly Landlord-Friendly
- State Arkansas
- 92 Strongly Landlord-Friendly · R+14
- County
- — inherits STATE
- City
- — inherits STATE
ZIP-level market 72687
- Home prices YoY
- -31.7%
- Active inventory
- 166
- Price-to-rent
- 2.5×
Monthly cashflow live
- Estimated rent
- $1,004 medium interval (Pro) →
- Mortgage (P&I)
- −$157
- Tax est. 1.5%
- −$38 /mo · $450/yr
- Insurance
- −$12
- HOA
- −$0
- Vacancy / Maint / Mgmt
- −$211
- Net cashflow
- $586
Break-even live
UW: 25.0% down · 7.5% · 30yr · 1.5% tax · 5.0% vac · 8.0% maint · 8.0% mgmt
Financing live
Cash to close
- Down payment
- $7,500
- Closing costs
- $900
- Reserves months
- —
- Total cash needed
- —
Loan-product check · same deal, 3 products live
Conventional
25% down · 7.5% · 30yr
- Down + closing
- —
- Monthly P&I
- —
- Monthly cashflow
- —
- DSCR
- —
- Eligible?
- —
Personal DTI + credit; lowest rate.
DSCR
20% down · 8.5% · 30yr
- Down + closing
- —
- Monthly P&I
- —
- Monthly cashflow
- —
- DSCR
- —
- Eligible?
- —
No personal income docs; deal must DSCR.
Hard money
10% down · 12.0% · 12mo
- Down + closing
- —
- Monthly P&I
- —
- Monthly cashflow
- —
- DSCR
- —
- Eligible?
- —
Short-term bridge; refi at stabilization.
Listing history 24 events
-
2026-06-19days on market $30,000 Active 91 DOM
-
2026-06-18days on market $30,000 Active 90 DOM
-
2026-06-17days on market $30,000 Active 89 DOM
-
2026-06-16days on market $30,000 Active 88 DOM
-
2026-06-15days on market $30,000 Active 87 DOM
-
2026-06-14days on market $30,000 Active 85 DOM
-
2026-06-12days on market $30,000 Active 84 DOM
-
2026-06-09days on market $30,000 Active 81 DOM
-
2026-06-08statusdays on market $30,000 Active 80 DOM
-
2026-06-07days on market $30,000 Price Change 79 DOM
-
2026-06-07days on market $30,000 Price Change 78 DOM
-
2026-06-04days on market $30,000 Price Change 75 DOM
-
2026-06-02pricestatusdays on market $30,000 Price Change 74 DOM
-
2026-06-01days on market $35,000 Active 73 DOM
-
2026-05-31days on market $35,000 Active 72 DOM
-
2026-05-31days on market $35,000 Active 71 DOM
-
2026-05-08price $35,000 246-char remark
Show marketing remark (246 chars)
Looking for a fixer upper this is it! Home has been rewired and is ready to make it what you vision. Could reconfigure to add a second bath. Walking distance to churches, banks, grocery store, post office and the school. Schedule a showing today!
-
2026-05-08price $35,000
Show marketing remark (246 chars)
Looking for a fixer upper this is it! Home has been rewired and is ready to make it what you vision. Could reconfigure to add a second bath. Walking distance to churches, banks, grocery store, post office and the school. Schedule a showing today!
-
2026-03-19$39,000 Active
-
2026-03-18$39,000 New Listing 246-char remark
Show marketing remark (246 chars)
Looking for a fixer upper this is it! Home has been rewired and is ready to make it what you vision. Could reconfigure to add a second bath. Walking distance to churches, banks, grocery store, post office and the school. Schedule a showing today!
-
2026-03-18$39,000 Active 246-char remark
Show marketing remark (246 chars)
Looking for a fixer upper this is it! Home has been rewired and is ready to make it what you vision. Could reconfigure to add a second bath. Walking distance to churches, banks, grocery store, post office and the school. Schedule a showing today!
-
2025-04-16status Active
-
2025-03-06$34,900 Active
ⓘ Source: listings_history table (triggers on properties + properties_extension) + one-shot
backfill from property_details.listing_events for pre-trigger history.
Climate risk First Street
- Flood 1/10 Low 0% chance over 30 yrs
- Wildfire 6/10 Major
- Heat 5/10 Major 7 d/yr ≥106°F today · 21 d/yr by 30 yrs out
- Wind 2/10 Low 100% chance of damaging wind over 30 yrs
- Air quality 1/10 Low 0 unhealthy d/yr today · 0 by 30 yrs out
Nearby sold comps map
Loading sold comps map…
Walkable amenities ~0.75 mi
Loading nearby amenities…
Taxation est. · year 1
- Rental income
- $12,046
- − Mortgage interest
- −$1,680
- − Property taxes
- −$450
- − Insurance
- −$150
- − Repairs & maintenance
- −$964
- − Management
- −$964
- − Depreciation
- −$873
- Taxable income
- $6,965
- Est. tax owed @ 24.0%
- −$1,672
- After-tax cash flow
- $5,357/yr
For passive investors: Depreciation is non-cash, so a rental often shows a tax loss while cash-flowing — sheltering income. Rental losses are passive: they offset passive income freely, and up to $25,000/yr can offset ordinary (W-2) income if you actively participate and your MAGI is under $100k (phasing out to $0 by $150k); unused losses carry forward. On sale, claimed depreciation is recaptured at up to 25%, and gains may owe capital-gains tax (a 1031 exchange can defer both). Figures are a year-1 estimate at your 24.0% rate — not tax advice; consult a CPA.
Condition & rehab AI · 12 photos
This fixer-upper requires extensive repairs and updates to improve its condition and value. Significant work is needed on the roof, exterior siding, flooring, interior walls, windows, HVAC, and foundation. Landscaping and painting would also enhance the home's curb appeal and rental value.
Repairs flagged
- Major roof — Severe weathering and potential leaks
- Major exterior siding — Worn and damaged
- Major flooring — Damaged and uneven
- Major interior walls/paint — Peeling and damaged
- Major windows — Old and possibly leaky
- Major HVAC/mechanicals — Old and possibly inoperable
- Major foundation/structure — Unstable
Value-add opportunities
- Resale New roof — New roof would significantly improve the home's appearance and value
- Resale New exterior siding — New siding would improve the home's curb appeal and value
- Resale New flooring — New flooring would improve the home's appearance and value
- Resale Painting — Painting would improve the home's appearance and value
- Resale New windows — New windows would improve the home's energy efficiency and value
- Resale New HVAC system — New HVAC system would improve the home's comfort and value
- Resale Foundation repair — Foundation repair would improve the home's structural integrity and value
- Both Landscaping — Landscaping would improve the home's curb appeal and rental value
Renovation cost estimate screening
| Repair item | Severity | Est. cost |
|---|---|---|
| roof · Severe weathering and potential leaks | Major | $15,000–50,000 |
| exterior siding · Worn and damaged | Major | $15,000–50,000 |
| flooring · Damaged and uneven | Major | $15,000–50,000 |
| interior walls/paint · Peeling and damaged | Major | $15,000–50,000 |
| windows · Old and possibly leaky | Major | $15,000–50,000 |
| HVAC/mechanicals · Old and possibly inoperable | Major | $15,000–50,000 |
| foundation/structure · Unstable | Major | $15,000–50,000 |
| Total estimated repair cost · 7 items | $105,000–350,000 |
Value-add ROI direction
- Resale New roof — New roof would significantly improve the home's appearance and value ↑
- Resale New exterior siding — New siding would improve the home's curb appeal and value ↑
- Resale New flooring — New flooring would improve the home's appearance and value ↑
- Resale Painting — Painting would improve the home's appearance and value ↑
- Resale New windows — New windows would improve the home's energy efficiency and value ↑
- Resale New HVAC system — New HVAC system would improve the home's comfort and value ↑
- Resale Foundation repair — Foundation repair would improve the home's structural integrity and value ↑
- Both Landscaping — Landscaping would improve the home's curb appeal and rental value ↑
ⓘ Cost ranges are severity-bucket heuristics (US national rule-of-thumb). Get contractor quotes + a written scope before underwriting a rehab budget.
Schools (NCES district)
- District
- Yellville-Summit School District
- NCES district ID
- 0514490
- Math proficiency
- 41% ▼ -5.00%
- Reading proficiency
- 37% ▼ -2.00%
- Median HH income
- $32,234
- Composite
- 31.99/100
- National rank
- #5834
- State rank
- #90 of 238 in AR
Livability — Yellville
- Score
- 64/100
- State rank
- #181
- US rank
- #14569
Category grades
Schools grade is shown separately in the Schools card above.
Census & demographics
- Census place
- Yellville, AR
- Population (ZIP)
- 6,724
Population outlook (Marion County) Hauer SSP2
- Today (2025)
- 14,979 people
- By 2030
- 14,153 · -5.5%
- By 2040
- 12,546 · -16.2%
- By 2050
- 11,386 · -24.0%
- By 2075
- 9,663 · -35.5%
- By 2100
- 8,248 · -44.9%
Race, ethnicity, and origin ACS 2023
- Neighborhood character
- Predominantly White (91%)
- Race & ethnicity
- White 91% Two or more races 5% Hispanic / Latino 4%
- Common ancestry
- Lithuanian 5% Romanian 4% Slovak 4%
- Foreign-born
- 2% · Canada
- Languages at home
- 98% English-only · Spanish 1%
Political lean MEDSL · Marion
- 2024 margin
- Solid R (+60.2) · D 19.1% · R 79.3% · Other 1.5%
- 2008→2024 swing
- -30.3pp toward R · 2008: -29.9pp · 2024: -60.2pp
- All cycles
- 2024: R+60.2 2020: R+56.7 2016: R+55.1 2012: R+39.1 2008: R+29.9
Not yet ingested
- Civics
- —
Market trends
- HPI YoY
- ▼ -74.78%
- Current HPI
- 161.0917
- Rent YoY
- —
- Metro
- —
- State GDP YoY
- ▲ 3.80%
- F500 in state
- 10
Industry mix (Fortune 500 HQ in AR)
| Industry | F500 HQs | Revenue |
|---|---|---|
| Retail | 1 | $681B |
|
||
| Food / Agriculture | 1 | $53B |
|
||
| Retail / Energy | 1 | $22B |
|
||
| Transportation / Logistics | 1 | $12B |
|
||
| Energy | 1 | $4B |
|
||
Price history
+0.3% since first listed8 events — show timeline
- 2026-05-08 Price Changed $35,000 CARMLS
- 2026-05-08 Price Changed $35,000 MHMLS
- 2026-05-08 Price Changed $35,000 NWARMLS
- 2026-03-19 Listed $39,000 NWARMLS
- 2026-03-18 Listed $39,000 MHMLS
- 2026-03-18 Listed $39,000 CARMLS
- 2025-04-16 Relisted — MHMLS
- 2025-03-06 Listed $34,900 MHMLS
Cash-flow waterfall
monthlySold comps — $/sqft
last 12 mo · ≤1 miLoading sold comps…