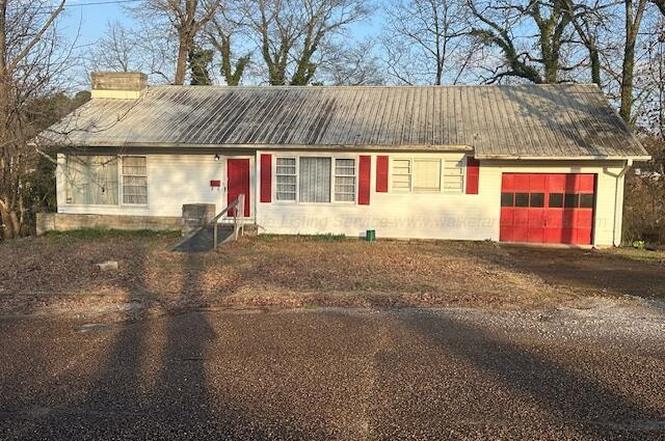
2309 10th Ave · Haleyville, AL
Flood risk 1/10 · Minimal
- FEMA flood zone
- X (unshaded)
- Chance of flooding over 30 yrs
- 0.0%
- Est. flood insurance / yr
- $473 – $860
Fire risk 4/10 · Minor
- Est. fire insurance / yr
- $916 – $1,700
Heat risk 6/10 · Moderate
- Hot days now (above 106°F)
- 7 days/yr
- Hot days in 30 yrs
- 20 days/yr
Wind risk 6/10 · Moderate
- Chance of severe wind over 30 yrs
- 27.0%
Air-quality risk 2/10 · Minimal
- Unhealthy air days now
- 1 days/yr
- Unhealthy air days in 30 yrs
- 1 days/yr
Risk factors via First Street. Map © Google.
Why this score? — see what drove the A- grade
The composite is a weighted blend of 9 inputs, each scored 0–100. Each bar is that input's sub-score; the figure is the points it added to the 100-point composite (weight × sub-score).
- Cash flow +30.0/30.0
- ARV discount +15.0/15.0
- DSCR +10.0/10.0
- 1% rule +9.2/10.0
- Appreciation +7.3/10.0
- Livability +3.0/5.0
- Schools +2.8/10.0
- Rent growth +2.5/5.0
- Condition / age +2.2/5.0
$79,900
🖨 Deal sheet 📄 Offer letter ✓ Due diligence
Listing remarks
Opportunity is knocking with this 3 bedroom, 1.5 bathroom fixer-upper located in a super convenient, in-town location! If you've been searching for your next renovation project or investment property, this one is full of potential. Inside, you'll find a spacious layout featuring hardwood floors and a cozy fireplace that could easily become the centerpiece of a beautifully updated living space. With a little vision and TLC, this home could truly shine. Situated right in the heart of town, you'll love the easy access to shopping, dining, schools, and everyday conveniences. Whether you're looking to flip, rent, or create your dream home, this property offers the perfect canvas. Bring your idea
Key facts
- Cozy fireplace
- Hardwood floors
- Spacious layout
Tags
Neighborhood map
What this means for you Summary
Snapshot
- This is a 3-bed/2.0-bath single-family listed at $80k. Condition is rated fair.
Deal economics
- At list price, monthly cash flow is $343 ($4k/yr) — positive.
- The deal already cash-flows at list — no discount required.
- Meets the 1% rule at list price ($1k rent vs $80k).
- Recommended offer: $79k (1.5% below list) — sets the bar for market timing.
- Cap rate 11.4% vs local median 4.5% in Haleyville — top-decile yield for the area; either an underpriced asset or a hidden risk that comps aren't pricing in. Stress-test before assuming the spread holds.
Location & tenants
- Location reads 60/100 on livability (#287 in AL) — a middle-class / working-renter tenant base. Strengths: cost of living A+, housing A+; Watch: schools D-, crime F, amenities F.
- Haleyville City (rural): math 23% / reading 47% proficiency, ranked #50 of 129 in AL (top 39%) — families likely to look elsewhere, expect single-tenant / working-renter base with shorter leases.
- Market conditions: 77 active listings in the ZIP; 1 units permitted in Winston County in 2024 (0 in 5+ unit buildings).
Forward outlook
- In year one you build about $4k of equity ($552 loan paydown + $4k appreciation (4.6% local appreciation)).
- Winston County population projected at -20% by 2050 — secular population decline; favor cash flow + early exit over multi-decade hold.
- At projected returns (4.6% appreciation + 3.0% rent growth), your $22k cash investment doubles in ~3 years — after that, you're playing with house money.
- By year 8, paydown + projected appreciation supports a ~$32k cash-out refi (75% LTV) — recoverable capital for the next deal without selling this one.
Negotiation context
- It's been on market 25 days — a 2% lower offer ($79k) is reasonable based on typical stale-listing flexibility.
Risks & watch-outs
- Watch-outs: built in 1958 — expect roof / HVAC / electrical / plumbing capex.
- Climate carrying-cost: major wind risk, 27% chance of damaging wind over 30y; extreme-heat days projected 7→20/yr by 2055 (HVAC capex compounding) — expect insurance premiums to compound above CPI over the hold.
Questions for the listing agent
- Have any recent inspections been done? Can we get a copy of the seller's disclosures and any deferred-maintenance estimates?
- Built in 1958 — when were the roof, HVAC, electrical panel, plumbing, and water heater last replaced?
- Is there a deadline driving the sale (1031 exchange, divorce, estate, relocation)? That informs how much negotiation room exists.
- Schools are D-rated, which usually means shorter tenancies and higher turnover. Who's the typical renter profile here, and what's been the actual vacancy rate?
- Crime grade is F in this area — have there been break-ins, vandalism, or insurance claims at this property in the last 3 years? What carrier currently insures it and at what premium?
- What's the average days-on-market for RENTAL listings here right now (not sales)? A rising rental-DOM trend means longer vacancies and softer asking-rent achievability than the comps imply.
- What's the recent tenant-quality profile in this submarket — average credit score on applications, eviction rate, late-payment / NSF rate, and stable-employment percentage? A property-management company in the area should have these aggregated.
- How much new for-sale + rental construction is in the pipeline within 1–3 miles? Heavy new supply typically softens prices + rents 12–24 months out; constrained supply supports both.
Investment metrics
- 1% rule
- 1.42% ✓
- Cap rate
- 11.44%
- Cash-on-cash
- 18.39%
- DSCR
- 1.82
- GRM
- 5.9
CMA / ARV
- ARV (on-the-fly)
- $137,256
- Comps found
- 4
Show comp detail 4 sales within ~0.75 mi
| Address | Dist | Beds/Ba | Sqft | Sold | Price | $/sf | Match |
|---|---|---|---|---|---|---|---|
| 2514 15th Ave | 0.36mi | 2/2.0 (-1) | 1,420 (-11%) | 7mo | $62,900 | $44 | 54 |
| 2325 15th Ave | 0.37mi | 4/1.5 (+1) | 1,809 (+13%) | 5mo | $182,000 | $101 | 49 |
| 2922 11th Ave | 0.72mi | 3/2.0 | 1,488 (-7%) | 12mo | $35,000 | $24 | 45 |
| 1801 27th St | 0.73mi | 3/2.0 | 1,457 (-9%) | 20mo | $125,000 | $86 | 35 |
Match score weights: distance 35% · size 25% · config 20% · recency 20%. Top-matched comps best support the ARV.
Projected returns pro-forma
4.62% appreciation · 3.0% rent growth · sell at horizon
- IRR
- 28.1%
- Equity multiple
- 2.72×
- Total profit
- $38,558
- Equity at exit
- $43,463
- IRR
- 27.2%
- Equity multiple
- 5.41×
- Total profit
- $98,578
- Equity at exit
- $73,552
Cash invested: $22,372 (down + closing). Projections, not guarantees.
Landlord ↔ Tenant lean methodology
- Overall (STATE)
- 90 Strongly Landlord-Friendly
- State Alabama
- 90 Strongly Landlord-Friendly · R+15
- County
- — inherits STATE
- City
- — inherits STATE
ZIP-level market 35565
- Home prices YoY
- 3.5%
- Active inventory
- 77
- Price-to-rent
- 5.9×
Monthly cashflow live
- Estimated rent
- $1,133 medium interval (Pro) →
- Mortgage (P&I)
- −$419
- Tax est. 1.5%
- −$100 /mo · $1,198/yr
- Insurance
- −$33
- HOA
- −$0
- Vacancy / Maint / Mgmt
- −$238
- Net cashflow
- $343
Break-even live
UW: 25.0% down · 7.5% · 30yr · 1.5% tax · 5.0% vac · 8.0% maint · 8.0% mgmt
Financing live
Cash to close
- Down payment
- $19,975
- Closing costs
- $2,397
- Reserves months
- —
- Total cash needed
- —
Loan-product check · same deal, 3 products live
Conventional
25% down · 7.5% · 30yr
- Down + closing
- —
- Monthly P&I
- —
- Monthly cashflow
- —
- DSCR
- —
- Eligible?
- —
Personal DTI + credit; lowest rate.
DSCR
20% down · 8.5% · 30yr
- Down + closing
- —
- Monthly P&I
- —
- Monthly cashflow
- —
- DSCR
- —
- Eligible?
- —
No personal income docs; deal must DSCR.
Hard money
10% down · 12.0% · 12mo
- Down + closing
- —
- Monthly P&I
- —
- Monthly cashflow
- —
- DSCR
- —
- Eligible?
- —
Short-term bridge; refi at stabilization.
Listing history 2 events
-
2026-03-31status Pending
-
2026-03-05$79,900 Active
ⓘ Source: listings_history table (triggers on properties + properties_extension) + one-shot
backfill from property_details.listing_events for pre-trigger history.
Climate risk First Street
- Flood 1/10 Low FEMA zone X (unshaded) · 0% chance over 30 yrs
- Wildfire 4/10 Moderate
- Heat 6/10 Major 7 d/yr ≥106°F today · 20 d/yr by 30 yrs out
- Wind 6/10 Major 27% chance of damaging wind over 30 yrs
- Air quality 2/10 Low 1 unhealthy d/yr today · 1 by 30 yrs out
Nearby sold comps map
Loading sold comps map…
Walkable amenities ~0.75 mi
Loading nearby amenities…
Taxation est. · year 1
- Rental income
- $13,594
- − Mortgage interest
- −$4,476
- − Property taxes
- −$1,198
- − Insurance
- −$400
- − Repairs & maintenance
- −$1,088
- − Management
- −$1,088
- − Depreciation
- −$2,324
- Taxable income
- $3,021
- Est. tax owed @ 24.0%
- −$725
- After-tax cash flow
- $3,388/yr
For passive investors: Depreciation is non-cash, so a rental often shows a tax loss while cash-flowing — sheltering income. Rental losses are passive: they offset passive income freely, and up to $25,000/yr can offset ordinary (W-2) income if you actively participate and your MAGI is under $100k (phasing out to $0 by $150k); unused losses carry forward. On sale, claimed depreciation is recaptured at up to 25%, and gains may owe capital-gains tax (a 1031 exchange can defer both). Figures are a year-1 estimate at your 24.0% rate — not tax advice; consult a CPA.
Condition & rehab AI · 12 photos
This home requires moderate renovations, including repairs to the roof and exterior siding, as well as updates to the interior walls and paint. These improvements will significantly increase its resale value.
Repairs flagged
- Major roof — The roof appears to be in poor condition, with visible wear and tear.
- Major exterior siding — The exterior siding is peeling and in need of repainting.
- Minor landscaping — The landscaping is overgrown and unkempt, which can be easily remedied.
Value-add opportunities
- Resale repair and replace roof — A new roof will significantly improve the home's curb appeal and overall condition, making it more attractive to potential buyers.
- Resale paint exterior siding — Repainting the exterior siding will improve the home's appearance and make it more appealing to potential buyers.
- Resale trim and paint interior walls — Updating the interior walls and paint will make the home more inviting and modern, increasing its resale value.
Renovation cost estimate screening
| Repair item | Severity | Est. cost |
|---|---|---|
| roof · The roof appears to be in poor condition, with visible wear and tear. | Major | $15,000–50,000 |
| exterior siding · The exterior siding is peeling and in need of repainting. | Major | $15,000–50,000 |
| landscaping · The landscaping is overgrown and unkempt, which can be easily remedied. | Minor | $500–3,000 |
| Total estimated repair cost · 3 items | $30,500–103,000 |
Value-add ROI direction
- Resale repair and replace roof — A new roof will significantly improve the home's curb appeal and overall condition, making it more attractive to potential buyers. ↑
- Resale paint exterior siding — Repainting the exterior siding will improve the home's appearance and make it more appealing to potential buyers. ↑
- Resale trim and paint interior walls — Updating the interior walls and paint will make the home more inviting and modern, increasing its resale value. ↑
ⓘ Cost ranges are severity-bucket heuristics (US national rule-of-thumb). Get contractor quotes + a written scope before underwriting a rehab budget.
Schools (NCES district)
- District
- Haleyville City
- NCES district ID
- 0101720
- Math proficiency
- 23% ▼ -24.00%
- Reading proficiency
- 47% ▲ 10.00%
- Median HH income
- $29,581
- Composite
- 28.3/100
- National rank
- #6787
- State rank
- #50 of 129 in AL
Livability — Haleyville
- Score
- 60/100
- State rank
- #287
- US rank
- #18676
Category grades
Schools grade is shown separately in the Schools card above.
Census & demographics
- Census place
- Haleyville, AL
- Population (ZIP)
- 10,815
Population outlook (Winston County) Hauer SSP2
- Today (2025)
- 22,474 people
- By 2030
- 21,568 · -4.0%
- By 2040
- 19,710 · -12.3%
- By 2050
- 17,950 · -20.1%
- By 2075
- 14,468 · -35.6%
- By 2100
- 11,554 · -48.6%
Race, ethnicity, and origin ACS 2023
- Neighborhood character
- Predominantly White (88%)
- Race & ethnicity
- White 88% Hispanic / Latino 7% Two or more races 2% Black 2%
- Hispanic origin (detail)
- Mexican 3%
- Common ancestry
- Italian 1% Slovak 1% Iranian 1%
- Foreign-born
- 4% · Canada
- Languages at home
- 94% English-only · Spanish 5%
Political lean MEDSL · Winston
- 2024 margin
- Solid R (+83.6) · D 7.9% · R 91.6%
- 2008→2024 swing
- -20.4pp toward R · 2008: -63.3pp · 2024: -83.6pp
- All cycles
- 2024: R+83.6 2020: R+81.7 2016: R+81.5 2012: R+72.3 2008: R+63.3
Not yet ingested
- Civics
- —
Market trends
- HPI YoY
- ▲ 4.62%
- Current HPI
- 137.486
- Rent YoY
- —
- Metro
- —
- State GDP YoY
- ▲ 2.94%
- F500 in state
- 4
Industry mix (Fortune 500 HQ in AL)
| Industry | F500 HQs | Revenue |
|---|---|---|
| Financial Services | 1 | $8B |
|
||
| Healthcare | 1 | $5B |
|
||
Price history
2 events — show timeline
- 2026-03-31 Pending — Walker County Area MLS
- 2026-03-05 Listed $79,900 Walker County Area MLS
Cash-flow waterfall
monthlySold comps — $/sqft
last 12 mo · ≤1 miLoading sold comps…