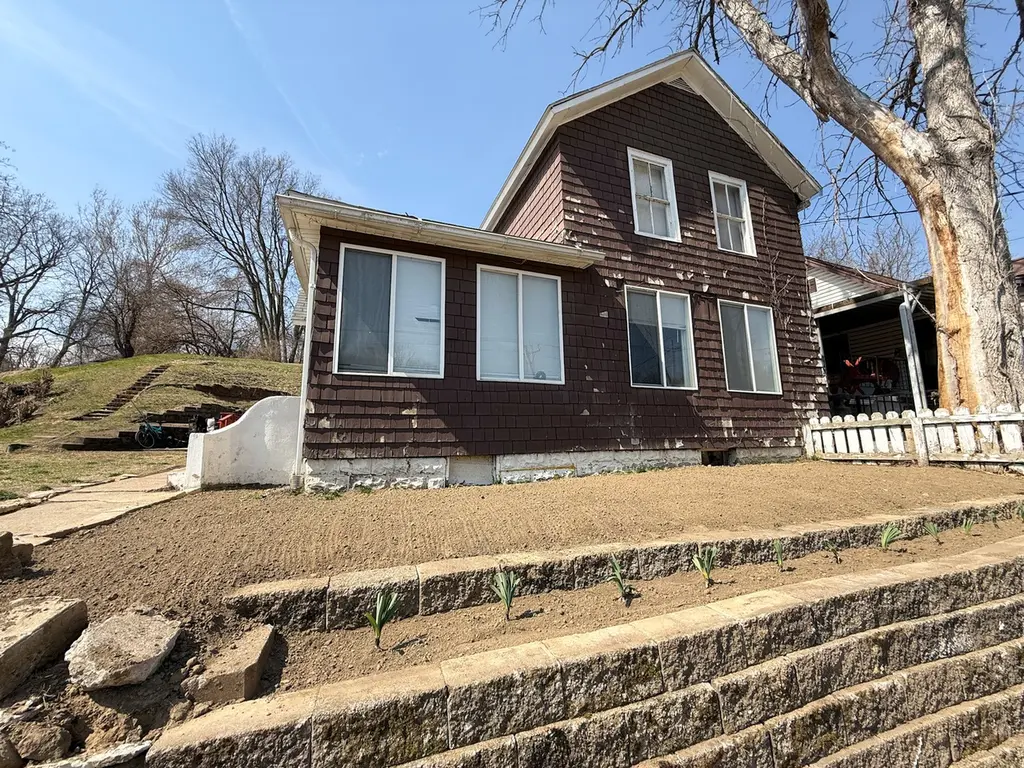
143 Diagonal St · Savanna, IL
Flood risk 1/10 · Minimal
- FEMA flood zone
- X (unshaded)
- Chance of flooding over 30 yrs
- 0.0%
- Est. flood insurance / yr
- $473 – $860
Fire risk 2/10 · Minimal
- Est. fire insurance / yr
- $804 – $1,492
Heat risk 3/10 · Minor
- Hot days now (above 102°F)
- 7 days/yr
- Hot days in 30 yrs
- 16 days/yr
Wind risk 2/10 · Minimal
- Chance of severe wind over 30 yrs
- —
Air-quality risk 2/10 · Minimal
- Unhealthy air days now
- 2 days/yr
- Unhealthy air days in 30 yrs
- 2 days/yr
Risk factors via First Street. Map © Google.
Why this score? — see what drove the B grade
The composite is a weighted blend of 9 inputs, each scored 0–100. Each bar is that input's sub-score; the figure is the points it added to the 100-point composite (weight × sub-score).
- Cash flow +29.6/30.0
- ARV discount +15.0/15.0
- DSCR +10.0/10.0
- 1% rule +9.5/10.0
- Livability +3.2/5.0
- Rent growth +2.5/5.0
- Condition / age +2.5/5.0
- Schools +1.4/10.0
- Appreciation +0.0/10.0
$55,000
🖨 Deal sheet 📄 Offer letter ✓ Due diligence
Listing remarks
Charming, cozy, and full of potential! This 2 bedroom, 1 bath home in Savanna offers a comfortable layout with great opportunity to add your own personal style. Enjoy the convenience of main-level laundry, newer living room windows that bring in plenty of natural light, and durable vinyl plank flooring. While the home has a classic feel, it's the perfect canvas for easy updates and finishing touches to truly make it your own. Whether you're looking for a starter home, downsizing, or an investment opportunity, this property combines coziness, character, and potential at an affordable value.
Key facts
- 8,407 sq ft lot
- Built 1893
- Listed 38 days
Property features AI
Finance
- Other:
- Financial info:
- HOA & community: No master association fee required
Exterior
- Parking:
- Security:
- Utilities: Public water; Public sewer
- Home design: Detached single-family home; 1.5-story design; Fee simple ownership; Built over 100 years ago; Living area per assessor
- Construction: Shake siding; Asphalt roof; Block foundation
- Exterior features: Deck; Fire pit; Sloped lot
Interior
- Kitchen: Range; Refrigerator; Kitchen/dining combo
- Bedrooms: Master bedroom on the second level (10 x 13); Second bedroom on the second level (9 x 13); Two bedrooms total
- Flooring: Laminate flooring in living area; Carpet in bedrooms; Tile/ceramic tile in kitchen and dining
- Bathrooms: 1 full bathroom; 1 half bathroom; Soaking tub in bathroom
- Heating & cooling: Natural gas heating; Window air conditioning unit(s)
- Interior features: Drapes on windows; Blinds on some windows; 5 total rooms; Unfinished basement with exterior entry and partial concrete
- Laundry & utility: Laundry on the main level
Neighborhood map
What this means for you Summary
Snapshot
- This is a 3-bed/1.5-bath other listed at $55k.
Deal economics
- At list price, monthly cash flow is $199 ($2k/yr) — positive.
- The deal already cash-flows at list — no discount required.
- Meets the 1% rule at list price ($800 rent vs $55k).
- Recommended offer: $53k (3.0% below list) — sets the bar for market timing.
- Cap rate 10.6% vs local median 6.4% in Savanna — top-decile yield for the area; either an underpriced asset or a hidden risk that comps aren't pricing in. Stress-test before assuming the spread holds.
Location & tenants
- Location reads 64/100 on livability (#684 in IL) — a middle-class / working-renter tenant base. Strengths: cost of living A+, housing A+, crime A; Watch: schools F, amenities F, commute F.
- West Carroll CUSD 314 (rural): math 12% / reading 20% proficiency, ranked #498 of 620 in IL (top 80%) — low school quality limits family demand, transient renter base, plan for 1-2y turnover.
- Market conditions: 38 active listings in the ZIP; 2 comparable units currently listed for rent nearby; 23 units permitted in Carroll County in 2024 (0 in 5+ unit buildings).
Forward outlook
- Local home prices are declining (-3.0%/yr); year-one equity from $380 of loan paydown is wiped out by about $2k of value loss. Plan a longer hold.
- Carroll County population projected at -30% by 2050 — secular population decline; favor cash flow + early exit over multi-decade hold.
- At projected returns (-3.0% appreciation + 3.0% rent growth), your $15k cash investment doubles in ~8 years — after that, you're playing with house money.
Negotiation context
- It's been on market 39 days — a 3% lower offer ($53k) is reasonable based on typical stale-listing flexibility.
- Current owner paid $23k; list at $55k implies a 139% gain — meaningful room to come down on a strong offer.
Risks & watch-outs
- Watch-outs: property tax is 2.7% of price; built in 1893 — expect roof / HVAC / electrical / plumbing capex.
Questions for the listing agent
- It's been on market 39 days. Have you received any prior offers? Is the seller open to a 3% concession, seller financing, or rate buy-down credit?
- Built in 1893 — when were the roof, HVAC, electrical panel, plumbing, and water heater last replaced?
- Property tax is high relative to price — has the assessment been appealed recently, and will the sale trigger a re-assessment?
- Is there a deadline driving the sale (1031 exchange, divorce, estate, relocation)? That informs how much negotiation room exists.
- Schools are F-rated, which usually means shorter tenancies and higher turnover. Who's the typical renter profile here, and what's been the actual vacancy rate?
- What's the average days-on-market for RENTAL listings here right now (not sales)? A rising rental-DOM trend means longer vacancies and softer asking-rent achievability than the comps imply.
- What's the recent tenant-quality profile in this submarket — average credit score on applications, eviction rate, late-payment / NSF rate, and stable-employment percentage? A property-management company in the area should have these aggregated.
- How much new for-sale + rental construction is in the pipeline within 1–3 miles? Heavy new supply typically softens prices + rents 12–24 months out; constrained supply supports both.
Investment metrics
- 1% rule
- 1.45% ✓
- Cap rate
- 10.63%
- Cash-on-cash
- 15.47%
- DSCR
- 1.69
- GRM
- 5.7
CMA / ARV
- ARV (median comp)
- $67,721
- List price
- $55,000
- Delta
- -18.78%
- Verdict
- UNDERPRICED
- Comps
- 20 within 1.0 mi
Projected returns pro-forma
-3.0% appreciation · 3.0% rent growth · sell at horizon
- IRR
- 6.3%
- Equity multiple
- 1.25×
- Total profit
- $3,780
- Equity at exit
- $8,201
- IRR
- 15.7%
- Equity multiple
- 2.28×
- Total profit
- $19,759
- Equity at exit
- $4,755
Cash invested: $15,400 (down + closing). Projections, not guarantees.
Landlord ↔ Tenant lean methodology
- Overall (STATE)
- 43 Moderately Tenant-Leaning
- State Illinois
- 43 Moderately Tenant-Leaning · D+7
- County
- — inherits STATE
- City
- — inherits STATE
ZIP-level market 61074
- Home prices YoY
- -14.6%
- Active inventory
- 38
- Price-to-rent
- 5.7×
Monthly cashflow live
- Estimated rent
- $800 medium interval (Pro) →
- Mortgage (P&I)
- −$288
- Tax from tax record
- −$122 /mo · $1,465/yr
- Insurance
- −$23
- HOA
- −$0
- Vacancy / Maint / Mgmt
- −$168
- Net cashflow
- $199
Break-even live
UW: 25.0% down · 7.5% · 30yr · 1.5% tax · 5.0% vac · 8.0% maint · 8.0% mgmt
Financing live
Cash to close
- Down payment
- $13,750
- Closing costs
- $1,650
- Reserves months
- —
- Total cash needed
- —
Loan-product check · same deal, 3 products live
Conventional
25% down · 7.5% · 30yr
- Down + closing
- —
- Monthly P&I
- —
- Monthly cashflow
- —
- DSCR
- —
- Eligible?
- —
Personal DTI + credit; lowest rate.
DSCR
20% down · 8.5% · 30yr
- Down + closing
- —
- Monthly P&I
- —
- Monthly cashflow
- —
- DSCR
- —
- Eligible?
- —
No personal income docs; deal must DSCR.
Hard money
10% down · 12.0% · 12mo
- Down + closing
- —
- Monthly P&I
- —
- Monthly cashflow
- —
- DSCR
- —
- Eligible?
- —
Short-term bridge; refi at stabilization.
Rent comps 2 comps
| Address | Beds | Baths | Sqft | Rent | $/sqft | DOM | Units | Dist |
|---|---|---|---|---|---|---|---|---|
| 512-514 Chicago Ave Savanna, IL | 3.0 | 1.0 | 1435 | $800 | $0.56 | 43d | 1 | 0.41mi |
| 512 Chicago Ave Unit 1 Savanna, IL | 3.0 | 1.5 | 1435 | $800 | $0.56 | 43d | 1 | 0.42mi |
Listing history 18 events
-
2026-06-19days on market $55,000 Active 39 DOM
-
2026-06-18days on market $55,000 Active 38 DOM
-
2026-06-17days on market $55,000 Active 37 DOM
-
2026-06-16days on market $55,000 Active 36 DOM
-
2026-06-15days on market $55,000 Active 35 DOM
-
2026-06-14days on market $55,000 Active 33 DOM
-
2026-06-12days on market $55,000 Active 32 DOM
-
2026-06-09days on market $55,000 Active 29 DOM
-
2026-06-08days on market $55,000 Active 28 DOM
-
2026-06-07days on market $55,000 Active 27 DOM
-
2026-06-07days on market $55,000 Active 26 DOM
-
2026-06-02days on market $55,000 Active 22 DOM
-
2026-06-01days on market $55,000 Active 21 DOM
-
2026-05-31days on market $55,000 Active 20 DOM
-
2026-05-30days on market $55,000 Active 19 DOM
-
2026-05-11price $55,000 596-char remark
-
2026-05-11$52,000 Active 596-char remark
-
2004-11-23soldstatus $23,000
ⓘ Source: listings_history table (triggers on properties + properties_extension) + one-shot
backfill from property_details.listing_events for pre-trigger history.
Tax reassessment forecast IL · Partial reset (capped growth)
- Current annual tax
- $1,465 · $122/mo
- Projected year-2 tax
- $1,465 · $122/mo
- Expected delta
- $0/yr ($0/mo · 0.0%)
ⓘ Screening estimate from a state-policy table — verify with the county assessor before closing.
Climate risk First Street
- Flood 1/10 Low FEMA zone X (unshaded) · 0% chance over 30 yrs
- Wildfire 2/10 Low
- Heat 3/10 Moderate 7 d/yr ≥102°F today · 16 d/yr by 30 yrs out
- Wind 2/10 Low
- Air quality 2/10 Low 2 unhealthy d/yr today · 2 by 30 yrs out
Nearby sold comps map
Loading sold comps map…
Walkable amenities ~0.75 mi
Loading nearby amenities…
Taxation est. · year 1
- Rental income
- $9,600
- − Mortgage interest
- −$3,081
- − Property taxes
- −$1,465
- − Insurance
- −$275
- − Repairs & maintenance
- −$768
- − Management
- −$768
- − Depreciation
- −$1,600
- Taxable income
- $1,643
- Est. tax owed @ 24.0%
- −$394
- After-tax cash flow
- $1,989/yr
For passive investors: Depreciation is non-cash, so a rental often shows a tax loss while cash-flowing — sheltering income. Rental losses are passive: they offset passive income freely, and up to $25,000/yr can offset ordinary (W-2) income if you actively participate and your MAGI is under $100k (phasing out to $0 by $150k); unused losses carry forward. On sale, claimed depreciation is recaptured at up to 25%, and gains may owe capital-gains tax (a 1031 exchange can defer both). Figures are a year-1 estimate at your 24.0% rate — not tax advice; consult a CPA.
Schools (NCES district)
- District
- West Carroll CUSD 314
- NCES district ID
- 1700310
- Math proficiency
- 12% ▼ -5.00%
- Reading proficiency
- 20% ▼ -3.00%
- Median HH income
- $43,090
- Composite
- 13.91/100
- National rank
- #9483
- State rank
- #498 of 620 in IL
Livability — Savanna
- Score
- 64/100
- State rank
- #684
- US rank
- #13971
Category grades
Schools grade is shown separately in the Schools card above.
Census & demographics
- Census place
- Savanna, IL
- Population (ZIP)
- 4,009
Population outlook (Carroll County) Hauer SSP2
- Today (2025)
- 13,010 people
- By 2030
- 12,150 · -6.6%
- By 2040
- 10,462 · -19.6%
- By 2050
- 9,078 · -30.2%
- By 2075
- 6,704 · -48.5%
- By 2100
- 5,004 · -61.5%
Race, ethnicity, and origin ACS 2023
- Neighborhood character
- Predominantly White (91%)
- Race & ethnicity
- White 91% Hispanic / Latino 6% Two or more races 5%
- Hispanic origin (detail)
- Mexican 4%
- Common ancestry
- Iranian 5% Romanian 3% Slovak 2%
- Foreign-born
- 2% · Canada, Jamaica
- Languages at home
- 96% English-only · Spanish 3% German/W. Germanic 1%
Political lean MEDSL · Carroll
- 2024 margin
- Solid R (+31.7) · D 33.2% · R 64.8% · Other 2.0%
- 2008→2024 swing
- -36.5pp toward R · 2008: 4.8pp · 2024: -31.7pp
- All cycles
- 2024: R+31.7 2020: R+29.4 2016: R+27.1 2012: D+1.4 2008: D+4.8
Not yet ingested
- Civics
- —
Market trends
- HPI YoY
- ▼ -24.68%
- Current HPI
- 144.9327
- Rent YoY
- —
- Metro
- —
- State GDP YoY
- ▲ 1.59%
- F500 in state
- 60
Industry mix (Fortune 500 HQ in IL)
| Industry | F500 HQs | Revenue |
|---|---|---|
| Insurance | 4 | $201B |
|
||
| Consumer Goods | 4 | $87B |
|
||
| Industrial Machinery | 3 | $64B |
|
||
| Healthcare | 2 | $55B |
|
||
| Retail / Pharmacy | 1 | $148B |
|
||
| Agriculture / Food | 1 | $86B |
|
||
Price history
+139.1% since first listed3 events — show timeline
- 2026-05-11 Price Changed $55,000 MRED as Distributed by MLS Grid
- 2026-05-11 Listed $52,000 MRED as Distributed by MLS Grid
- 2004-11-23 Sold (Public Records) $23,000 Public Records
Property tax history
+0.7%/yrLatest (2024): $1,465 · +8.0% YoY. Source: county tax records.
Cash-flow waterfall
monthlySold comps — $/sqft
last 12 mo · ≤1 miLoading sold comps…