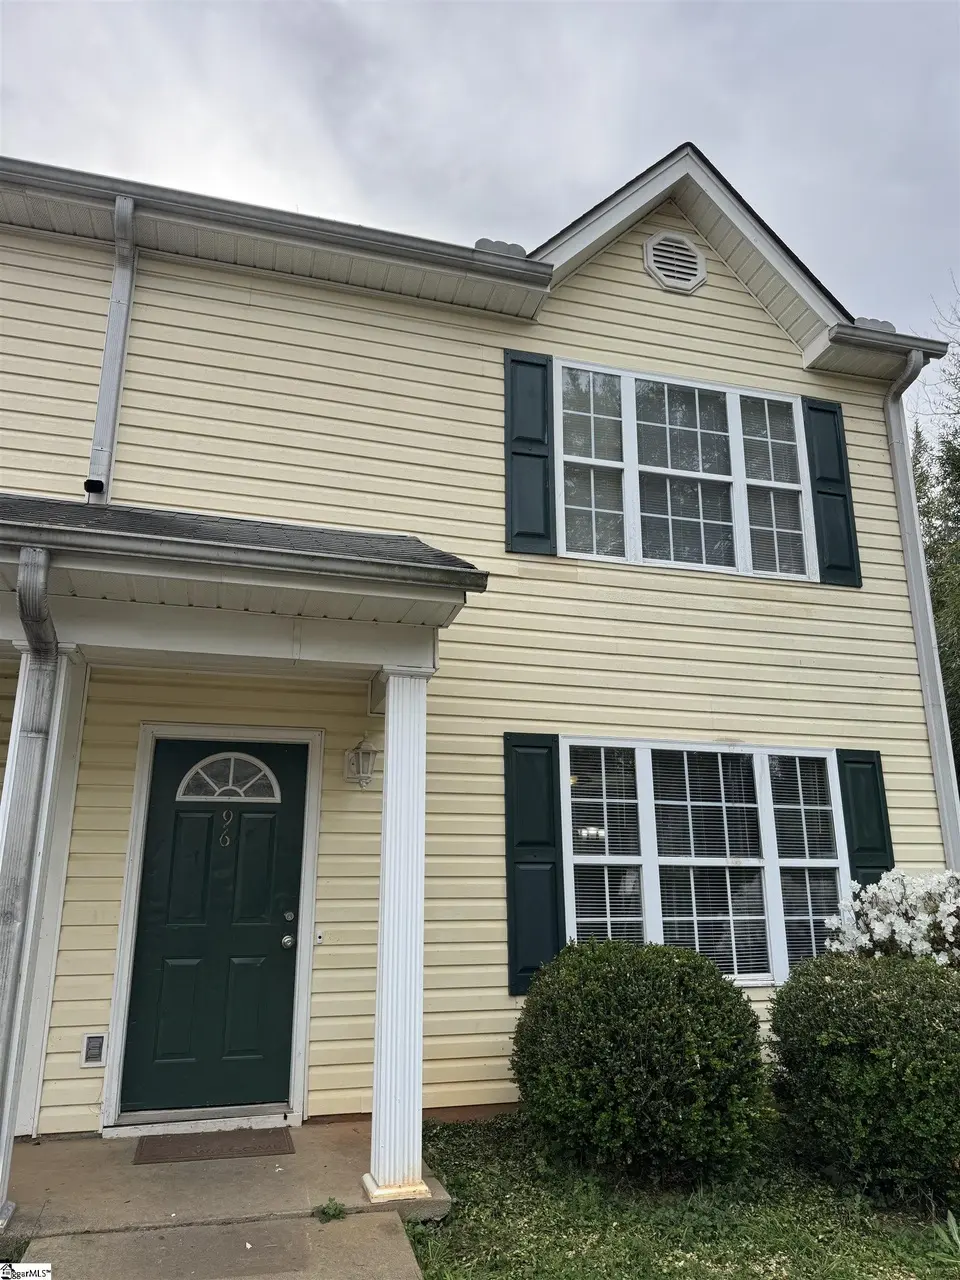
96 Buff St · Sans Souci, SC
Flood risk 1/10 · Minimal
- FEMA flood zone
- X (unshaded)
- Chance of flooding over 30 yrs
- 0.0%
- Est. flood insurance / yr
- $507 – $1,088
Fire risk 1/10 · Minimal
- Est. fire insurance / yr
- $783 – $1,453
Heat risk 6/10 · Moderate
- Hot days now (above 102°F)
- 7 days/yr
- Hot days in 30 yrs
- 17 days/yr
Wind risk 2/10 · Minimal
- Chance of severe wind over 30 yrs
- 0.0%
Air-quality risk 4/10 · Minor
- Unhealthy air days now
- 3 days/yr
- Unhealthy air days in 30 yrs
- 4 days/yr
Risk factors via First Street. Map © Google.
Why this score? — see what drove the C- grade
The composite is a weighted blend of 9 inputs, each scored 0–100. Each bar is that input's sub-score; the figure is the points it added to the 100-point composite (weight × sub-score).
- Cash flow +21.7/30.0
- DSCR +6.9/10.0
- ARV discount +6.1/15.0
- 1% rule +4.8/10.0
- Schools +4.2/10.0
- Livability +3.7/5.0
- Rent growth +2.5/5.0
- Condition / age +2.5/5.0
- Appreciation +0.0/10.0
$189,000
🖨 Deal sheet (PDF) 📄 Offer letter ✓ Due diligence
Listing remarks
Low-maintenance living meets unbeatable location in this charming 3BR/2BA townhome just minutes from downtown Greenville! Ideally situated near the popular Swamp Rabbit Trail and the highly sought-after Swamp Rabbit Cafe and Grocery, you’ll enjoy easy access to outdoor recreation, local dining, and vibrant community life. Inside, this well-designed townhome offers a spacious living room perfect for relaxing or entertaining, along with a large kitchen featuring plenty of cabinet and counter space for everyday living. With its convenient location and low-maintenance lifestyle, this home is ideal for those looking to enjoy all that Greenville has to offer.
Key facts
- Swamp rabbit trail
- Outdoor recreation
- Large kitchen
Tags
Property features AI
Finance
- HOA & community: No HOA fees; Community amenities include common areas and some sidewalks
Exterior
- Utilities: Public water; Electric water heater; Public sewer; Public garbage pickup; Electric power
- Home design: Two-story residence; Approximate age: 21–30 years; Slab foundation
- Construction: Vinyl siding exterior; Composition shingle roof
- Exterior features: Level lot; Sidewalk
Interior
- Kitchen: Dishwasher; Electric oven; Range hood; Other appliances noted in remarks
- Bedrooms: Primary bedroom located on the 2nd level; Primary bedroom approx. 12 x 13; Second bedroom approx. 10 x 11; Third bedroom approx. 10 x 11
- Flooring: Carpet; Luxury vinyl tile/plank
- Bathrooms: One full bath; One half bath
- Heating & cooling: Electric heating; Electric cooling
- Interior features: Cable available; Smoke detector
- Laundry & utility: Laundry on the 1st floor
Neighborhood map
What this means for you Summary
Snapshot
- This is a 3-bed/1.5-bath single-family listed at $189k.
Deal economics
- At list price, monthly cash flow is $289 ($3k/yr) — positive.
- The deal already cash-flows at list — no discount required.
- To meet the 1% rule (rent ≥ 1% of price), the offer needs to be $186k (1.5% below list).
- Recommended offer: $178k (6.0% below list) — sets the bar for market timing.
- Cap rate 8.1% vs local median 3.5% in Sans Souci — top-decile yield for the area; either an underpriced asset or a hidden risk that comps aren't pricing in. Stress-test before assuming the spread holds.
Location & tenants
- Location reads 74/100 on livability (#30 in SC, #4,635 nationally) — a middle-class / working-renter tenant base. Strengths: commute A+, cost of living A+, housing A+; Watch: crime D-, amenities D-, employment F.
- Greenville 01 (suburban): math 44% / reading 54% proficiency, ranked #10 of 80 in SC (top 12%) — families likely to look elsewhere, expect single-tenant / working-renter base with shorter leases.
- Zoned schools: Cherrydale Elementary (math 27% / reading 19%, grade F, #469 of 597 statewide, top 79%, 689 students, 100% FRL) — zoned schools average 100% FRL vs 42% district-wide (58 pts higher); higher-poverty schools than district average — tighter screening recommended.
- Zoned-school proficiency averages 23% at this address vs 49% district-wide (-26 pts) — the specific schools serving this property underperform the Greenville 01 average; the district grade overstates school quality for this exact location.
- Market conditions: Rents flat; 203 active listings in the ZIP; 26 comparable units currently listed for rent nearby; rentals at typical pace (median 24d on market — plan ~3-4 weeks tenant-placement turnaround); 5,595 units permitted in Greenville County in 2024 (566 in 5+ unit buildings).
- This rent runs 34% of the median local income ($65k/yr) — at the standard rent-burdened threshold; future hikes will face affordability resistance.
Forward outlook
- Local home prices are declining (-3.0%/yr); year-one equity from $1k of loan paydown is wiped out by about $6k of value loss. Plan a longer hold.
- Greenville County population projected at +34% by 2050 — long-run rental-demand tailwind backs the buy-and-hold thesis.
Negotiation context
- It's been on market 77 days — a 6% lower offer ($178k) is reasonable based on typical stale-listing flexibility.
- 3 sale attempts since 20y ago; this cycle's ask has dropped $10k (5%) from the opening price — seller is motivated, your offer sets the floor, not the list.
- Current owner paid $74k; list at $189k implies a 154% gain — meaningful room to come down on a strong offer.
Risks & watch-outs
- Climate carrying-cost: extreme-heat days projected 7→17/yr by 2055 (HVAC capex compounding) — expect insurance premiums to compound above CPI over the hold.
Questions for the listing agent
- It's been on market 77 days. Have you received any prior offers? Is the seller open to a 6% concession, seller financing, or rate buy-down credit?
- Why hasn't it sold? Are there any deal-killer items the seller is aware of (foundation, flood, title, zoning, code violations)?
- Is there a deadline driving the sale (1031 exchange, divorce, estate, relocation)? That informs how much negotiation room exists.
- Schools are F-rated, which usually means shorter tenancies and higher turnover. Who's the typical renter profile here, and what's been the actual vacancy rate?
- Crime grade is D in this area — have there been break-ins, vandalism, or insurance claims at this property in the last 3 years? What carrier currently insures it and at what premium?
- What's the average days-on-market for RENTAL listings here right now (not sales)? A rising rental-DOM trend means longer vacancies and softer asking-rent achievability than the comps imply.
- What's the recent tenant-quality profile in this submarket — average credit score on applications, eviction rate, late-payment / NSF rate, and stable-employment percentage? A property-management company in the area should have these aggregated.
- How much new for-sale + rental construction is in the pipeline within 1–3 miles? Heavy new supply typically softens prices + rents 12–24 months out; constrained supply supports both.
Investment metrics
- 1% rule
- 0.98% ✗
- Cap rate
- 8.13%
- Cash-on-cash
- 6.56%
- DSCR
- 1.29
- GRM
- 8.5
CMA / ARV
- ARV (on-the-fly)
- $183,480
- Comps found
- 7
Show comp detail 7 sales within ~0.75 mi
| Address | Dist | Beds/Ba | Sqft | Sold | Price | $/sf | Match |
|---|---|---|---|---|---|---|---|
| 15 & 15a Gilreath St | 0.38mi | 3/1.0 | 1,232 (-7%) | 12mo | $169,900 | $138 | 59 |
| 105 Woodside Cir Unit B | 0.71mi | 3/2.0 | 1,379 (+4%) | 2mo | $310,000 | $225 | 55 |
| 101 Old Paris Mountain Rd | 0.69mi | 3/2.0 | 1,238 (-6%) | 12mo | $266,500 | $215 | 46 |
| 109 Old Paris Mountain Rd | 0.68mi | 3/2.0 | 1,220 (-8%) | 13mo | $248,500 | $204 | 43 |
| 100 Old Paris Mountain Rd | 0.72mi | 3/1.5 | 1,372 (+4%) | 22mo | $191,000 | $139 | 42 |
| 201 Colonial Ave | 0.71mi | 2/1.0 (-1) | 1,388 (+5%) | 14mo | $175,000 | $126 | 40 |
| 129 Gantt St | 0.68mi | 3/1.0 | 1,500 (+14%) | 14mo | $198,000 | $132 | 32 |
Match score weights: distance 35% · size 25% · config 20% · recency 20%. Top-matched comps best support the ARV.
Projected returns pro-forma
-3.0% appreciation · 0.14% rent growth · sell at horizon
- IRR
- -9.3%
- Equity multiple
- 0.67×
- Total profit
- $-17,468
- Equity at exit
- $28,181
- IRR
- -3.8%
- Equity multiple
- 0.78×
- Total profit
- $-11,879
- Equity at exit
- $16,341
Cash invested: $52,920 (down + closing). Projections, not guarantees.
Landlord ↔ Tenant lean methodology
- Overall (STATE)
- 90 Strongly Landlord-Friendly
- State South Carolina
- 90 Strongly Landlord-Friendly · R+6
- County
- — inherits STATE
- City
- — inherits STATE
ZIP-level market 29609
- Rents YoY
- 0.1%
- Active inventory
- 203
- Price-to-rent
- 8.5×
Monthly cashflow live
- Estimated rent
- $1,861 high interval (Pro) →
- Mortgage (P&I)
- −$991
- Tax from tax record
- −$112 /mo · $1,339/yr
- Insurance
- −$79
- HOA
- −$0
- Lot rent
- −$0
- Vacancy / Maint / Mgmt
- −$391
- Net cashflow
- $289
Break-even live
Sensitivity live
| Price | -10% $396 | -5% $343 | +0% $289 | +5% $236 | +10% $182 |
|---|---|---|---|---|---|
| Rent | -10% $142 | -5% $216 | +0% $289 | +5% $363 | +10% $436 |
| Rate | -1.0pp $384 | -0.5pp $337 | base $289 | +0.5pp $240 | +1.0pp $190 |
UW: 25.0% down · 7.5% · 30yr · 1.5% tax · 5.0% vac · 8.0% maint · 8.0% mgmt
Financing live
Cash to close
- Down payment
- $47,250
- Closing costs
- $5,670
- Reserves months
- —
- Total cash needed
- —
Loan-product check · same deal, 3 products live
Conventional
25% down · 7.5% · 30yr
- Down + closing
- —
- Monthly P&I
- —
- Monthly cashflow
- —
- DSCR
- —
- Eligible?
- —
Personal DTI + credit; lowest rate.
DSCR
20% down · 8.5% · 30yr
- Down + closing
- —
- Monthly P&I
- —
- Monthly cashflow
- —
- DSCR
- —
- Eligible?
- —
No personal income docs; deal must DSCR.
Hard money
10% down · 12.0% · 12mo
- Down + closing
- —
- Monthly P&I
- —
- Monthly cashflow
- —
- DSCR
- —
- Eligible?
- —
Short-term bridge; refi at stabilization.
Rent comps 26 comps
| Address | Beds | Baths | Sqft | Rent | $/sqft | DOM | Units | Dist |
|---|---|---|---|---|---|---|---|---|
| 31 Victor St Unit 331 Greenville, SC | 2.0 | 1.0 | 995 | $2,204 | $2.22 | 26d | 1 | 0.27mi |
| 31 Victor St Unit 339 Greenville, SC | 2.0 | 1.0 | 975 | $1,853 | $1.90 | 26d | 1 | 0.27mi |
| 31 Victor St Unit 201 Greenville, SC | 2.0 | 1.0 | 895 | $1,700 | $1.90 | 26d | 1 | 0.27mi |
| 31 Victor St Unit 326 Greenville, SC | 4.0 | 2.0 | 1315 | $2,499 | $1.90 | 26d | 1 | 0.27mi |
| 9 Gilreath St Greenville, SC | 3.0 | 2.0 | 1244 | $1,495 | $1.20 | 24d | 1 | 0.41mi |
| 135 D St Greenville, SC | 2.0 | 1.0 | 938 | $1,150 | $1.23 | 24d | 1 | 0.41mi |
| 1250 WATER TOWER Cir Greenville, SC | 2.0 | 1.0–2.0 | 790 | $1,959 | $2.48 | 6d | 28 | 0.45mi |
| 1121 Tsali Cir Greenville, SC | 2.0 | 1.0–2.0 | 906 | $2,401 | $2.65 | 6d | 8 | 0.46mi |
| 221 Church St Greenville, SC | 2.0 | 1.0 | 900 | $1,395 | $1.55 | 6d | 1 | 0.65mi |
| 3 Frost St Greenville, SC | 3.0 | 2.0 | 1450 | $1,900 | $1.31 | 26d | 1 | 0.77mi |
| 409 Pinckney St Apt 2D Greenville, SC | 2.0 | 1.0 | 900 | $1,300 | $1.44 | 6d | 1 | 0.78mi |
| 802 Hampton Ave Unit A Greenville, SC | 2.0 | 1.0 | 900 | $1,300 | $1.44 | 26d | 1 | 0.78mi |
| 205 Croft St Greenville, SC | 2.0 | 1.0 | 1200 | $1,925 | $1.60 | 26d | 1 | 1.01mi |
| 420 Oscar St Greenville, SC | 3.0 | 2.0 | 1400 | $1,800 | $1.29 | 6d | 1 | 1.18mi |
| 12 E Blue Ridge Dr Greenville, SC | 2.0 | 2.0 | 1400 | $1,950 | $1.39 | 26d | 1 | 1.23mi |
| 39 E 7th St Greenville, SC | 3.0 | 2.0 | 1120 | $1,750 | $1.56 | 6d | 1 | 1.24mi |
| 33 9th St Greenville, SC | 2.0 | 1.0 | 886 | $1,000 | $1.13 | 26d | 1 | 1.32mi |
| 500 Birnie St Greenville, SC | 2.0 | 1.0 | 980 | $1,475 | $1.51 | 26d | 1 | 1.38mi |
| 216 Lester Ave Greenville, SC | 2.0 | 1.0 | 1000 | $1,175 | $1.18 | 6d | 1 | 1.41mi |
| 18 E Stone Ave Greenville, SC | 3.0 | 1.0–2.5 | 1017 | $2,451 | $2.41 | 6d | 20 | 1.41mi |
| 5 Zarline St Greenville, SC | 3.0 | 1.0 | 1060 | $1,095 | $1.03 | 21d | 1 | 1.44mi |
| 25 Louise Ave Greenville, SC | 3.0 | 3.0 | 1600 | $1,999 | $1.25 | 26d | 1 | 1.45mi |
| 103 Fernside Ct Greenville, SC | 3.0 | 2.5 | 1210 | $1,750 | $1.45 | 6d | 1 | 1.48mi |
| 12 Catawba Ave Greenville, SC | 3.0 | 2.5 | 1399 | $1,650 | $1.18 | 17d | 1 | 1.48mi |
| 14 Pine Thicket Dr Greenville, SC | 3.0 | 2.5 | 1475 | $1,595 | $1.08 | 26d | 1 | 1.49mi |
| 206 Von Hollen Dr Greenville, SC | 3.0 | 1.0 | 1100 | $1,549 | $1.41 | 24d | 1 | 1.50mi |
Listing history 25 events
-
2026-06-22days on market $189,000 Active 77 DOM
-
2026-06-22days on market $189,000 Active 76 DOM
-
2026-06-18days on market $189,000 Active 73 DOM
-
2026-06-17days on market $189,000 Active 72 DOM
-
2026-06-16days on market $189,000 Active 71 DOM
-
2026-06-15days on market $189,000 Active 70 DOM
-
2026-06-13days on market $189,000 Active 68 DOM
-
2026-06-13days on market $189,000 Active 67 DOM
-
2026-06-10days on market $189,000 Active 65 DOM
-
2026-06-09days on market $189,000 Active 64 DOM
-
2026-06-08days on market $189,000 Active 63 DOM
-
2026-06-07days on market $189,000 Active 62 DOM
-
2026-06-03days on market $189,000 Active 58 DOM
-
2026-06-03days on market $189,000 Active 57 DOM
-
2026-06-01days on market $189,000 Active 56 DOM
-
2026-05-31days on market $189,000 Active 55 DOM
-
2026-04-14price $189,000
-
2026-04-06$199,000 Active
-
2007-09-10soldstatus $74,500
-
2007-05-06historical
-
2007-01-26$80,650
-
2006-12-28soldstatus $57,500
-
2006-11-15historical
-
2006-07-23$59,900
-
2005-03-04soldstatus $94,000
ⓘ Source: listings_history table (triggers on properties + properties_extension) + one-shot
backfill from property_details.listing_events for pre-trigger history.
Tax reassessment forecast SC · Resets to sale price
- Current annual tax
- $1,339 · $112/mo
- Projected year-2 tax
- $1,339 · $112/mo
- Expected delta
- $0/yr ($0/mo · 0.0%)
ⓘ Screening estimate from a state-policy table — verify with the county assessor before closing.
Climate risk First Street
- Flood 1/10 Low FEMA zone X (unshaded) · 0% chance over 30 yrs
- Wildfire 1/10 Low
- Heat 6/10 Major 7 d/yr ≥102°F today · 17 d/yr by 30 yrs out
- Wind 2/10 Low 0% chance of damaging wind over 30 yrs
- Air quality 4/10 Moderate 3 unhealthy d/yr today · 4 by 30 yrs out
Nearby sold comps map
Loading sold comps map…
Walkable amenities ~0.75 mi
Loading nearby amenities…
Taxation est. · year 1
- Rental income
- $22,338
- − Mortgage interest
- −$10,587
- − Property taxes
- −$1,339
- − Insurance
- −$945
- − Repairs & maintenance
- −$1,787
- − Management
- −$1,787
- − Depreciation
- −$5,498
- Taxable income
- $395
- Est. tax owed @ 24.0%
- −$95
- After-tax cash flow
- $3,375/yr
For passive investors: Depreciation is non-cash, so a rental often shows a tax loss while cash-flowing — sheltering income. Rental losses are passive: they offset passive income freely, and up to $25,000/yr can offset ordinary (W-2) income if you actively participate and your MAGI is under $100k (phasing out to $0 by $150k); unused losses carry forward. On sale, claimed depreciation is recaptured at up to 25%, and gains may owe capital-gains tax (a 1031 exchange can defer both). Figures are a year-1 estimate at your 24.0% rate — not tax advice; consult a CPA.
Schools (NCES district)
- District
- Greenville 01
- NCES district ID
- 4502310
- Math proficiency
- 44% ▼ -10.00%
- Reading proficiency
- 54% ▼ -2.00%
- Median HH income
- $49,596
- Composite
- 41.88/100
- National rank
- #3370
- State rank
- #10 of 80 in SC
Livability — Sans Souci
- Score
- 74/100
- State rank
- #30
- US rank
- #4635
Category grades
Schools grade is shown separately in the Schools card above.
Census & demographics
- Census place
- Sans Souci, SC
- County
- Greenville County · 573,815 people
- Metro
- Greenville-Anderson, SC
- Population (ZIP)
- 32,292
- Household income
- $65,342
- Rent vs Own
- Severe rent burden
- 1685.0
Population outlook (Greenville County) Hauer SSP2
- Today (2025)
- 574,580 people
- By 2030
- 615,615 · +7.1%
- By 2040
- 695,373 · +21.0%
- By 2050
- 769,367 · +33.9%
- By 2075
- 933,296 · +62.4%
- By 2100
- 1,029,196 · +79.1%
Race, ethnicity, and origin ACS 2023
- Neighborhood character
- Predominantly White (70%)
- Race & ethnicity
- White 70% Black 12% Hispanic / Latino 12% Two or more races 6% Asian 2%
- Hispanic origin (detail)
- Mexican 4% Puerto Rican 2% Dominican 1%
- Common ancestry
- Slovak 4% Italian 3% Serbian 2%
- Foreign-born
- 9% · Canada, Vietnam, Jamaica
- Languages at home
- 88% English-only · Spanish 8% Other Asian/Pacific 1% Vietnamese 1%
Political lean MEDSL · Greenville
- 2024 margin
- Strong R (+22.2) · D 38.0% · R 60.2% · Other 1.8%
- 2008→2024 swing
- +1.7pp toward D · 2008: -23.9pp · 2024: -22.2pp
- All cycles
- 2024: R+22.2 2020: R+18.2 2016: R+24.7 2012: R+27.8 2008: R+23.9
Not yet ingested
- Civics
- —
Market trends
- HPI YoY
- ▼ -291.09%
- Current HPI
- 277.6004
- Rent YoY
- ▲ 0.14%
- Metro
- Greenville-Anderson, SC
- State GDP YoY
- ▲ 4.51%
- F500 in state
- 2
Industry mix (Fortune 500 HQ in SC)
| Industry | F500 HQs | Revenue |
|---|---|---|
| Packaging | 1 | $7B |
|
||
Price history
+101.1% since first listed9 events — show timeline
- 2026-04-14 Price Changed $189,000 Greater Greenville MLS
- 2026-04-06 Listed $199,000 Greater Greenville MLS
- 2007-09-10 Sold (Public Records) $74,500 Public Records
- 2007-05-06 Listing Removed — Greater Greenville MLS
- 2007-01-26 Listed $80,650 Greater Greenville MLS
- 2006-12-28 Sold (Public Records) $57,500 Public Records
- 2006-11-15 Listing Removed — Greater Greenville MLS
- 2006-07-23 Listed $59,900 Greater Greenville MLS
- 2005-03-04 Sold (Public Records) $94,000 Public Records
Property tax history
+2.2%/yrLatest (2025): $1,339 · +3.1% YoY. Source: county tax records.
Cash-flow waterfall
monthlySold comps — $/sqft
last 12 mo · ≤1 miLoading sold comps…