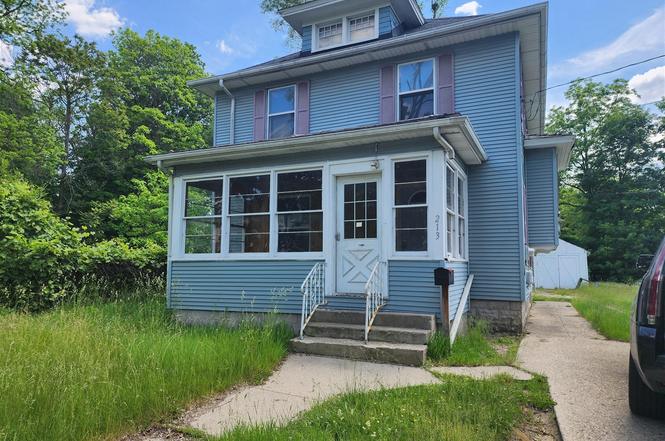
213 E High St · Jackson, MI
Flood risk 1/10 · Minimal
- FEMA flood zone
- X (unshaded)
- Chance of flooding over 30 yrs
- 0.0%
- Est. flood insurance / yr
- $473 – $860
Fire risk 1/10 · Minimal
- Est. fire insurance / yr
- $784 – $1,456
Heat risk 3/10 · Minor
- Hot days now (above 98°F)
- 7 days/yr
- Hot days in 30 yrs
- 15 days/yr
Wind risk 2/10 · Minimal
- Chance of severe wind over 30 yrs
- —
Air-quality risk 2/10 · Minimal
- Unhealthy air days now
- 1 days/yr
- Unhealthy air days in 30 yrs
- 1 days/yr
Risk factors via First Street. Map © Google.
Why this score? — see what drove the B+ grade
The composite is a weighted blend of 9 inputs, each scored 0–100. Each bar is that input's sub-score; the figure is the points it added to the 100-point composite (weight × sub-score).
- Cash flow +30.0/30.0
- ARV discount +15.0/15.0
- 1% rule +10.0/10.0
- DSCR +10.0/10.0
- Rent growth +4.4/5.0
- Livability +3.7/5.0
- Condition / age +2.5/5.0
- Schools +1.8/10.0
- Appreciation +0.0/10.0
$50,000
🖨 Deal sheet (PDF) 📄 Offer letter ✓ Due diligence
Listing remarks MLS
This double lot charmer is waiting for you to bring it back to it's glory! The original woodwork thru-out is gorgeous. The 5th bedroom on the 2nd floor looks like it could be converted into a studio apartment with dedicated exterior entrance. Two parcels are included in sale. Basement & Garage offer extra storage space. This home is crying out for your sweat equity! Home may qualify for rehab loan. Property will be included the next Auction. Buyers must sign up and place bids though www. xome.com. All auction properties are subject to a 5% buyer s premium pursuant to the Event Agreement and Auction Terms & Conditions minimums will apply . Buyers and buyers agent to verify any and all info.
Key facts
- 5th bedroom
- Extra storage space
- Two parcels
Tags
Property features AI
Exterior
- Parking: Detached 2-car garage; Detached parking
- Utilities: Public water
- Home design: Traditional style; Single family residence; Residential property; Public water
- Construction: Built in 1930; Vinyl siding
- Exterior features: Sidewalk
Interior
- Kitchen: Oven; Refrigerator
- Bedrooms: Primary bedroom; Bedroom 2; Bedroom 3; Bedroom 4; Bedroom 5
- Bathrooms: 2 full bathrooms
- Heating & cooling: Forced air heating
- Interior features: 10 total rooms; Full basement
- Laundry & utility: Washer; Dryer
Neighborhood map
What this means for you Summary
Snapshot
- This is a 5-bed/2.0-bath single-family listed at $50k.
Deal economics
- At list price, monthly cash flow is $934 ($11k/yr) — positive.
- The deal already cash-flows at list — no discount required.
- Meets the 1% rule at list price ($2k rent vs $50k).
- Cap rate 28.7% vs local median 5.4% in Jackson — top-decile yield for the area; either an underpriced asset or a hidden risk that comps aren't pricing in. Stress-test before assuming the spread holds.
Location & tenants
- Location reads 74/100 on livability (#197 in MI, #4,970 nationally) — a middle-class / working-renter tenant base. Strengths: cost of living A+, housing A+, health & safety A+; Watch: schools D, crime F, employment F.
- Jackson Public Schools (urban): math 15% / reading 28% proficiency, ranked #458 of 540 in MI (top 85%) — low school quality limits family demand, transient renter base, plan for 1-2y turnover; 63% free/reduced lunch — lower-income household profile, screen leases tightly.
- Market conditions: Rents rising fast (+7.5%/yr); 164 active listings in the ZIP; 317 units permitted in Jackson County in 2024 (103 in 5+ unit buildings).
- This rent runs 38% of the median local income ($56k/yr) — at the standard rent-burdened threshold; future hikes will face affordability resistance.
Forward outlook
- Local home prices are declining (-3.0%/yr); year-one equity from $346 of loan paydown is wiped out by about $2k of value loss. Plan a longer hold.
- Jackson County population projected at -13% by 2050 — secular population decline; favor cash flow + early exit over multi-decade hold.
- At projected returns (-3.0% appreciation + 7.5% rent growth), your $14k cash investment doubles in ~2 years — after that, you're playing with house money.
Negotiation context
- Only 2 days on market — expect competitive offers; lowballing is unlikely to land.
- 11 sale attempts since 7y ago with the ask held roughly flat each time — persistent listings suggest the price (not the market) is what's stuck; bring a comps-based counter.
Risks & watch-outs
- Watch-outs: property tax is 4.8% of price; built in 1930 — expect roof / HVAC / electrical / plumbing capex.
Questions for the listing agent
- Built in 1930 — when were the roof, HVAC, electrical panel, plumbing, and water heater last replaced?
- Property tax is high relative to price — has the assessment been appealed recently, and will the sale trigger a re-assessment?
- Is there a deadline driving the sale (1031 exchange, divorce, estate, relocation)? That informs how much negotiation room exists.
- Schools are D-rated, which usually means shorter tenancies and higher turnover. Who's the typical renter profile here, and what's been the actual vacancy rate?
- Crime grade is F in this area — have there been break-ins, vandalism, or insurance claims at this property in the last 3 years? What carrier currently insures it and at what premium?
- What's the average days-on-market for RENTAL listings here right now (not sales)? A rising rental-DOM trend means longer vacancies and softer asking-rent achievability than the comps imply.
- What's the recent tenant-quality profile in this submarket — average credit score on applications, eviction rate, late-payment / NSF rate, and stable-employment percentage? A property-management company in the area should have these aggregated.
- How much new for-sale + rental construction is in the pipeline within 1–3 miles? Heavy new supply typically softens prices + rents 12–24 months out; constrained supply supports both.
Investment metrics
- 1% rule
- 3.59% ✓
- Cap rate
- 28.70%
- Cash-on-cash
- 80.03%
- DSCR
- 4.56
- GRM
- 2.3
CMA / ARV
- ARV (on-the-fly)
- $92,988
- Comps found
- 7
Show comp detail 7 sales within ~0.75 mi
| Address | Dist | Beds/Ba | Sqft | Sold | Price | $/sf | Match |
|---|---|---|---|---|---|---|---|
| 1505 Carl Breeding Way | 0.14mi | 4/2.0 (-1) | 1,607 (-7%) | 2mo | $162,000 | $101 | 76 |
| 314 Mitchell St | 0.40mi | 4/2.0 (-1) | 1,589 (-8%) | 1mo | $65,501 | $41 | 62 |
| 1413 Carl Breeding Way | 0.10mi | 4/1.5 (-1) | 1,519 (-12%) | 8mo | $82,000 | $54 | 62 |
| 1111 Maple Ave | 0.39mi | 4/2.0 (-1) | 1,700 (-1%) | 16mo | $45,000 | $26 | 62 |
| 181 W Prospect St | 0.56mi | 4/2.0 (-1) | 1,874 (+9%) | 3mo | $30,000 | $16 | 51 |
| 208 E Euclid Ave | 0.22mi | 5/2.0 | 1,516 (-12%) | 23mo | $94,000 | $62 | 50 |
| 1004 Williams St | 0.55mi | 4/2.0 (-1) | 1,568 (-9%) | 13mo | $175,000 | $112 | 44 |
Match score weights: distance 35% · size 25% · config 20% · recency 20%. Top-matched comps best support the ARV.
Projected returns pro-forma
-3.0% appreciation · 7.54% rent growth · sell at horizon
- IRR
- 85.9%
- Equity multiple
- 5.29×
- Total profit
- $60,058
- Equity at exit
- $7,455
- IRR
- 90.2%
- Equity multiple
- 13.00×
- Total profit
- $167,996
- Equity at exit
- $4,323
Cash invested: $14,000 (down + closing). Projections, not guarantees.
Landlord ↔ Tenant lean methodology
- Overall (STATE)
- 62 Landlord-Friendly
- State Michigan
- 62 Landlord-Friendly · EVEN
- County
- — inherits STATE
- City
- — inherits STATE
ZIP-level market 49203
- Home prices YoY
- -31.7%
- Rents YoY
- 7.5%
- Active inventory
- 164
- Price-to-rent
- 2.3×
Monthly cashflow live
- Estimated rent
- $1,796 medium interval (Pro) →
- Mortgage (P&I)
- −$262
- Tax from tax record
- −$202 /mo · $2,421/yr
- Insurance
- −$21
- HOA
- −$0
- Vacancy / Maint / Mgmt
- −$377
- Net cashflow
- $934
Break-even live
Sensitivity live
| Price | -10% $1,108 | -5% $1,090 | +0% $934 | +5% $920 | +10% $905 |
|---|---|---|---|---|---|
| Rent | -10% $792 | -5% $863 | +0% $934 | +5% $1,005 | +10% $1,076 |
| Rate | -1.0pp $959 | -0.5pp $946 | base $934 | +0.5pp $921 | +1.0pp $908 |
UW: 25.0% down · 7.5% · 30yr · 1.5% tax · 5.0% vac · 8.0% maint · 8.0% mgmt
Financing live
Cash to close
- Down payment
- $12,500
- Closing costs
- $1,500
- Reserves months
- —
- Total cash needed
- —
Loan-product check · same deal, 3 products live
Conventional
25% down · 7.5% · 30yr
- Down + closing
- —
- Monthly P&I
- —
- Monthly cashflow
- —
- DSCR
- —
- Eligible?
- —
Personal DTI + credit; lowest rate.
DSCR
20% down · 8.5% · 30yr
- Down + closing
- —
- Monthly P&I
- —
- Monthly cashflow
- —
- DSCR
- —
- Eligible?
- —
No personal income docs; deal must DSCR.
Hard money
10% down · 12.0% · 12mo
- Down + closing
- —
- Monthly P&I
- —
- Monthly cashflow
- —
- DSCR
- —
- Eligible?
- —
Short-term bridge; refi at stabilization.
Listing history 4 events
-
2026-06-19days on market $50,000 Active 2 DOM
-
2026-06-18remarks 691-char remark
-
2026-06-18remarks 403-char remark
-
2026-06-18$50,000 Active 1 DOM
ⓘ Source: listings_history table (triggers on properties + properties_extension) + one-shot
backfill from property_details.listing_events for pre-trigger history.
Tax reassessment forecast MI · Partial reset (capped growth)
- Current annual tax
- $2,421 · $202/mo
- Projected year-2 tax
- $2,421 · $202/mo
- Expected delta
- $0/yr ($0/mo · 0.0%)
ⓘ Screening estimate from a state-policy table — verify with the county assessor before closing.
Climate risk First Street
- Flood 1/10 Low FEMA zone X (unshaded) · 0% chance over 30 yrs
- Wildfire 1/10 Low
- Heat 3/10 Moderate 7 d/yr ≥98°F today · 15 d/yr by 30 yrs out
- Wind 2/10 Low
- Air quality 2/10 Low 1 unhealthy d/yr today · 1 by 30 yrs out
Nearby sold comps map
Loading sold comps map…
Walkable amenities ~0.75 mi
Loading nearby amenities…
Taxation est. · year 1
- Rental income
- $21,547
- − Mortgage interest
- −$2,801
- − Property taxes
- −$2,421
- − Insurance
- −$250
- − Repairs & maintenance
- −$1,724
- − Management
- −$1,724
- − Depreciation
- −$1,455
- Taxable income
- $11,173
- Est. tax owed @ 24.0%
- −$2,682
- After-tax cash flow
- $8,523/yr
For passive investors: Depreciation is non-cash, so a rental often shows a tax loss while cash-flowing — sheltering income. Rental losses are passive: they offset passive income freely, and up to $25,000/yr can offset ordinary (W-2) income if you actively participate and your MAGI is under $100k (phasing out to $0 by $150k); unused losses carry forward. On sale, claimed depreciation is recaptured at up to 25%, and gains may owe capital-gains tax (a 1031 exchange can defer both). Figures are a year-1 estimate at your 24.0% rate — not tax advice; consult a CPA.
Schools (NCES district)
- District
- Jackson Public Schools
- NCES district ID
- 2619620
- Math proficiency
- 15% ▼ -6.00%
- Reading proficiency
- 28% ▼ -3.00%
- Median HH income
- $38,344
- Composite
- 17.99/100
- National rank
- #8986
- State rank
- #458 of 540 in MI
Livability — Jackson
- Score
- 74/100
- State rank
- #197
- US rank
- #4970
Category grades
Schools grade is shown separately in the Schools card above.
Census & demographics
- Census place
- Jackson, MI
- County
- Jackson County · 85,581 people
- City population
- 85,581
- Metro
- Jackson, MI
- Population (ZIP)
- 36,474
- Household income
- $56,201
- Rent vs Own
- Severe rent burden
- 1383.0
Population outlook (Jackson County) Hauer SSP2
- Today (2025)
- 156,365 people
- By 2030
- 153,123 · -2.1%
- By 2040
- 144,981 · -7.3%
- By 2050
- 135,671 · -13.2%
- By 2075
- 113,833 · -27.2%
- By 2100
- 86,592 · -44.6%
Race, ethnicity, and origin ACS 2023
- Neighborhood character
- Predominantly White (73%)
- Race & ethnicity
- White 73% Black 15% Two or more races 9% Hispanic / Latino 5%
- Common ancestry
- Romanian 6% Lithuanian 3% Slovak 2%
- Foreign-born
- 2% · Canada
- Languages at home
- 97% English-only · Spanish 1% Other Indo-European 1%
Political lean MEDSL · Jackson
- 2024 margin
- Strong R (+21.3) · D 38.6% · R 59.9% · Other 1.5%
- 2008→2024 swing
- -23.7pp toward R · 2008: 2.4pp · 2024: -21.3pp
- All cycles
- 2024: R+21.3 2020: R+19.0 2016: R+20.1 2012: R+5.8 2008: D+2.4
Not yet ingested
- Civics
- —
Market trends
- HPI YoY
- ▼ -98.09%
- Current HPI
- 211.5474
- Rent YoY
- ▲ 7.54%
- Metro
- Jackson, MI
- State GDP YoY
- ▲ 1.37%
- F500 in state
- 28
Industry mix (Fortune 500 HQ in MI)
| Industry | F500 HQs | Revenue |
|---|---|---|
| Automotive Parts | 3 | $48B |
|
||
| Automotive | 2 | $372B |
|
||
| Chemicals | 1 | $45B |
|
||
| Automotive Retail | 1 | $29B |
|
||
| Healthcare / Medical Devices | 1 | $23B |
|
||
| Automotive Technology | 1 | $20B |
|
||
Price history
+0.2% since first listed32 events — show timeline
- 2026-06-17 Listed $50,000 SW Michigan MLS
- 2026-06-17 Listed $50,000 REALCOMP
- 2026-06-17 Listed $50,000 MiRealSource-MiMLS
- 2026-01-21 Listing Removed — MiRealSource-MiMLS
- 2026-01-21 Listing Removed — REALCOMP
- 2025-12-22 Contingent — MiRealSource-MiMLS
- 2025-12-22 Contingent — REALCOMP
- 2025-11-07 Listed $69,900 MiRealSource-MiMLS
- 2025-11-07 Listed $69,900 REALCOMP
- 2023-01-12 Sold (Public Records) $59,000 Public Records
- 2023-01-06 Sold (MLS) $59,000 SW Michigan MLS
- 2023-01-06 Sold (MLS) $59,000 REALCOMP
- 2022-11-15 Contingent — MiRealSource-MiMLS
- 2022-11-15 Contingent — REALCOMP
- 2022-11-15 Contingent — SW Michigan MLS
- 2022-11-15 Pending — MiRealSource-MiMLS
- 2022-11-14 Pending — REALCOMP
- 2022-11-14 Pending — SW Michigan MLS
- 2022-11-11 Listed $59,000 SW Michigan MLS
- 2022-11-11 Listed $59,000 MiRealSource-MiMLS
- 2022-11-11 Listed $59,000 REALCOMP
- 2019-12-04 Sold (Public Records) $39,900 Public Records
- 2019-11-25 Sold (MLS) $39,900 MiRealSource-MiMLS
- 2019-11-25 Sold (MLS) $39,900 SW Michigan MLS
- 2019-11-25 Sold (MLS) $39,900 REALCOMP
- 2019-10-21 Contingent — MiRealSource-MiMLS
- 2019-10-21 Contingent — REALCOMP
- 2019-10-06 Price Changed $39,900 MiRealSource-MiMLS
- 2019-10-06 Price Changed $39,900 REALCOMP
- 2019-08-23 Listed $49,900 MiRealSource-MiMLS
- 2019-08-23 Listed $39,900 SW Michigan MLS
- 2019-08-23 Listed $49,900 REALCOMP
Property tax history
+13.4%/yrLatest (2025): $2,421 · +2.3% YoY. Source: county tax records.
Cash-flow waterfall
monthlySold comps — $/sqft
last 12 mo · ≤1 miLoading sold comps…