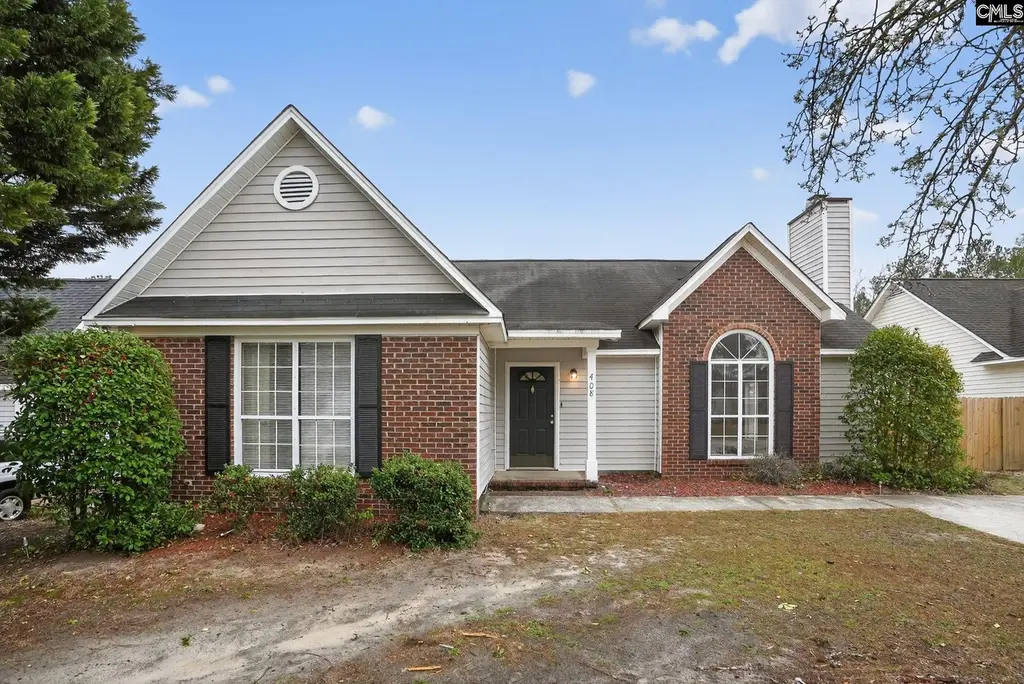
408 Thornfield Rd · Dentsville, SC
Flood risk 1/10 · Minimal
- FEMA flood zone
- X (unshaded)
- Chance of flooding over 30 yrs
- 0.0%
- Est. flood insurance / yr
- $507 – $1,088
Fire risk 4/10 · Minor
- Est. fire insurance / yr
- $783 – $1,453
Heat risk 7/10 · Major
- Hot days now (above 107°F)
- 7 days/yr
- Hot days in 30 yrs
- 16 days/yr
Wind risk 6/10 · Moderate
- Chance of severe wind over 30 yrs
- 61.0%
Air-quality risk 3/10 · Minor
- Unhealthy air days now
- 3 days/yr
- Unhealthy air days in 30 yrs
- 3 days/yr
Risk factors via First Street. Map © Google.
Why this score? — see what drove the D- grade
The composite is a weighted blend of 9 inputs, each scored 0–100. Each bar is that input's sub-score; the figure is the points it added to the 100-point composite (weight × sub-score).
- Cash flow +11.4/30.0
- ARV discount +7.5/15.0
- 1% rule +4.8/10.0
- Schools +3.6/10.0
- Livability +3.6/5.0
- DSCR +3.3/10.0
- Rent growth +3.2/5.0
- Condition / age +2.5/5.0
- Appreciation +0.0/10.0
$194,900
🖨 Deal sheet (PDF) 📄 Offer letter ✓ Due diligence
Listing remarks
Absolutely gorgeous 3-bedroom, 2-bath single-family home nestled on a beautiful, landscaped lot at 408 Thornfield Rd in Columbia. This charming one-story home offers wonderful curb appeal and a welcoming atmosphere from the moment you arrive. Inside, you'll find neutral colors, abundant natural light, and stylish custom lighting throughout. The spacious living room features a cozy fireplace, creating the perfect place to relax or gather with family and friends. A formal dining room provides an ideal space for hosting dinners and special occasions. The kitchen is both functional and inviting, complete with an amazing pantry for extra storage, a refrigerator and range, and a bright breakfast
Key facts
- Breakfast nook
- Formal dining room
- Amazing pantry
Tags
Property features AI
Exterior
- Utilities: Public sewer; Public water
- Home design: Single-story home; 0.2 acre lot; Public water
- Construction: Slab foundation
- Exterior features: Partial brick above foundation and vinyl exterior; Paved road access
Interior
- Bedrooms: Master bedroom on the main level; Second bedroom on the main level; Third bedroom on the main level
- Bathrooms: Two full bathrooms
- Heating & cooling: Central heating; Central cooling
- Interior features: One fireplace
- Laundry & utility: Washer and dryer located on the main level
Neighborhood map
What this means for you Summary
Snapshot
- This is a 3-bed/2.0-bath single-family listed at $195k.
Deal economics
- At list price, monthly cash flow is $-67 ($-804/yr) — negative.
- To cash-flow at today's rent, offer at most $183k (6.1% below list).
- To meet the 1% rule (rent ≥ 1% of price), the offer needs to be $191k (1.9% below list).
- Recommended offer: $183k (6.1% below list) — sets the bar for cash-flow.
Location & tenants
- Location reads 71/100 on livability (#50 in SC) — a middle-class / working-renter tenant base. Strengths: cost of living A+, health & safety A+, housing A; Watch: amenities D+, crime F, commute F.
- Richland 02 (suburban): math 35% / reading 47% proficiency, ranked #29 of 80 in SC (top 36%) — families likely to look elsewhere, expect single-tenant / working-renter base with shorter leases.
- Zoned schools: Killian Elementary (math 18% / reading 24%, grade F, #488 of 597 statewide, top 82%, 742 students, 100% FRL); Westwood High (math 47% / reading 87%, grade B, #73 of 196 statewide, top 41%, 1,684 students, 66% FRL) — zoned schools average 83% FRL vs 38% district-wide (45 pts higher); higher-poverty schools than district average — tighter screening recommended.
- Market conditions: Rents rising (+2.8%/yr); 406 active listings in the ZIP; 21 comparable units currently listed for rent nearby; rentals leasing fast (median 12d on market — plan ~1-2 weeks tenant-placement turnaround); 3,472 units permitted in Richland County in 2024 (1,096 in 5+ unit buildings).
- This rent runs 31% of the median local income ($74k/yr) — at the standard rent-burdened threshold; future hikes will face affordability resistance.
Forward outlook
- Local home prices are declining (-3.0%/yr); year-one equity from $1k of loan paydown is wiped out by about $6k of value loss. Plan a longer hold.
- Richland County population projected at +30% by 2050 — long-run rental-demand tailwind backs the buy-and-hold thesis.
Negotiation context
- It's been on market 35 days — a 3% lower offer ($189k) is reasonable based on typical stale-listing flexibility.
- 2 sale attempts since 13y ago; this cycle's ask has dropped $15k (7%) from the opening price — seller is motivated, your offer sets the floor, not the list.
Risks & watch-outs
- Watch-outs: property tax is 2.9% of price.
- Climate carrying-cost: major wind risk, 61% chance of damaging wind over 30y; extreme-heat days projected 7→16/yr by 2055 (HVAC capex compounding) — expect insurance premiums to compound above CPI over the hold.
Questions for the listing agent
- What do current leases actually rent for vs. the listed asking? Can we see a recent rent roll and the last 12 months of T-12 income?
- It's been on market 35 days. Have you received any prior offers? Is the seller open to a 6% concession, seller financing, or rate buy-down credit?
- Property tax is high relative to price — has the assessment been appealed recently, and will the sale trigger a re-assessment?
- Is there a deadline driving the sale (1031 exchange, divorce, estate, relocation)? That informs how much negotiation room exists.
- Schools are D-rated, which usually means shorter tenancies and higher turnover. Who's the typical renter profile here, and what's been the actual vacancy rate?
- Crime grade is F in this area — have there been break-ins, vandalism, or insurance claims at this property in the last 3 years? What carrier currently insures it and at what premium?
- The area grade is low — what's the realistic commute time and amenity access for the typical tenant pool here? Any planned neighborhood developments (good or bad) we should know about?
- What's the average days-on-market for RENTAL listings here right now (not sales)? A rising rental-DOM trend means longer vacancies and softer asking-rent achievability than the comps imply.
- What's the recent tenant-quality profile in this submarket — average credit score on applications, eviction rate, late-payment / NSF rate, and stable-employment percentage? A property-management company in the area should have these aggregated.
- How much new for-sale + rental construction is in the pipeline within 1–3 miles? Heavy new supply typically softens prices + rents 12–24 months out; constrained supply supports both.
Investment metrics
- 1% rule
- 0.98% ✗
- Cap rate
- 5.88%
- Cash-on-cash
- -1.47%
- DSCR
- 0.93
- GRM
- 8.5
CMA / ARV
No comps found within radius.
Projected returns pro-forma
-3.0% appreciation · 2.81% rent growth · sell at horizon
- IRR
- -18.9%
- Equity multiple
- 0.34×
- Total profit
- $-36,045
- Equity at exit
- $29,060
- IRR
- -11.6%
- Equity multiple
- 0.31×
- Total profit
- $-37,683
- Equity at exit
- $16,851
Cash invested: $54,572 (down + closing). Projections, not guarantees.
Landlord ↔ Tenant lean methodology
- Overall (STATE)
- 90 Strongly Landlord-Friendly
- State South Carolina
- 90 Strongly Landlord-Friendly · R+6
- County
- — inherits STATE
- City
- — inherits STATE
ZIP-level market 29229
- Home prices YoY
- -21.5%
- Rents YoY
- 2.8%
- Active inventory
- 406
- Price-to-rent
- 8.5×
Monthly cashflow live
- Estimated rent
- $1,913 high interval (Pro) →
- Mortgage (P&I)
- −$1,022
- Tax from tax record
- −$475 /mo · $5,696/yr
- Insurance
- −$81
- HOA
- −$0
- Vacancy / Maint / Mgmt
- −$402
- Net cashflow
- $-67
Break-even live
Sensitivity live
| Price | -10% $43 | -5% $-12 | +0% $-67 | +5% $-122 | +10% $-177 |
|---|---|---|---|---|---|
| Rent | -10% $-218 | -5% $-143 | +0% $-67 | +5% $9 | +10% $84 |
| Rate | -1.0pp $31 | -0.5pp $-17 | base $-67 | +0.5pp $-118 | +1.0pp $-169 |
UW: 25.0% down · 7.5% · 30yr · 1.5% tax · 5.0% vac · 8.0% maint · 8.0% mgmt
Financing live
Cash to close
- Down payment
- $48,725
- Closing costs
- $5,847
- Reserves months
- —
- Total cash needed
- —
Loan-product check · same deal, 3 products live
Conventional
25% down · 7.5% · 30yr
- Down + closing
- —
- Monthly P&I
- —
- Monthly cashflow
- —
- DSCR
- —
- Eligible?
- —
Personal DTI + credit; lowest rate.
DSCR
20% down · 8.5% · 30yr
- Down + closing
- —
- Monthly P&I
- —
- Monthly cashflow
- —
- DSCR
- —
- Eligible?
- —
No personal income docs; deal must DSCR.
Hard money
10% down · 12.0% · 12mo
- Down + closing
- —
- Monthly P&I
- —
- Monthly cashflow
- —
- DSCR
- —
- Eligible?
- —
Short-term bridge; refi at stabilization.
Rent comps 21 comps
| Address | Beds | Baths | Sqft | Rent | $/sqft | DOM | Units | Dist |
|---|---|---|---|---|---|---|---|---|
| 21 Winslow Ct Columbia, SC | 3.0 | 2.0 | 1220 | $1,649 | $1.35 | 22d | 1 | 0.17mi |
| 13 Tomafield Ct Columbia, SC | 3.0 | 2.0 | 1721 | $2,000 | $1.16 | 4d | 1 | 0.20mi |
| 508 Longtown Rd Columbia, SC | 1.0–3.0 | 1.0–2.0 | 984 | $1,316 | $1.34 | 4d | 26 | 0.46mi |
| 213 Sagamare Rd Columbia, SC | 4.0 | 3.0 | 1664 | $1,970 | $1.18 | 24d | 1 | 0.50mi |
| 102 Petworth Dr Columbia, SC | 4.0 | 3.0 | 1664 | $2,050 | $1.23 | 3d | 1 | 0.56mi |
| 201 Trowbridge Rd Columbia, SC | 3.0 | 2.0 | 1220 | $1,649 | $1.35 | 24d | 1 | 0.60mi |
| 608 Cottontail Ct N Columbia, SC | 4.0 | 2.0 | 1701 | $2,139 | $1.26 | 4d | 1 | 0.68mi |
| 108 Quinton Ln Columbia, SC | 3.0 | 2.0 | 1052 | $1,749 | $1.66 | 22d | 1 | 0.72mi |
| 109 Jaybird Ln Columbia, SC | 3.0 | 2.0 | 1250 | $1,679 | $1.34 | 3d | 1 | 0.86mi |
| 4500 Hard Scrabble Rd Columbia, SC | 1.0–3.0 | 1.0–2.0 | 1031 | $1,455 | $1.41 | 3d | 4 | 1.01mi |
| 502 Blue Garden Way Columbia, SC | 4.0 | 2.5 | 1775 | $2,183 | $1.23 | 15d | 1 | 1.14mi |
| 5 Elders Pond Ct Columbia, SC | 3.0 | 2.5 | 1640 | $1,795 | $1.09 | 15d | 1 | 1.23mi |
| 214 Elders Pond Dr Columbia, SC | 3.0 | 2.5 | 1400 | $1,350 | $0.96 | 11d | 1 | 1.26mi |
| 423 Elders Pond Cir Columbia, SC | 2.0 | 2.0 | 1125 | $1,475 | $1.31 | 19d | 1 | 1.28mi |
| 916 N Brickyard Rd Columbia, SC | 3.0 | 2.0 | 1350 | $1,695 | $1.26 | 15d | 1 | 1.32mi |
| 9641 Farrow Rd Columbia, SC | 2.0–3.0 | 2.0 | 1179 | $1,872 | $1.59 | 3d | 32 | 1.36mi |
| 3 Glen Knoll Ct Columbia, SC | 3.0 | 2.0 | 1320 | $1,699 | $1.29 | 11d | 1 | 1.44mi |
| 1116 Waverly Place Ln Columbia, SC | 3.0 | 2.0 | 1428 | $1,875 | $1.31 | 15d | 1 | 1.44mi |
| 1800 Killian Lakes Dr Columbia, SC | 1.0–3.0 | 1.0–2.5 | 1401 | $2,657 | $1.90 | 3d | 47 | 1.45mi |
| 1340 N Brickyard Rd Columbia, SC | 1.0–3.0 | 1.0–2.0 | 1061 | $1,860 | $1.75 | 3d | 34 | 1.46mi |
| 61 Bluebead Ct Columbia, SC | 4.0 | 2.0 | 1515 | $2,249 | $1.48 | 4d | 1 | 1.50mi |
Listing history 23 events
-
2026-06-18days on market $194,900 Active 35 DOM
-
2026-06-17days on market $194,900 Active 34 DOM
-
2026-06-16days on market $194,900 Active 33 DOM
-
2026-06-15pricedays on market $194,900 Active 32 DOM
-
2026-06-14days on market $204,900 Active 30 DOM
-
2026-06-13days on market $204,900 Active 29 DOM
-
2026-06-10days on market $204,900 Active 27 DOM
-
2026-06-09days on market $204,900 Active 26 DOM
-
2026-06-08days on market $204,900 Active 25 DOM
-
2026-06-07days on market $204,900 Active 24 DOM
-
2026-06-05days on market $204,900 Active 21 DOM
-
2026-06-03days on market $204,900 Active 20 DOM
-
2026-06-03days on market $204,900 Active 19 DOM
-
2026-06-01days on market $204,900 Active 18 DOM
-
2026-05-31days on market $204,900 Active 17 DOM
-
2026-05-14$209,900 Active
-
2026-04-25price $209,900
-
2022-08-29soldstatus $12,990,681
-
2018-07-20soldstatus $6,786,370
-
2013-12-20soldstatus $55,100
-
2013-09-20$52,900
-
2004-07-20soldstatus $92,900
-
1993-02-10soldstatus $76,850
ⓘ Source: listings_history table (triggers on properties + properties_extension) + one-shot
backfill from property_details.listing_events for pre-trigger history.
Tax reassessment forecast SC · Resets to sale price
- Current annual tax
- $5,696 · $475/mo
- Projected year-2 tax
- $5,696 · $475/mo
- Expected delta
- $0/yr ($0/mo · 0.0%)
ⓘ Screening estimate from a state-policy table — verify with the county assessor before closing.
Climate risk First Street
- Flood 1/10 Low FEMA zone X (unshaded) · 0% chance over 30 yrs
- Wildfire 4/10 Moderate
- Heat 7/10 Severe 7 d/yr ≥107°F today · 16 d/yr by 30 yrs out
- Wind 6/10 Major 61% chance of damaging wind over 30 yrs
- Air quality 3/10 Moderate 3 unhealthy d/yr today · 3 by 30 yrs out
Nearby sold comps map
Loading sold comps map…
Walkable amenities ~0.75 mi
Loading nearby amenities…
Taxation est. · year 1
- Rental income
- $22,951
- − Mortgage interest
- −$10,917
- − Property taxes
- −$5,696
- − Insurance
- −$974
- − Repairs & maintenance
- −$1,836
- − Management
- −$1,836
- − Depreciation
- −$5,670
- Taxable loss
- −$3,979
- Est. tax savings @ 24.0%
- +$955
- After-tax cash flow
- $151/yr
For passive investors: Depreciation is non-cash, so a rental often shows a tax loss while cash-flowing — sheltering income. Rental losses are passive: they offset passive income freely, and up to $25,000/yr can offset ordinary (W-2) income if you actively participate and your MAGI is under $100k (phasing out to $0 by $150k); unused losses carry forward. On sale, claimed depreciation is recaptured at up to 25%, and gains may owe capital-gains tax (a 1031 exchange can defer both). Figures are a year-1 estimate at your 24.0% rate — not tax advice; consult a CPA.
Schools (NCES district)
- District
- Richland 02
- NCES district ID
- 4503390
- Math proficiency
- 35% ▼ -15.00%
- Reading proficiency
- 47% ▼ -5.00%
- Median HH income
- $59,684
- Composite
- 36.2/100
- National rank
- #4730
- State rank
- #29 of 80 in SC
Livability — Dentsville
- Score
- 71/100
- State rank
- #50
- US rank
- #6940
Category grades
Schools grade is shown separately in the Schools card above.
Census & demographics
- County
- Richland County · 389,530 people
- City population
- 52,835
- Metro
- Columbia, SC
- Population (ZIP)
- 51,861
- Household income
- $74,043
- Rent vs Own
- Severe rent burden
- 1939.0
Population outlook (Richland County) Hauer SSP2
- Today (2025)
- 459,667 people
- By 2030
- 487,524 · +6.1%
- By 2040
- 542,035 · +17.9%
- By 2050
- 595,371 · +29.5%
- By 2075
- 732,998 · +59.5%
- By 2100
- 820,415 · +78.5%
Race, ethnicity, and origin ACS 2023
- Neighborhood character
- Diverse neighborhood (Simpson 0.56)
- Race & ethnicity
- Black 62% White 24% Hispanic / Latino 8% Two or more races 6% Asian 3%
- Hispanic origin (detail)
- Mexican 2% Puerto Rican 2%
- Common ancestry
- Slovak 1% Lithuanian 1% Romanian 1%
- Foreign-born
- 7% · Canada, South Korea, Jamaica
- Languages at home
- 89% English-only · Spanish 6% Other Indo-European 1% Korean 1%
Political lean MEDSL · Richland
- 2024 margin
- Solid D (+34.6) · D 66.4% · R 31.8% · Other 1.8%
- 2008→2024 swing
- +5.7pp toward D · 2008: 28.9pp · 2024: 34.6pp
- All cycles
- 2024: D+34.6 2020: D+38.3 2016: D+32.9 2012: D+33.3 2008: D+28.9
Not yet ingested
- Civics
- —
Market trends
- HPI YoY
- ▼ -51.11%
- Current HPI
- 186.782
- Rent YoY
- ▲ 2.81%
- Metro
- Columbia, SC
- State GDP YoY
- ▲ 4.51%
- F500 in state
- 2
Industry mix (Fortune 500 HQ in SC)
| Industry | F500 HQs | Revenue |
|---|---|---|
| Packaging | 1 | $7B |
|
||
Price history
+173.1% since first listed8 events — show timeline
- 2026-05-14 Listed $209,900 Consolidated MLS
- 2026-04-25 Price Changed $209,900 Consolidated MLS
- 2022-08-29 Sold (Public Records) $12,990,681 Public Records
- 2018-07-20 Sold (Public Records) $6,786,370 Public Records
- 2013-12-20 Sold (MLS) $55,100 Charleston Trident MLS
- 2013-09-20 Listed $52,900 Charleston Trident MLS
- 2004-07-20 Sold (Public Records) $92,900 Public Records
- 1993-02-10 Sold (Public Records) $76,850 Public Records
Property tax history
+15.5%/yrLatest (2025): $5,696 · +2.6% YoY. Source: county tax records.
Cash-flow waterfall
monthlySold comps — $/sqft
last 12 mo · ≤1 miLoading sold comps…