 Multi-family
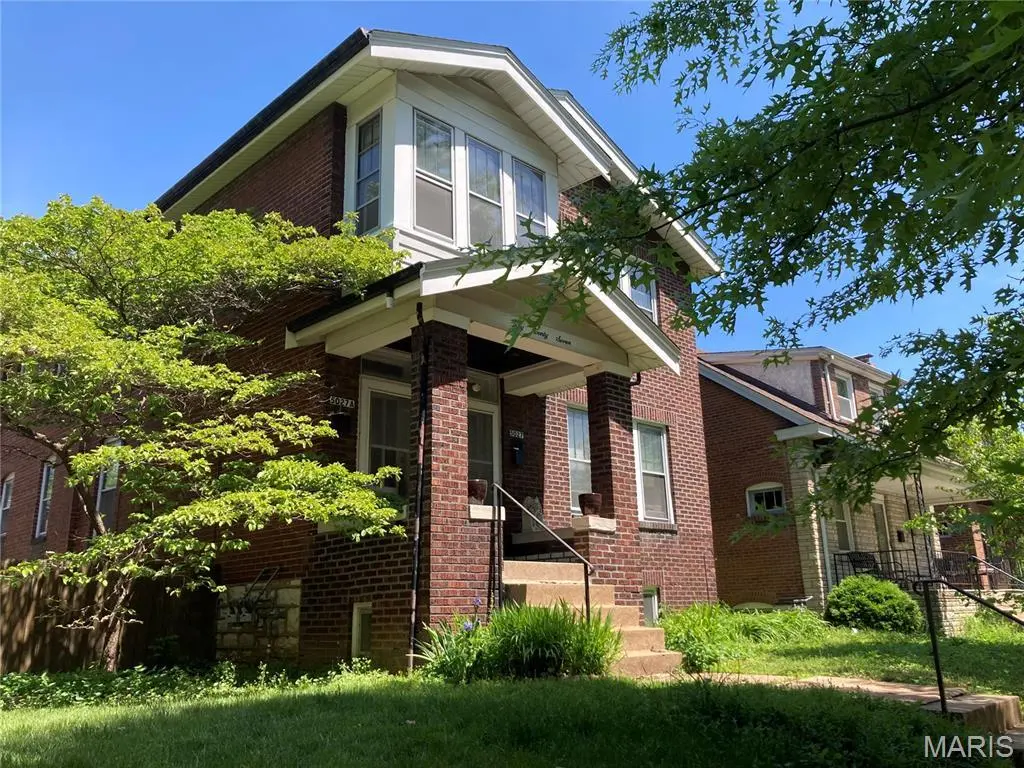
5027 Sutherland Ave · St. Louis, MO
Flood risk 1/10 · Minimal
- FEMA flood zone
- X (unshaded)
- Chance of flooding over 30 yrs
- 0.0%
- Est. flood insurance / yr
- $473 – $860
Fire risk 1/10 · Minimal
- Est. fire insurance / yr
- $1,054 – $1,958
Heat risk 5/10 · Moderate
- Hot days now (above 108°F)
- 7 days/yr
- Hot days in 30 yrs
- 21 days/yr
Wind risk 2/10 · Minimal
- Chance of severe wind over 30 yrs
- 1.0%
Air-quality risk 3/10 · Minor
- Unhealthy air days now
- 3 days/yr
- Unhealthy air days in 30 yrs
- 4 days/yr
Risk factors via First Street. Map © Google.
Why this score? — see what drove the D grade
The composite is a weighted blend of 9 inputs, each scored 0–100. Each bar is that input's sub-score; the figure is the points it added to the 100-point composite (weight × sub-score).
- ARV discount +15.0/15.0
- Cash flow +11.7/30.0
- Rent growth +3.5/5.0
- DSCR +3.4/10.0
- 1% rule +3.1/10.0
- Livability +2.5/5.0
- Condition / age +2.5/5.0
- Schools +1.2/10.0
- Appreciation +0.0/10.0
$250,000
🖨 Deal sheet (PDF) 📄 Offer letter ✓ Due diligence
Multi-family units
County records classify this as Multi-Family (2-4 Unit). Listing-text estimate: 1 unit. estimate disagrees with records
Listing remarks
This handsome brick building features two generously sized apartments offering over 1,200 square feet each. Stained glass windows, decorative fireplaces, oak floors, and built-in bookcases add architectural charm. The systems and roof are newer, and a sturdy masonry garage provides offstreet parking and storage. Located in the desirable Southampton neighborhood on a block with a nice mix of single family homes and duplexes, it's a short walk or bike ride to lots of great City amenities.
Key facts
- Built-in bookcases
- Newer roof
- Newer systems
Tags
Property features AI
Finance
- Other: Property type: Residential income (2-4 units)
- Financial info: Gross rental income reported at $9,000; 2 total units, 1 currently leased
Exterior
- Parking: 2-car garage; On-street parking available; Garage(s) on property
- Utilities: Public water; Electric service by Ameren
- Home design: Duplex (2-unit residential income property); Two levels; Private ownership
- Construction: Brick construction; Architectural shingle roof; Stone foundation; Built information per assessor
- Exterior features: Covered, glass-enclosed porch; Front and back yards; Concrete road frontage on a city street; Near public transit; Porch with storm and panel doors
Interior
- Kitchen: Refrigerator included; Eat-in kitchen
- Basement: Full unfinished basement with walk-up access
- Bedrooms: One 2-bedroom unit; One 3-bedroom unit
- Flooring: Hardwood floors
- Bathrooms: Each unit has 1 bathroom
- Heating & cooling: Forced air heating; Central air conditioning
- Interior features: Built-in bookcases; Ceiling fans; Eat-in kitchen; Decorative fireplaces (2)
- Laundry & utility: Water heater
Neighborhood map
What this means for you Summary
Snapshot
- This is a 5-bed/2.0-bath multifamily listed at $250k.
Deal economics
- At list price, monthly cash flow is $-73 ($-881/yr) — negative.
- To cash-flow at today's rent, offer at most $237k (5.2% below list).
- To meet the 1% rule (rent ≥ 1% of price), the offer needs to be $203k (18.8% below list).
- Recommended offer: $203k (18.8% below list) — sets the bar for 1% rule.
Location & tenants
- Location reads: area grade D — affects rentability + tenant quality, not the cash-flow math above.
- St. Louis City (urban): math 10% / reading 18% proficiency, ranked #312 of 324 in MO (top 96%) — low school quality limits family demand, transient renter base, plan for 1-2y turnover; 80% free/reduced lunch — lower-income household profile, screen leases tightly.
- Zoned schools: Buder Elem. (math 12% / reading 22%, grade F, #967 of 1,115 statewide, top 88%, 403 students, 99% FRL); Gateway Middle (math 0% / reading 8%, grade F, #389 of 391 statewide, top 100%, 506 students, 99% FRL); Roosevelt High (math 2% / reading 8%, grade F, #517 of 521 statewide, top 100%, 460 students, 99% FRL) — zoned schools average 99% FRL vs 80% district-wide (19 pts higher); higher-poverty schools than district average — tighter screening recommended.
- Market conditions: Rents rising (+4.0%/yr); 151 active listings in the ZIP; 1 comparable units currently listed for rent nearby; 294 units permitted in St. Louis city in 2024 (227 in 5+ unit buildings).
- This rent runs 35% of the median local income ($70k/yr) — at the standard rent-burdened threshold; future hikes will face affordability resistance.
Forward outlook
- Local home prices are declining (-3.0%/yr); year-one equity from $2k of loan paydown is wiped out by about $8k of value loss. Plan a longer hold.
- St. Louis County population projected to shrink 6% by 2050 — rents likely to lag national; underwrite the cash flow, not the appreciation.
Negotiation context
- It's been on market 46 days — a 3% lower offer ($242k) is reasonable based on typical stale-listing flexibility.
- Current owner paid $164k; list at $250k implies a 52% gain — meaningful room to come down on a strong offer.
Risks & watch-outs
- Watch-outs: built in 1923 — expect roof / HVAC / electrical / plumbing capex.
- Climate carrying-cost: extreme-heat days projected 7→21/yr by 2055 (HVAC capex compounding) — expect insurance premiums to compound above CPI over the hold.
Questions for the listing agent
- What do current leases actually rent for vs. the listed asking? Can we see a recent rent roll and the last 12 months of T-12 income?
- It's been on market 46 days. Have you received any prior offers? Is the seller open to a 19% concession, seller financing, or rate buy-down credit?
- Built in 1923 — when were the roof, HVAC, electrical panel, plumbing, and water heater last replaced?
- Is there a deadline driving the sale (1031 exchange, divorce, estate, relocation)? That informs how much negotiation room exists.
- The area grade is low — what's the realistic commute time and amenity access for the typical tenant pool here? Any planned neighborhood developments (good or bad) we should know about?
- What's the average days-on-market for RENTAL listings here right now (not sales)? A rising rental-DOM trend means longer vacancies and softer asking-rent achievability than the comps imply.
- What's the recent tenant-quality profile in this submarket — average credit score on applications, eviction rate, late-payment / NSF rate, and stable-employment percentage? A property-management company in the area should have these aggregated.
- How much new apartment / multifamily construction is in the pipeline within 1–3 miles? Heavy new supply (>2% of stock underway) typically softens rents 12–24 months out; light construction supports rent growth.
Investment metrics
- 1% rule
- 0.81% ✗
- Cap rate
- 5.94%
- Cash-on-cash
- -1.26%
- DSCR
- 0.94
- GRM
- 10.3
CMA / ARV
- ARV (median comp)
- $339,993
- List price
- $250,000
- Delta
- -26.47%
- Verdict
- UNDERPRICED
- Comps
- 20 within 1.0 mi
Show comp detail 12 sales within ~0.75 mi
| Address | Dist | Beds/Ba | Sqft | Sold | Price | $/sf | Match |
|---|---|---|---|---|---|---|---|
| 5234 Devonshire Ave | 0.20mi | 4/2.0 (-1) | 2,424 (0%) | 2mo | $330,000 | $136 | 84 |
| 5045 Lindenwood Ave | 0.25mi | 4/2.0 (-1) | 2,438 (+1%) | 2mo | $239,900 | $98 | 81 |
| 4953 Chippewa St | 0.26mi | 4/2.0 (-1) | 2,560 (+6%) | 0mo | $285,000 | $111 | 73 |
| 4967 Mardel Ave | 0.35mi | 4/2.0 (-1) | 2,300 (-5%) | 2mo | $300,000 | $130 | 69 |
| 4947 Murdoch Ave | 0.20mi | 6/3.0 (+1) | 2,640 (+9%) | 1mo | $299,000 | $113 | 66 |
| 5009 Miami St | 0.48mi | 4/2.0 (-1) | 2,374 (-2%) | 3mo | $300,000 | $126 | 66 |
| 4972 Tholozan Ave | 0.38mi | 4/2.0 (-1) | 2,268 (-6%) | 1mo | $270,000 | $119 | 66 |
| 4654 Delor St | 0.48mi | 4/2.0 (-1) | 2,316 (-4%) | 2mo | $154,900 | $67 | 63 |
| 4969 Walsh St | 0.50mi | 5/2.0 | 2,620 (+8%) | 3mo | $289,000 | $110 | 61 |
| 4926 Murdoch Ave | 0.24mi | 4/2.0 (-1) | 2,100 (-13%) | 2mo | $285,000 | $136 | 60 |
| 5425 5425A Christy Boulevard St. Louis Mo. 63116 Blvd | 0.74mi | 4/2.0 (-1) | 2,496 (+3%) | 3mo | $149,900 | $60 | 54 |
| 5600 S Kingshighway Blvd | 0.72mi | 4/2.0 (-1) | 2,268 (-6%) | 5mo | $250,000 | $110 | 47 |
Match score weights: distance 35% · size 25% · config 20% · recency 20%. Top-matched comps best support the ARV.
Projected returns pro-forma
-3.0% appreciation · 3.98% rent growth · sell at horizon
- IRR
- -17.3%
- Equity multiple
- 0.38×
- Total profit
- $-43,164
- Equity at exit
- $37,276
- IRR
- -7.6%
- Equity multiple
- 0.50×
- Total profit
- $-35,146
- Equity at exit
- $21,615
Cash invested: $70,000 (down + closing). Projections, not guarantees.
Landlord ↔ Tenant lean methodology
- Overall (STATE)
- 81 Strongly Landlord-Friendly
- State Missouri
- 81 Strongly Landlord-Friendly · R+10
- County
- — inherits STATE
- City
- — inherits STATE
ZIP-level market 63109
- Rents YoY
- 4.0%
- Active inventory
- 151
- Price-to-rent
- 10.3×
Monthly cashflow live
- Estimated rent
- $2,030 medium interval (Pro) →
- Mortgage (P&I)
- −$1,311
- Tax from tax record
- −$262 /mo · $3,141/yr
- Insurance
- −$104
- HOA
- −$0
- Vacancy / Maint / Mgmt
- −$426
- Net cashflow
- $-73
Break-even live
Sensitivity live
| Price | -10% $68 | -5% $-3 | +0% $-73 | +5% $-144 | +10% $-215 |
|---|---|---|---|---|---|
| Rent | -10% $-234 | -5% $-154 | +0% $-73 | +5% $7 | +10% $87 |
| Rate | -1.0pp $53 | -0.5pp $-10 | base $-73 | +0.5pp $-138 | +1.0pp $-204 |
UW: 25.0% down · 7.5% · 30yr · 1.5% tax · 5.0% vac · 8.0% maint · 8.0% mgmt
Financing live
Cash to close
- Down payment
- $62,500
- Closing costs
- $7,500
- Reserves months
- —
- Total cash needed
- —
Loan-product check · same deal, 3 products live
Conventional
25% down · 7.5% · 30yr
- Down + closing
- —
- Monthly P&I
- —
- Monthly cashflow
- —
- DSCR
- —
- Eligible?
- —
Personal DTI + credit; lowest rate.
DSCR
20% down · 8.5% · 30yr
- Down + closing
- —
- Monthly P&I
- —
- Monthly cashflow
- —
- DSCR
- —
- Eligible?
- —
No personal income docs; deal must DSCR.
Hard money
10% down · 12.0% · 12mo
- Down + closing
- —
- Monthly P&I
- —
- Monthly cashflow
- —
- DSCR
- —
- Eligible?
- —
Short-term bridge; refi at stabilization.
Rent comps 1 comps
| Address | Beds | Baths | Sqft | Rent | $/sqft | DOM | Units | Dist |
|---|---|---|---|---|---|---|---|---|
| 6020 Juniata St Saint Louis, MO | 4.0 | 2.0 | 1661 | $2,750 | $1.66 | 5d | 1 | 1.30mi |
Listing history 13 events
-
2026-06-10status $250,000 Pending 46 DOM
-
2026-06-09days on market $250,000 Active 46 DOM
-
2026-06-08days on market $250,000 Active 45 DOM
-
2026-06-07pricedays on market $250,000 Active 44 DOM
-
2026-06-05days on market $285,000 Active 41 DOM
-
2026-06-03days on market $285,000 Active 40 DOM
-
2026-06-02days on market $285,000 Active 39 DOM
-
2026-06-01days on market $285,000 Active 38 DOM
-
2026-05-31days on market $285,000 Active 37 DOM
-
2026-05-16price $285,000 491-char remark
-
2026-04-24$300,000 Active 491-char remark
-
2010-05-12soldstatus $164,000
-
1993-07-09soldstatus
ⓘ Source: listings_history table (triggers on properties + properties_extension) + one-shot
backfill from property_details.listing_events for pre-trigger history.
Tax reassessment forecast MO · Resets to sale price
- Current annual tax
- $3,141 · $262/mo
- Projected year-2 tax
- $3,141 · $262/mo
- Expected delta
- $0/yr ($0/mo · 0.0%)
ⓘ Screening estimate from a state-policy table — verify with the county assessor before closing.
Climate risk First Street
- Flood 1/10 Low FEMA zone X (unshaded) · 0% chance over 30 yrs
- Wildfire 1/10 Low
- Heat 5/10 Major 7 d/yr ≥108°F today · 21 d/yr by 30 yrs out
- Wind 2/10 Low 100% chance of damaging wind over 30 yrs
- Air quality 3/10 Moderate 3 unhealthy d/yr today · 4 by 30 yrs out
Nearby sold comps map
Loading sold comps map…
Walkable amenities ~0.75 mi
Loading nearby amenities…
Taxation est. · year 1
- Rental income
- $24,358
- − Mortgage interest
- −$14,004
- − Property taxes
- −$3,141
- − Insurance
- −$1,250
- − Repairs & maintenance
- −$1,949
- − Management
- −$1,949
- − Depreciation
- −$7,273
- Taxable loss
- −$5,207
- Est. tax savings @ 24.0%
- +$1,250
- After-tax cash flow
- $369/yr
For passive investors: Depreciation is non-cash, so a rental often shows a tax loss while cash-flowing — sheltering income. Rental losses are passive: they offset passive income freely, and up to $25,000/yr can offset ordinary (W-2) income if you actively participate and your MAGI is under $100k (phasing out to $0 by $150k); unused losses carry forward. On sale, claimed depreciation is recaptured at up to 25%, and gains may owe capital-gains tax (a 1031 exchange can defer both). Figures are a year-1 estimate at your 24.0% rate — not tax advice; consult a CPA.
Schools (NCES district)
- District
- St. Louis City
- NCES district ID
- 2929280
- Math proficiency
- 10% ▼ -6.00%
- Reading proficiency
- 18% ▼ -3.00%
- Median HH income
- $35,685
- Composite
- 11.54/100
- National rank
- #9699
- State rank
- #312 of 324 in MO
Livability — St. Louis
No livability data for this city. (Only ~50 U.S. cities are tracked.)
Census & demographics
- Census place
- St. Louis, MO
- County
- Saint Louis City · 254,015 people
- City population
- 283,259
- Metro
- St. Louis, MO-IL
- Population (ZIP)
- 25,236
- Household income
- $69,938
- Rent vs Own
- Severe rent burden
- 922.0
Population outlook (St. Louis County) Hauer SSP2
- Today (2025)
- 315,737 people
- By 2030
- 313,865 · -0.6%
- By 2040
- 305,439 · -3.3%
- By 2050
- 296,529 · -6.1%
- By 2075
- 271,028 · -14.2%
- By 2100
- 255,359 · -19.1%
Race, ethnicity, and origin ACS 2023
- Neighborhood character
- Predominantly White (87%)
- Race & ethnicity
- White 87% Black 6% Two or more races 3% Hispanic / Latino 3% Asian 1%
- Common ancestry
- Romanian 3% Lithuanian 3% Slovak 2%
- Foreign-born
- 4% · Canada
- Languages at home
- 94% English-only · Other Indo-European 2% Spanish 1% Russian/Polish/Slavic 1%
Political lean MEDSL · St. Louis
- 2024 margin
- Solid D (+64.7) · D 81.4% · R 16.7% · Other 2.0%
- 2008→2024 swing
- -3.5pp toward R · 2008: 68.2pp · 2024: 64.7pp
- All cycles
- 2024: D+64.7 2020: D+66.2 2016: D+63.7 2012: D+66.6 2008: D+68.2
Not yet ingested
- Civics
- —
Market trends
- HPI YoY
- ▼ -215.58%
- Current HPI
- 250.5412
- Rent YoY
- ▲ 3.98%
- Metro
- St. Louis, MO-IL
- State GDP YoY
- ▲ 1.84%
- F500 in state
- 20
Industry mix (Fortune 500 HQ in MO)
| Industry | F500 HQs | Revenue |
|---|---|---|
| Healthcare | 1 | $163B |
|
||
| Insurance | 1 | $21B |
|
||
| Industrial Technology | 1 | $17B |
|
||
| Retail | 1 | $16B |
|
||
| Industrial Distribution | 1 | $10B |
|
||
| Utilities | 1 | $9B |
|
||
Price history
+52.4% since first listed6 events — show timeline
- 2026-06-09 Pending — MARIS as Distributed by MLS Grid
- 2026-06-06 Price Changed $250,000 MARIS as Distributed by MLS Grid
- 2026-05-16 Price Changed $285,000 MARIS as Distributed by MLS Grid
- 2026-04-24 Listed $300,000 MARIS as Distributed by MLS Grid
- 2010-05-12 Sold (Public Records) $164,000 Public Records
- 1993-07-09 Sold (Public Records) — Public Records
Property tax history
+5.5%/yrLatest (2024): $3,141 · +5.1% YoY. Source: county tax records.
Cash-flow waterfall
monthlySold comps — $/sqft
last 12 mo · ≤1 miLoading sold comps…