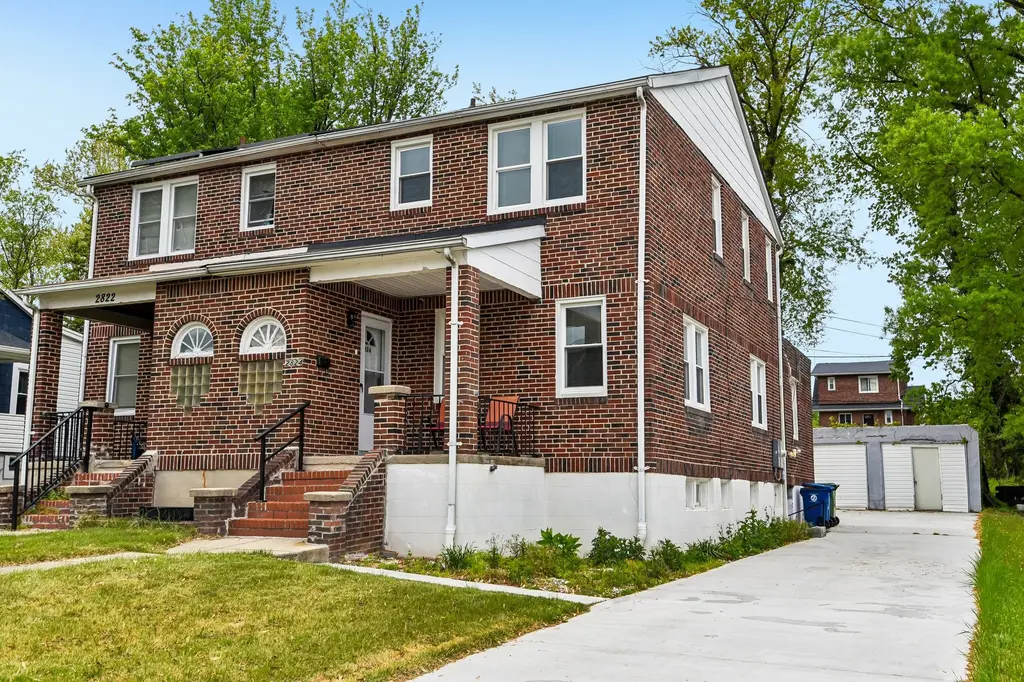
2824 Fleetwood Ave · Baltimore, MD
Flood risk 1/10 · Minimal
- FEMA flood zone
- X (unshaded)
- Chance of flooding over 30 yrs
- 0.0%
- Est. flood insurance / yr
- $473 – $860
Fire risk 1/10 · Minimal
- Est. fire insurance / yr
- $755 – $1,403
Heat risk 7/10 · Major
- Hot days now (above 104°F)
- 7 days/yr
- Hot days in 30 yrs
- 15 days/yr
Wind risk 6/10 · Moderate
- Chance of severe wind over 30 yrs
- 27.0%
Air-quality risk 4/10 · Minor
- Unhealthy air days now
- 3 days/yr
- Unhealthy air days in 30 yrs
- 6 days/yr
Risk factors via First Street. Map © Google.
Why this score? — see what drove the D grade
The composite is a weighted blend of 9 inputs, each scored 0–100. Each bar is that input's sub-score; the figure is the points it added to the 100-point composite (weight × sub-score).
- Cash flow +19.3/30.0
- DSCR +6.1/10.0
- 1% rule +4.9/10.0
- Livability +3.8/5.0
- Rent growth +2.5/5.0
- Condition / age +2.5/5.0
- ARV discount +2.4/15.0
- Schools +1.0/10.0
- Appreciation +0.0/10.0
$230,000
🖨 Deal sheet (PDF) 📄 Offer letter ✓ Due diligence
Listing remarks MLS
SPACIOUS 4 BED & A DEN IN A QUIET HOMEOWNER NEIGHBORHOOD. NEW ROOF IN 2020, NEW FURNACE AND RADIATORS. FEW YR. OLD HOTWATER UNIT & APPLIANCES. CLOSE TO TRANSPORTATION, SHOPPING & STATE MORGON UNIVERSITY. HARDWOOD FLOORS THROUGH OUT 1ST AND 2ND FLOOR. Must see. Owner not aware of any possible Ground rent, buyer needs to check.
Key facts
- Pass-through window
- Backyard
- Separate dining area
Tags
Property features AI
Exterior
- Parking: On-street parking; Driveway
- Utilities: Public water; Public sewer
- Home design: Semi-detached brick home; Major remodel or renovation in 2021; Fee simple ownership
- Construction: Brick construction; Permanent foundation; Above-grade and below-grade finished areas
- Exterior features: Property is within city limits; No tidal water
Interior
- Bedrooms: Three bedrooms on the upper level; One bedroom on the main level
- Bathrooms: Two full bathrooms; One half bathroom
- Heating & cooling: Radiator heating; Window air conditioning units (electric)
- Interior features: Partially finished basement
Neighborhood map
What this means for you Summary
Snapshot
- This is a 4-bed/2.5-bath townhouse listed at $230k.
Deal economics
- At list price, monthly cash flow is $254 ($3k/yr) — positive.
- The deal already cash-flows at list — no discount required.
- To meet the 1% rule (rent ≥ 1% of price), the offer needs to be $228k (0.7% below list).
- Recommended offer: $223k (3.0% below list) — sets the bar for market timing.
- Cap rate 7.6% vs local median 6.0% in Baltimore — meaningfully above typical; check what's discounted (condition, days-on-market, listing class) to confirm the premium yield is real.
Location & tenants
- Location reads 76/100 on livability (#90 in MD, #3,396 nationally) — a middle-class / working-renter tenant base. Strengths: amenities A+, commute A+, housing A+; Watch: schools D, crime F.
- Baltimore City Public Schools (urban): math 7% / reading 16% proficiency, ranked #24 of 24 in MD (top 100%) — low school quality limits family demand, transient renter base, plan for 1-2y turnover; 79% free/reduced lunch — lower-income household profile, screen leases tightly.
- Market conditions: 96 active listings in the ZIP; 28 comparable units currently listed for rent nearby; rentals at typical pace (median 25d on market — plan ~3-4 weeks tenant-placement turnaround); 46% of comp listings sitting > 30 days — soft ceiling on asking rent; solid renter incomes; 1,273 units permitted in Baltimore city in 2024 (1,104 in 5+ unit buildings).
- This rent runs 32% of the median local income ($86k/yr) — at the standard rent-burdened threshold; future hikes will face affordability resistance.
Forward outlook
- Local home prices are declining (-3.0%/yr); year-one equity from $2k of loan paydown is wiped out by about $7k of value loss. Plan a longer hold.
- Baltimore County population projected to shrink 4% by 2050 — rents likely to lag national; underwrite the cash flow, not the appreciation.
Negotiation context
- It's been on market 48 days — a 3% lower offer ($223k) is reasonable based on typical stale-listing flexibility.
- 19 sale attempts since 29y ago; this cycle's ask has dropped $15k (6%) from the opening price — seller is motivated, your offer sets the floor, not the list.
- Current owner paid $186k; 23% above their basis — modest negotiation headroom, anchor on the comps not their cost.
Risks & watch-outs
- Watch-outs: built in 1940 — expect roof / HVAC / electrical / plumbing capex.
- Climate carrying-cost: major wind risk, 27% chance of damaging wind over 30y; extreme-heat days projected 7→15/yr by 2055 (HVAC capex compounding) — expect insurance premiums to compound above CPI over the hold.
Questions for the listing agent
- It's been on market 48 days. Have you received any prior offers? Is the seller open to a 3% concession, seller financing, or rate buy-down credit?
- Built in 1940 — when were the roof, HVAC, electrical panel, plumbing, and water heater last replaced?
- Is there a deadline driving the sale (1031 exchange, divorce, estate, relocation)? That informs how much negotiation room exists.
- Schools are D-rated, which usually means shorter tenancies and higher turnover. Who's the typical renter profile here, and what's been the actual vacancy rate?
- Crime grade is F in this area — have there been break-ins, vandalism, or insurance claims at this property in the last 3 years? What carrier currently insures it and at what premium?
- The area grade is low — what's the realistic commute time and amenity access for the typical tenant pool here? Any planned neighborhood developments (good or bad) we should know about?
- What's the average days-on-market for RENTAL listings here right now (not sales)? A rising rental-DOM trend means longer vacancies and softer asking-rent achievability than the comps imply.
- What's the recent tenant-quality profile in this submarket — average credit score on applications, eviction rate, late-payment / NSF rate, and stable-employment percentage? A property-management company in the area should have these aggregated.
- How much new for-sale + rental construction is in the pipeline within 1–3 miles? Heavy new supply typically softens prices + rents 12–24 months out; constrained supply supports both.
Investment metrics
- 1% rule
- 0.99% ✗
- Cap rate
- 7.62%
- Cash-on-cash
- 4.74%
- DSCR
- 1.21
- GRM
- 8.4
CMA / ARV
- ARV (median comp)
- $206,654
- List price
- $230,000
- Delta
- 11.30%
- Verdict
- OVERPRICED
- Comps
- 20 within 1.0 mi
Show comp detail 12 sales within ~0.75 mi
| Address | Dist | Beds/Ba | Sqft | Sold | Price | $/sf | Match |
|---|---|---|---|---|---|---|---|
| 2717 Kildaire Dr | 0.24mi | 3/1.5 (-1) | 1,560 (-6%) | 2mo | $264,900 | $170 | 68 |
| 6910 Old Harford Rd | 0.37mi | 3/2.0 (-1) | 1,557 (-6%) | 3mo | $208,000 | $134 | 63 |
| 2924 Fleetwood Ave | 0.12mi | 3/1.0 (-1) | 1,434 (-14%) | 5mo | $205,000 | $143 | 57 |
| 2922 Harview | 0.63mi | 3/1.5 (-1) | 1,728 (+4%) | 1mo | $190,000 | $110 | 54 |
| 6508 Belle Vista Ave | 0.75mi | 3/1.5 (-1) | 1,620 (-2%) | 4mo | $260,000 | $160 | 49 |
| 3158 Woodring Ave | 0.54mi | 3/1.5 (-1) | 1,500 (-10%) | 2mo | $239,900 | $160 | 48 |
| 3126 Woodring Ave | 0.46mi | 3/1.0 (-1) | 1,500 (-10%) | 5mo | $172,780 | $115 | 48 |
| 3217 Woodring Ave | 0.59mi | 3/2.0 (-1) | 1,452 (-12%) | 2mo | $265,000 | $183 | 43 |
| 3219 Woodring Ave | 0.60mi | 3/2.0 (-1) | 1,452 (-12%) | 3mo | $255,000 | $176 | 42 |
| 2818 Glendale Ave | 0.71mi | 3/1.0 (-1) | 1,550 (-7%) | 6mo | $160,000 | $103 | 40 |
| 3401 Woodring Ave | 0.74mi | 4/2.0 | 1,500 (-10%) | 11mo | $250,000 | $167 | 39 |
| 2901 Harview Ave | 0.59mi | 3/1.5 (-1) | 1,892 (+14%) | 2mo | $280,000 | $148 | 38 |
Match score weights: distance 35% · size 25% · config 20% · recency 20%. Top-matched comps best support the ARV.
Projected returns pro-forma
-3.0% appreciation · 3.0% rent growth · sell at horizon
- IRR
- -8.9%
- Equity multiple
- 0.67×
- Total profit
- $-21,074
- Equity at exit
- $34,294
- IRR
- 0.6%
- Equity multiple
- 1.04×
- Total profit
- $2,530
- Equity at exit
- $19,886
Cash invested: $64,400 (down + closing). Projections, not guarantees.
Landlord ↔ Tenant lean methodology
- Overall (CITY)
- 12 Strongly Tenant-Friendly
- State Maryland
- 27 Tenant-Leaning · D+14
- County
- — inherits STATE
- City Baltimore
- 12 Strongly Tenant-Friendly · D+58
ZIP-level market 21214
- Active inventory
- 96
- Price-to-rent
- 8.4×
Monthly cashflow live
- Estimated rent
- $2,283 high interval (Pro) →
- Mortgage (P&I)
- −$1,206
- Tax from tax record
- −$247 /mo · $2,968/yr
- Insurance
- −$96
- HOA
- −$0
- Vacancy / Maint / Mgmt
- −$479
- Net cashflow
- $254
Break-even live
Sensitivity live
| Price | -10% $384 | -5% $319 | +0% $254 | +5% $189 | +10% $124 |
|---|---|---|---|---|---|
| Rent | -10% $74 | -5% $164 | +0% $254 | +5% $344 | +10% $434 |
| Rate | -1.0pp $370 | -0.5pp $313 | base $254 | +0.5pp $195 | +1.0pp $134 |
UW: 25.0% down · 7.5% · 30yr · 1.5% tax · 5.0% vac · 8.0% maint · 8.0% mgmt
Financing live
Cash to close
- Down payment
- $57,500
- Closing costs
- $6,900
- Reserves months
- —
- Total cash needed
- —
Loan-product check · same deal, 3 products live
Conventional
25% down · 7.5% · 30yr
- Down + closing
- —
- Monthly P&I
- —
- Monthly cashflow
- —
- DSCR
- —
- Eligible?
- —
Personal DTI + credit; lowest rate.
DSCR
20% down · 8.5% · 30yr
- Down + closing
- —
- Monthly P&I
- —
- Monthly cashflow
- —
- DSCR
- —
- Eligible?
- —
No personal income docs; deal must DSCR.
Hard money
10% down · 12.0% · 12mo
- Down + closing
- —
- Monthly P&I
- —
- Monthly cashflow
- —
- DSCR
- —
- Eligible?
- —
Short-term bridge; refi at stabilization.
Rent comps 28 comps
| Address | Beds | Baths | Sqft | Rent | $/sqft | DOM | Units | Dist |
|---|---|---|---|---|---|---|---|---|
| 2804 Christopher Ave Baltimore, MD | 3.0 | 2.5 | 1280 | $2,200 | $1.72 | 24d | 1 | 0.37mi |
| 6612 Birchwood Ave Baltimore, MD | 3.0 | 2.0 | 1122 | $2,300 | $2.05 | 20d | 1 | 0.38mi |
| 3158 Woodring Ave Parkville, MD | 3.0 | 1.5 | 1500 | $1,950 | $1.30 | 24d | 1 | 0.53mi |
| 2518 Moore Ave Parkville, MD | 4.0 | 1.5 | 1896 | $2,700 | $1.42 | 44d | 1 | 0.56mi |
| 2518 Linwood Rd Parkville, MD | 3.0 | 1.5 | 1946 | $2,200 | $1.13 | 17d | 1 | 0.69mi |
| 3412 Fleetwood Ave Baltimore, MD | 3.0 | 2.5 | 1620 | $2,195 | $1.35 | 44d | 1 | 0.72mi |
| 3108 Glendale Ave Parkville, MD | 3.0 | 3.0 | 1224 | $2,550 | $2.08 | 24d | 1 | 0.78mi |
| 2805 Hamilton Ave Baltimore, MD | 4.0 | 2.0 | 1416 | $2,300 | $1.62 | 44d | 1 | 0.78mi |
| 2912 Hillcrest Ave Parkville, MD | 5.0 | 2.0 | 1648 | $2,900 | $1.76 | 44d | 1 | 0.83mi |
| 2106 Cloville Ave Baltimore, MD | 3.0 | 1.5 | 1080 | $1,700 | $1.57 | 44d | 1 | 0.88mi |
| 7202 Sindall Rd Unit 7202 Parkville, MD | 3.0 | 1.0 | 1350 | $1,850 | $1.37 | 44d | 1 | 1.03mi |
| 1629 Wentworth Ave Parkville, MD | 3.0 | 1.5 | 1152 | $1,895 | $1.64 | 44d | 1 | 1.09mi |
| 3510 Hamilton Ave Baltimore, MD | 3.0 | 2.5 | 2100 | $2,300 | $1.10 | 24d | 1 | 1.09mi |
| 5781 Edgepark Rd Baltimore, MD | 3.0 | 2.0 | 1568 | $1,975 | $1.26 | 17d | 1 | 1.16mi |
| 2900 Ailsa Ave Apt 2 Baltimore, MD | 3.0 | 1.0 | 1300 | $1,750 | $1.35 | 5d | 1 | 1.23mi |
| 6504 Rosemont Ave Baltimore, MD | 5.0 | 3.0 | 2098 | $2,900 | $1.38 | 44d | 1 | 1.25mi |
| 7839 Birmingham Ave Parkville, MD | 3.0 | 1.0 | 1136 | $1,775 | $1.56 | 44d | 1 | 1.25mi |
| 2807 Shirey Ave Baltimore, MD | 4.0 | 3.0 | 1190 | $2,500 | $2.10 | 15d | 1 | 1.31mi |
| 2911 Shirey Ave Baltimore, MD | 4.0 | 2.0 | 1680 | $2,500 | $1.49 | 21d | 1 | 1.31mi |
| 1376 Halstead Rd Parkville, MD | 3.0 | 1.0 | 1440 | $2,400 | $1.67 | 24d | 1 | 1.34mi |
| 3721 Frankford Ave Baltimore, MD | 3.0 | 2.0 | 1600 | $2,050 | $1.28 | 44d | 1 | 1.37mi |
| 4111 Century Rd Baltimore, MD | 3.0 | 1.5 | 1432 | $2,500 | $1.75 | 44d | 1 | 1.37mi |
| 1908 E Belvedere Ave Baltimore, MD | 4.0 | 2.0 | 1425 | $1,950 | $1.37 | 20d | 1 | 1.38mi |
| 1646 Wadsworth Way Baltimore, MD | 3.0 | 1.0 | 1520 | $2,100 | $1.38 | 11d | 1 | 1.39mi |
| 3514 Ailsa Ave Baltimore, MD | 3.0 | 2.0 | 1800 | $2,200 | $1.22 | 44d | 1 | 1.42mi |
| 1127 Deanwood Rd Parkville, MD | 3.0 | 2.0 | 1730 | $2,350 | $1.36 | 44d | 1 | 1.42mi |
| 2028 Hillenwood Rd Baltimore, MD | 4.0 | 2.0 | 1820 | $2,100 | $1.15 | 22d | 1 | 1.44mi |
| 1726 E Belvedere Ave Baltimore, MD | 3.0 | 2.0 | 1140 | $1,895 | $1.66 | 22d | 1 | 1.45mi |
Listing history 50 events
-
2026-06-17status $230,000 Pending 48 DOM
-
2026-06-16days on market $230,000 Active 48 DOM
-
2026-06-15days on market $230,000 Active 47 DOM
-
2026-06-13days on market $230,000 Active 45 DOM
-
2026-06-09days on market $230,000 Active 41 DOM
-
2026-06-08days on market $230,000 Active 40 DOM
-
2026-06-07days on market $230,000 Active 39 DOM
-
2026-06-04pricedays on market $230,000 Active 36 DOM
-
2026-06-03days on market $235,000 Active 35 DOM
-
2026-06-02days on market $235,000 Active 34 DOM
-
2026-06-01days on market $235,000 Active 33 DOM
-
2026-05-31days on market $235,000 Active 32 DOM
-
2026-04-29$245,000 Active 1140-char remark
-
2022-01-12soldstatus $186,250
-
2021-12-07soldstatus $186,250 Closed 345-char remark
Show marketing remark (345 chars)
SPACIOUS 4 BED & A DEN IN A QUIET HOMEOWNER NEIGHBORHOOD. NEW ROOF IN 2020, NEW FURNACE AND RADIATORS. FEW YR. OLD HOTWATER UNIT & APPLIANCES. CLOSE TO TRANSPORTATION, SHOPPING & STATE MORGON UNIVERSITY. HARDWOOD FLOORS THROUGH OUT 1ST AND 2ND FLOOR. Must see. Owner not aware of any possible Ground rent, buyer needs to check.
-
2021-11-15status Pending 345-char remark
Show marketing remark (345 chars)
SPACIOUS 4 BED & A DEN IN A QUIET HOMEOWNER NEIGHBORHOOD. NEW ROOF IN 2020, NEW FURNACE AND RADIATORS. FEW YR. OLD HOTWATER UNIT & APPLIANCES. CLOSE TO TRANSPORTATION, SHOPPING & STATE MORGON UNIVERSITY. HARDWOOD FLOORS THROUGH OUT 1ST AND 2ND FLOOR. Must see. Owner not aware of any possible Ground rent, buyer needs to check.
-
2021-10-24price $194,900 345-char remark
Show marketing remark (345 chars)
SPACIOUS 4 BED & A DEN IN A QUIET HOMEOWNER NEIGHBORHOOD. NEW ROOF IN 2020, NEW FURNACE AND RADIATORS. FEW YR. OLD HOTWATER UNIT & APPLIANCES. CLOSE TO TRANSPORTATION, SHOPPING & STATE MORGON UNIVERSITY. HARDWOOD FLOORS THROUGH OUT 1ST AND 2ND FLOOR. Must see. Owner not aware of any possible Ground rent, buyer needs to check.
-
2021-09-08status Active 345-char remark
Show marketing remark (345 chars)
SPACIOUS 4 BED & A DEN IN A QUIET HOMEOWNER NEIGHBORHOOD. NEW ROOF IN 2020, NEW FURNACE AND RADIATORS. FEW YR. OLD HOTWATER UNIT & APPLIANCES. CLOSE TO TRANSPORTATION, SHOPPING & STATE MORGON UNIVERSITY. HARDWOOD FLOORS THROUGH OUT 1ST AND 2ND FLOOR. Must see. Owner not aware of any possible Ground rent, buyer needs to check.
-
2021-08-09historical Active Under Contract 345-char remark
Show marketing remark (345 chars)
SPACIOUS 4 BED & A DEN IN A QUIET HOMEOWNER NEIGHBORHOOD. NEW ROOF IN 2020, NEW FURNACE AND RADIATORS. FEW YR. OLD HOTWATER UNIT & APPLIANCES. CLOSE TO TRANSPORTATION, SHOPPING & STATE MORGON UNIVERSITY. HARDWOOD FLOORS THROUGH OUT 1ST AND 2ND FLOOR. Must see. Owner not aware of any possible Ground rent, buyer needs to check.
-
2021-07-28price $199,900 345-char remark
Show marketing remark (345 chars)
SPACIOUS 4 BED & A DEN IN A QUIET HOMEOWNER NEIGHBORHOOD. NEW ROOF IN 2020, NEW FURNACE AND RADIATORS. FEW YR. OLD HOTWATER UNIT & APPLIANCES. CLOSE TO TRANSPORTATION, SHOPPING & STATE MORGON UNIVERSITY. HARDWOOD FLOORS THROUGH OUT 1ST AND 2ND FLOOR. Must see. Owner not aware of any possible Ground rent, buyer needs to check.
-
2021-07-28status Active 345-char remark
Show marketing remark (345 chars)
SPACIOUS 4 BED & A DEN IN A QUIET HOMEOWNER NEIGHBORHOOD. NEW ROOF IN 2020, NEW FURNACE AND RADIATORS. FEW YR. OLD HOTWATER UNIT & APPLIANCES. CLOSE TO TRANSPORTATION, SHOPPING & STATE MORGON UNIVERSITY. HARDWOOD FLOORS THROUGH OUT 1ST AND 2ND FLOOR. Must see. Owner not aware of any possible Ground rent, buyer needs to check.
-
2021-06-06historical Active Under Contract 345-char remark
Show marketing remark (345 chars)
SPACIOUS 4 BED & A DEN IN A QUIET HOMEOWNER NEIGHBORHOOD. NEW ROOF IN 2020, NEW FURNACE AND RADIATORS. FEW YR. OLD HOTWATER UNIT & APPLIANCES. CLOSE TO TRANSPORTATION, SHOPPING & STATE MORGON UNIVERSITY. HARDWOOD FLOORS THROUGH OUT 1ST AND 2ND FLOOR. Must see. Owner not aware of any possible Ground rent, buyer needs to check.
-
2021-05-29$185,000 Active 345-char remark
Show marketing remark (345 chars)
SPACIOUS 4 BED & A DEN IN A QUIET HOMEOWNER NEIGHBORHOOD. NEW ROOF IN 2020, NEW FURNACE AND RADIATORS. FEW YR. OLD HOTWATER UNIT & APPLIANCES. CLOSE TO TRANSPORTATION, SHOPPING & STATE MORGON UNIVERSITY. HARDWOOD FLOORS THROUGH OUT 1ST AND 2ND FLOOR. Must see. Owner not aware of any possible Ground rent, buyer needs to check.
-
2020-09-04historical
-
2020-07-20price $174,900
-
2020-07-17$159,900 Active
-
2015-01-12historical
-
2015-01-12historical
-
2014-11-01price
-
2014-10-21Active
-
2014-10-21$139,000
-
2012-08-06historical Withdrawn
-
2012-08-06historical
-
2012-05-16Active
-
2012-05-16$164,900
-
2011-06-15soldstatus $38,000
-
2011-06-15soldstatus $38,000 Sold
-
2011-05-19status Contract
-
2011-05-19historical
-
2011-04-30status Active
-
2011-04-13status Contingent (No Kick Out)
-
2011-03-15price $49,900
-
2011-02-26price $59,900
-
2011-01-12$69,900 Active
-
2011-01-11$49,900
-
2006-08-25soldstatus $152,000
-
2006-07-10soldstatus $152,000
-
2006-06-10historical
-
2006-06-02$144,900
-
2003-09-30soldstatus $59,400
ⓘ Source: listings_history table (triggers on properties + properties_extension) + one-shot
backfill from property_details.listing_events for pre-trigger history.
Tax reassessment forecast MD · Partial reset (capped growth)
- Current annual tax
- $2,968 · $247/mo
- Projected year-2 tax
- $2,968 · $247/mo
- Expected delta
- $0/yr ($0/mo · 0.0%)
ⓘ Screening estimate from a state-policy table — verify with the county assessor before closing.
Climate risk First Street
- Flood 1/10 Low FEMA zone X (unshaded) · 0% chance over 30 yrs
- Wildfire 1/10 Low
- Heat 7/10 Severe 7 d/yr ≥104°F today · 15 d/yr by 30 yrs out
- Wind 6/10 Major 27% chance of damaging wind over 30 yrs
- Air quality 4/10 Moderate 3 unhealthy d/yr today · 6 by 30 yrs out
Nearby sold comps map
Loading sold comps map…
Walkable amenities ~0.75 mi
Loading nearby amenities…
Taxation est. · year 1
- Rental income
- $27,395
- − Mortgage interest
- −$12,884
- − Property taxes
- −$2,968
- − Insurance
- −$1,150
- − Repairs & maintenance
- −$2,192
- − Management
- −$2,192
- − Depreciation
- −$6,691
- Taxable loss
- −$681
- Est. tax savings @ 24.0%
- +$164
- After-tax cash flow
- $3,213/yr
For passive investors: Depreciation is non-cash, so a rental often shows a tax loss while cash-flowing — sheltering income. Rental losses are passive: they offset passive income freely, and up to $25,000/yr can offset ordinary (W-2) income if you actively participate and your MAGI is under $100k (phasing out to $0 by $150k); unused losses carry forward. On sale, claimed depreciation is recaptured at up to 25%, and gains may owe capital-gains tax (a 1031 exchange can defer both). Figures are a year-1 estimate at your 24.0% rate — not tax advice; consult a CPA.
Schools (NCES district)
- District
- Baltimore City Public Schools
- NCES district ID
- 2400090
- Math proficiency
- 7% ▼ -9.00%
- Reading proficiency
- 16% ▼ -5.00%
- Median HH income
- $42,108
- Composite
- 10.08/100
- National rank
- #9805
- State rank
- #24 of 24 in MD
Livability — Baltimore
- Score
- 76/100
- State rank
- #90
- US rank
- #3396
Category grades
Schools grade is shown separately in the Schools card above.
Census & demographics
- Census place
- Baltimore, MD
- County
- Baltimore City · 558,601 people
- City population
- 588,727
- Metro
- Baltimore-Columbia-Towson, MD
- Population (ZIP)
- 21,092
- Household income
- $86,366
- Rent vs Own
- Severe rent burden
- 432.0
Population outlook (Baltimore County) Hauer SSP2
- Today (2025)
- 624,249 people
- By 2030
- 621,541 · -0.4%
- By 2040
- 609,756 · -2.3%
- By 2050
- 597,249 · -4.3%
- By 2075
- 552,236 · -11.5%
- By 2100
- 513,934 · -17.7%
Race, ethnicity, and origin ACS 2023
- Neighborhood character
- Diverse neighborhood (Simpson 0.56)
- Race & ethnicity
- Black 58% White 33% Two or more races 6% Hispanic / Latino 3%
- Common ancestry
- Romanian 3% Italian 1% Lithuanian 1%
- Foreign-born
- 7% · Canada
- Languages at home
- 93% English-only · Spanish 3% French/Haitian/Cajun 1%
Political lean MEDSL · Baltimore
- 2024 margin
- Solid D (+73.0) · D 85.2% · R 12.2% · Other 2.6%
- 2008→2024 swing
- -2.5pp toward R · 2008: 75.5pp · 2024: 73.0pp
- All cycles
- 2024: D+73.0 2020: D+76.6 2016: D+74.6 2012: D+76.4 2008: D+75.5
Not yet ingested
- Civics
- —
Market trends
- HPI YoY
- ▼ -211.52%
- Current HPI
- 310.5637
- Rent YoY
- —
- Metro
- Baltimore-Columbia-Towson, MD
- State GDP YoY
- ▲ 2.97%
- F500 in state
- 12
Industry mix (Fortune 500 HQ in MD)
| Industry | F500 HQs | Revenue |
|---|---|---|
| Aerospace / Defense | 1 | $71B |
|
||
| Utilities | 1 | $25B |
|
||
| Hotels | 1 | $24B |
|
||
| Consumer Goods | 1 | $7B |
|
||
| Real Estate | 1 | $6B |
|
||
| Chemicals | 1 | $2B |
|
||
Price history
+334.0% since first listed56 events — show timeline
- 2026-06-16 Pending — BRIGHT MLS
- 2026-06-16 Listing Removed — BRIGHT MLS
- 2026-06-03 Price Changed $230,000 BRIGHT MLS
- 2026-05-20 Price Changed $235,000 BRIGHT MLS
- 2026-04-29 Listed $245,000 BRIGHT MLS
- 2022-01-12 Sold (Public Records) $186,250 Public Records
- 2021-12-07 Sold (MLS) $186,250 BRIGHT MLS
- 2021-11-15 Pending — BRIGHT MLS
- 2021-10-24 Price Changed $194,900 BRIGHT MLS
- 2021-09-08 Relisted — BRIGHT MLS
- 2021-08-09 Contingent — BRIGHT MLS
- 2021-07-28 Price Changed $199,900 BRIGHT MLS
- 2021-07-28 Relisted — BRIGHT MLS
- 2021-06-06 Contingent — BRIGHT MLS
- 2021-05-29 Listed $185,000 BRIGHT MLS
- 2020-09-04 Listing Removed — BRIGHT MLS
- 2020-07-20 Price Changed $174,900 BRIGHT MLS
- 2020-07-17 Listed $159,900 BRIGHT MLS
- 2015-01-12 Delisted — MRIS
- 2015-01-12 Listing Removed — BRIGHT MLS
- 2014-11-01 Price Changed — MRIS
- 2014-10-21 Listed — MRIS
- 2014-10-21 Listed $139,000 BRIGHT MLS
- 2012-08-06 Delisted — MRIS
- 2012-08-06 Listing Removed — BRIGHT MLS
- 2012-05-16 Listed — MRIS
- 2012-05-16 Listed $164,900 BRIGHT MLS
- 2011-06-15 Sold (MLS) $38,000 BRIGHT MLS
- 2011-06-15 Sold (MLS) $38,000 MRIS
- 2011-05-19 Pending — MRIS
- 2011-05-19 Listing Removed — BRIGHT MLS
- 2011-04-30 Relisted — MRIS
- 2011-04-13 Pending — MRIS
- 2011-03-15 Price Changed $49,900 MRIS
- 2011-02-26 Price Changed $59,900 MRIS
- 2011-01-12 Listed $69,900 MRIS
- 2011-01-11 Listed $49,900 BRIGHT MLS
- 2006-08-25 Sold (Public Records) $152,000 Public Records
- 2006-07-10 Sold (MLS) $152,000 MRIS
- 2006-06-10 Delisted — MRIS
- 2006-06-02 Listed $144,900 MRIS
- 2003-09-30 Sold (MLS) $59,400 MRIS
- 2003-09-23 Sold (Public Records) $59,400 Public Records
- 2003-07-08 Delisted — MRIS
- 2003-06-24 Listed $58,000 MRIS
- 2002-09-26 Delisted — MRIS
- 2002-09-11 Listed — MRIS
- 2002-02-01 Delisted — MRIS
- 2001-08-19 Listed — MRIS
- 1999-07-31 Delisted — MRIS
- 1999-04-27 Listed — MRIS
- 1999-04-23 Delisted — MRIS
- 1999-02-02 Listed — MRIS
- 1997-12-30 Delisted — MRIS
- 1997-01-25 Listed — MRIS
- 1986-11-07 Sold (Public Records) $53,000 Public Records
Property tax history
-1.1%/yrLatest (2025): $2,968 · +0.8% YoY. Source: county tax records.
Cash-flow waterfall
monthlySold comps — $/sqft
last 12 mo · ≤1 miLoading sold comps…