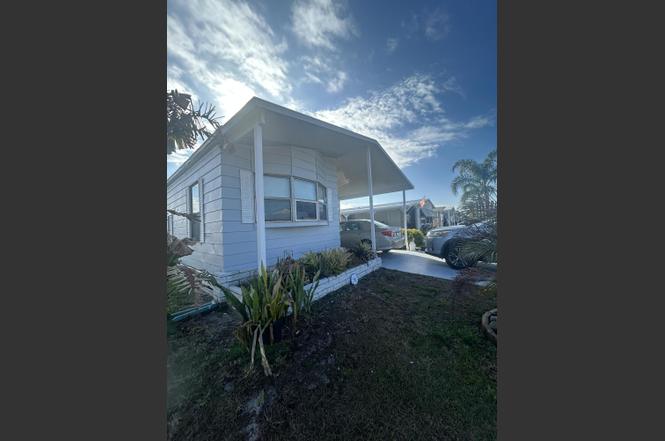
41 Verde Vis · Lakewood Park, FL
Flood risk 3/10 · Minor
- FEMA flood zone
- X (unshaded)
- Chance of flooding over 30 yrs
- 0.2%
- Est. flood insurance / yr
- $507 – $1,088
Fire risk 4/10 · Minor
- Est. fire insurance / yr
- $947 – $1,759
Heat risk 10/10 · Severe
- Hot days now (above 107°F)
- 7 days/yr
- Hot days in 30 yrs
- 25 days/yr
Wind risk 10/10 · Severe
- Chance of severe wind over 30 yrs
- 99.0%
Air-quality risk 1/10 · Minimal
- Unhealthy air days now
- 0 days/yr
- Unhealthy air days in 30 yrs
- 0 days/yr
Risk factors via First Street. Map © Google.
Why this score? — see what drove the D grade
The composite is a weighted blend of 9 inputs, each scored 0–100. Each bar is that input's sub-score; the figure is the points it added to the 100-point composite (weight × sub-score).
- Cash flow +15.0/30.0
- ARV discount +5.6/15.0
- 1% rule +5.0/10.0
- DSCR +5.0/10.0
- Schools +3.7/10.0
- Livability +3.2/5.0
- Rent growth +2.5/5.0
- Condition / age +2.5/5.0
- Appreciation +0.0/10.0
$39,000
🖨 Deal sheet 📄 Offer letter ✓ Due diligence
Listing remarks
This manufactured home is in a 55 plus community, it's located in Spanish Lakes Country Club, it has New Appliances New Flooring Throughout House, Freshly Painted Inside & Outside, Fully Furnished, New Roof, new carpet, air condition is only two years old duck work newly done, screened in patio. and much more, buyers have to be park approved
Key facts
- New flooring
- Freshly painted
- New appliances
Tags
Property features AI
Finance
- HOA & community: Senior community; Pets allowed (breed restrictions and possible pet restrictions)
Exterior
- Parking: Carport (1 covered space)
- Utilities: Public water; Cable available; Water available
- Home design: Manufactured home; Modular construction; Single-story; Faces east; Resale condition
- Construction: Modular construction
- Exterior features: Not waterfront
Interior
- Kitchen: Refrigerator
- Bedrooms: 2 bedrooms on the main level
- Flooring: Carpet; Wood
- Bathrooms: 2 full bathrooms on the main level
- Heating & cooling: Central heating; Central air conditioning
- Interior features: Built-in features; Furnished
- Laundry & utility: Laundry in garage
Neighborhood map
What this means for you Summary
Snapshot
- This is a 2-bed/2.0-bath manufactured listed at $39k.
Deal economics
- At list price, monthly cash flow is $1k ($17k/yr) — positive.
- The deal already cash-flows at list — no discount required.
- Meets the 1% rule at list price ($2k rent vs $39k).
- Recommended offer: $35k (9.0% below list) — sets the bar for market timing.
- Cap rate 49.7% vs local median 5.7% in Lakewood Park — top-decile yield for the area; either an underpriced asset or a hidden risk that comps aren't pricing in. Stress-test before assuming the spread holds.
Location & tenants
- Location reads 63/100 on livability (#719 in FL) — a middle-class / working-renter tenant base. Strengths: cost of living A+, housing A+; Watch: amenities F, commute F, health & safety D-.
- St. Lucie (urban): math 40% / reading 48% proficiency, ranked #51 of 73 in FL (top 70%) — families likely to look elsewhere, expect single-tenant / working-renter base with shorter leases.
- Zoned schools: Weatherbee Elementary School (math 32% / reading 32%, grade F, #1,797 of 2,144 statewide, top 86%, 672 students, 90% FRL); Dan Mccarty Middle School (math 23% / reading 23%, grade F, #542 of 571 statewide, top 95%, 747 students, 88% FRL); Fort Pierce Westwood Academy The W.E.S.T. Prep Magnet (math 16% / reading 36%, grade F, #494 of 667 statewide, top 75%, 2,010 students, 75% FRL) — zoned schools average 85% FRL vs 59% district-wide (26 pts higher); higher-poverty schools than district average — tighter screening recommended.
- Zoned-school proficiency averages 27% at this address vs 44% district-wide (-17 pts) — the specific schools serving this property underperform the St. Lucie average; the district grade overstates school quality for this exact location.
- Market conditions: 292 active listings in the ZIP; 10 comparable units currently listed for rent nearby; rentals at typical pace (median 21d on market — plan ~3-4 weeks tenant-placement turnaround); 4,868 units permitted in St. Lucie County in 2024 (268 in 5+ unit buildings).
- This rent runs 40% of the median local income ($63k/yr) — at the standard rent-burdened threshold; future hikes will face affordability resistance.
Forward outlook
- Local home prices are declining (-3.0%/yr); year-one equity from $270 of loan paydown is wiped out by about $1k of value loss. Plan a longer hold.
- St. Lucie County population projected at +20% by 2050 — long-run rental-demand tailwind backs the buy-and-hold thesis.
- At projected returns (-3.0% appreciation + 3.0% rent growth), your $11k cash investment doubles in ~1 year — after that, you're playing with house money.
Negotiation context
- It's been on market 107 days — a 9% lower offer ($35k) is reasonable based on typical stale-listing flexibility.
Risks & watch-outs
- Climate carrying-cost: severe wind risk, 99% chance of damaging wind over 30y; extreme-heat days projected 7→25/yr by 2055 (HVAC capex compounding) — expect insurance premiums to compound above CPI over the hold.
Questions for the listing agent
- It's been on market 107 days. Have you received any prior offers? Is the seller open to a 9% concession, seller financing, or rate buy-down credit?
- Why hasn't it sold? Are there any deal-killer items the seller is aware of (foundation, flood, title, zoning, code violations)?
- Is there a deadline driving the sale (1031 exchange, divorce, estate, relocation)? That informs how much negotiation room exists.
- Schools are F-rated, which usually means shorter tenancies and higher turnover. Who's the typical renter profile here, and what's been the actual vacancy rate?
- The area grade is low — what's the realistic commute time and amenity access for the typical tenant pool here? Any planned neighborhood developments (good or bad) we should know about?
- What's the average days-on-market for RENTAL listings here right now (not sales)? A rising rental-DOM trend means longer vacancies and softer asking-rent achievability than the comps imply.
- What's the recent tenant-quality profile in this submarket — average credit score on applications, eviction rate, late-payment / NSF rate, and stable-employment percentage? A property-management company in the area should have these aggregated.
- How much new for-sale + rental construction is in the pipeline within 1–3 miles? Heavy new supply typically softens prices + rents 12–24 months out; constrained supply supports both.
Investment metrics
- 1% rule
- 5.45% ✓
- Cap rate
- 49.68%
- Cash-on-cash
- 154.95%
- DSCR
- 7.89
- GRM
- 1.5
CMA / ARV
- ARV (on-the-fly)
- $37,440
- Comps found
- 8
Show comp detail 8 sales within ~0.75 mi
| Address | Dist | Beds/Ba | Sqft | Sold | Price | $/sf | Match |
|---|---|---|---|---|---|---|---|
| 2 Villa Maria | 0.17mi | 2/2.0 | 1,164 (-7%) | 16mo | $24,695 | $21 | 67 |
| 65 Las Casitas Ct | 0.31mi | 2/2.0 | 1,316 (+5%) | 15mo | $50,000 | $38 | 63 |
| 58 Calle De Lagos | 0.47mi | 2/2.0 | 1,416 (+14%) | 5mo | $55,000 | $39 | 51 |
| 8 Grande Camino Pl | 0.60mi | 2/2.0 | 1,400 (+12%) | 2mo | $31,750 | $23 | 50 |
| 5 Grande Camino Pl | 0.58mi | 2/2.0 | 1,200 (-4%) | 20mo | $50,495 | $42 | 50 |
| 38 Montoya | 0.26mi | 2/2.0 | 1,416 (+14%) | 22mo | $19,995 | $14 | 47 |
| 45 Ecuador Way | 0.40mi | 2/2.0 | 1,400 (+12%) | 20mo | $42,000 | $30 | 44 |
| 70 Lagos Del Norte | 0.63mi | 2/2.0 | 1,400 (+12%) | 14mo | $32,600 | $23 | 38 |
Match score weights: distance 35% · size 25% · config 20% · recency 20%. Top-matched comps best support the ARV.
Projected returns pro-forma
-3.0% appreciation · 3.0% rent growth · sell at horizon
- IRR
- —
- Equity multiple
- 8.65×
- Total profit
- $83,516
- Equity at exit
- $5,815
- IRR
- —
- Equity multiple
- 18.26×
- Total profit
- $188,492
- Equity at exit
- $3,372
Cash invested: $10,920 (down + closing). Projections, not guarantees.
Landlord ↔ Tenant lean methodology
- Overall (STATE)
- 87 Strongly Landlord-Friendly
- State Florida
- 87 Strongly Landlord-Friendly · R+3
- County
- — inherits STATE
- City
- — inherits STATE
ZIP-level market 34951
- Home prices YoY
- -23.6%
- Active inventory
- 292
- Price-to-rent
- 1.5×
Monthly cashflow live
- Estimated rent
- $2,126 high interval (Pro) →
- Mortgage (P&I)
- −$205
- Tax est. 1.5%
- −$49 /mo · $585/yr
- Insurance
- −$16
- HOA
- −$0
- Vacancy / Maint / Mgmt
- −$446
- Net cashflow
- $1,410
Break-even live
UW: 25.0% down · 7.5% · 30yr · 1.5% tax · 5.0% vac · 8.0% maint · 8.0% mgmt
Financing live
Cash to close
- Down payment
- $9,750
- Closing costs
- $1,170
- Reserves months
- —
- Total cash needed
- —
Loan-product check · same deal, 3 products live
Conventional
25% down · 7.5% · 30yr
- Down + closing
- —
- Monthly P&I
- —
- Monthly cashflow
- —
- DSCR
- —
- Eligible?
- —
Personal DTI + credit; lowest rate.
DSCR
20% down · 8.5% · 30yr
- Down + closing
- —
- Monthly P&I
- —
- Monthly cashflow
- —
- DSCR
- —
- Eligible?
- —
No personal income docs; deal must DSCR.
Hard money
10% down · 12.0% · 12mo
- Down + closing
- —
- Monthly P&I
- —
- Monthly cashflow
- —
- DSCR
- —
- Eligible?
- —
Short-term bridge; refi at stabilization.
Rent comps 10 comps
| Address | Beds | Baths | Sqft | Rent | $/sqft | DOM | Units | Dist |
|---|---|---|---|---|---|---|---|---|
| 5642 Sunberry Cir Fort Pierce, FL | 3.0 | 2.0 | 1377 | $1,950 | $1.42 | 23d | 1 | 0.48mi |
| 6906 Ocala Ave Fort Pierce, FL | 3.0 | 2.0 | 1175 | $1,955 | $1.66 | 13d | 1 | 0.49mi |
| 7403 Winter Garden Pkwy Fort Pierce, FL | 3.0 | 2.0 | 1372 | $2,200 | $1.60 | 21d | 1 | 0.82mi |
| 7500 Pensacola Rd Fort Pierce, FL | 3.0 | 2.0 | 1125 | $2,150 | $1.91 | 13d | 1 | 0.82mi |
| 2450 8th Ave SW Vero Beach, FL | 3.0 | 2.0 | 1388 | $2,100 | $1.51 | 20d | 1 | 0.90mi |
| 7503 Paso Robles Blvd Fort Pierce, FL | 3.0 | 2.0 | 1260 | $2,000 | $1.59 | 23d | 1 | 0.95mi |
| 985 23rd Pl SW Vero Beach, FL | 3.0 | 2.0 | 1176 | $2,200 | $1.87 | 20d | 1 | 1.07mi |
| 6602 Palomar Pkwy Unit A Fort Pierce, FL | 3.0 | 1.0 | 1200 | $2,000 | $1.67 | 23d | 1 | 1.34mi |
| 5234 Oakland Lake Cir Fort Pierce, FL | 3.0 | 2.0 | 1460 | $2,300 | $1.58 | 13d | 1 | 1.38mi |
| 3766 Harborside Ave Fort Pierce, FL | 2.0 | 2.0 | 1308 | $2,160 | $1.65 | 13d | 1 | 1.47mi |
Listing history 19 events
-
2026-06-18days on market $39,000 Active 107 DOM
-
2026-06-17days on market $39,000 Active 106 DOM
-
2026-06-16days on market $39,000 Active 105 DOM
-
2026-06-15days on market $39,000 Active 104 DOM
-
2026-06-14days on market $39,000 Active 102 DOM
-
2026-06-13days on market $39,000 Active 101 DOM
-
2026-06-10days on market $39,000 Active 99 DOM
-
2026-06-09days on market $39,000 Active 98 DOM
-
2026-06-08days on market $39,000 Active 97 DOM
-
2026-06-07days on market $39,000 Active 96 DOM
-
2026-06-05days on market $39,000 Active 93 DOM
-
2026-06-03days on market $39,000 Active 92 DOM
-
2026-06-02days on market $39,000 Active 91 DOM
-
2026-06-01days on market $39,000 Active 90 DOM
-
2026-05-31days on market $39,000 Active 89 DOM
-
2026-05-30days on market $39,000 Active 88 DOM
-
2026-05-12price $41,459
-
2026-04-27price $41,500
-
2026-03-03$42,000 Active
ⓘ Source: listings_history table (triggers on properties + properties_extension) + one-shot
backfill from property_details.listing_events for pre-trigger history.
Climate risk First Street
- Flood 3/10 Moderate FEMA zone X (unshaded) · 20% chance over 30 yrs
- Wildfire 4/10 Moderate
- Heat 10/10 Extreme 7 d/yr ≥107°F today · 25 d/yr by 30 yrs out
- Wind 10/10 Extreme 99% chance of damaging wind over 30 yrs
- Air quality 1/10 Low 0 unhealthy d/yr today · 0 by 30 yrs out
Nearby sold comps map
Loading sold comps map…
Walkable amenities ~0.75 mi
Loading nearby amenities…
Taxation est. · year 1
- Rental income
- $25,512
- − Mortgage interest
- −$2,185
- − Property taxes
- −$585
- − Insurance
- −$195
- − Repairs & maintenance
- −$2,041
- − Management
- −$2,041
- − Depreciation
- −$1,135
- Taxable income
- $17,331
- Est. tax owed @ 24.0%
- −$4,159
- After-tax cash flow
- $12,761/yr
For passive investors: Depreciation is non-cash, so a rental often shows a tax loss while cash-flowing — sheltering income. Rental losses are passive: they offset passive income freely, and up to $25,000/yr can offset ordinary (W-2) income if you actively participate and your MAGI is under $100k (phasing out to $0 by $150k); unused losses carry forward. On sale, claimed depreciation is recaptured at up to 25%, and gains may owe capital-gains tax (a 1031 exchange can defer both). Figures are a year-1 estimate at your 24.0% rate — not tax advice; consult a CPA.
Schools (NCES district)
- District
- St. Lucie
- NCES district ID
- 1201770
- Math proficiency
- 40% ▼ -11.00%
- Reading proficiency
- 48% ▼ -4.00%
- Median HH income
- $44,737
- Composite
- 37.28/100
- National rank
- #4449
- State rank
- #51 of 73 in FL
Livability — Lakewood Park
- Score
- 63/100
- State rank
- #719
- US rank
- #15407
Category grades
Schools grade is shown separately in the Schools card above.
Census & demographics
- Census place
- Lakewood Park, FL
- County
- Saint Lucie County · 337,150 people
- Metro
- Port St. Lucie, FL
- Population (ZIP)
- 17,148
- Household income
- $63,122
- Rent vs Own
- Severe rent burden
- 140.0
Population outlook (St. Lucie County) Hauer SSP2
- Today (2025)
- 338,016 people
- By 2030
- 355,687 · +5.2%
- By 2040
- 385,521 · +14.1%
- By 2050
- 406,106 · +20.1%
- By 2075
- 441,054 · +30.5%
- By 2100
- 436,885 · +29.2%
Race, ethnicity, and origin ACS 2023
- Neighborhood character
- Predominantly White (74%)
- Race & ethnicity
- White 74% Black 13% Hispanic / Latino 8% Two or more races 7% Asian 2%
- Hispanic origin (detail)
- Mexican 2% Puerto Rican 2% Cuban 2%
- Common ancestry
- Romanian 3% Italian 2% Lithuanian 2%
- Foreign-born
- 10% · Canada, Jamaica, Vietnam
- Languages at home
- 88% English-only · Spanish 7% French/Haitian/Cajun 3% Vietnamese 1%
Political lean MEDSL · St. Lucie
- 2024 margin
- Lean R (+9.1) · D 45.1% · R 54.2%
- 2008→2024 swing
- -21.2pp toward R · 2008: 12.1pp · 2024: -9.1pp
- All cycles
- 2024: R+9.1 2020: R+1.6 2016: R+2.5 2012: D+7.9 2008: D+12.1
Not yet ingested
- Civics
- —
Market trends
- HPI YoY
- ▼ -106.06%
- Current HPI
- 343.1376
- Rent YoY
- —
- Metro
- Port St. Lucie, FL
- State GDP YoY
- ▲ 3.28%
- F500 in state
- 36
Industry mix (Fortune 500 HQ in FL)
| Industry | F500 HQs | Revenue |
|---|---|---|
| Industrial Technology | 2 | $29B |
|
||
| Insurance | 2 | $17B |
|
||
| Retail | 1 | $60B |
|
||
| Technology Distribution | 1 | $58B |
|
||
| Homebuilding | 1 | $35B |
|
||
| Technology Manufacturing | 1 | $35B |
|
||
Price history
-1.3% since first listed3 events — show timeline
- 2026-05-12 Price Changed $41,459 Beaches MLS
- 2026-04-27 Price Changed $41,500 Beaches MLS
- 2026-03-03 Listed $42,000 Beaches MLS
Cash-flow waterfall
monthlySold comps — $/sqft
last 12 mo · ≤1 miLoading sold comps…