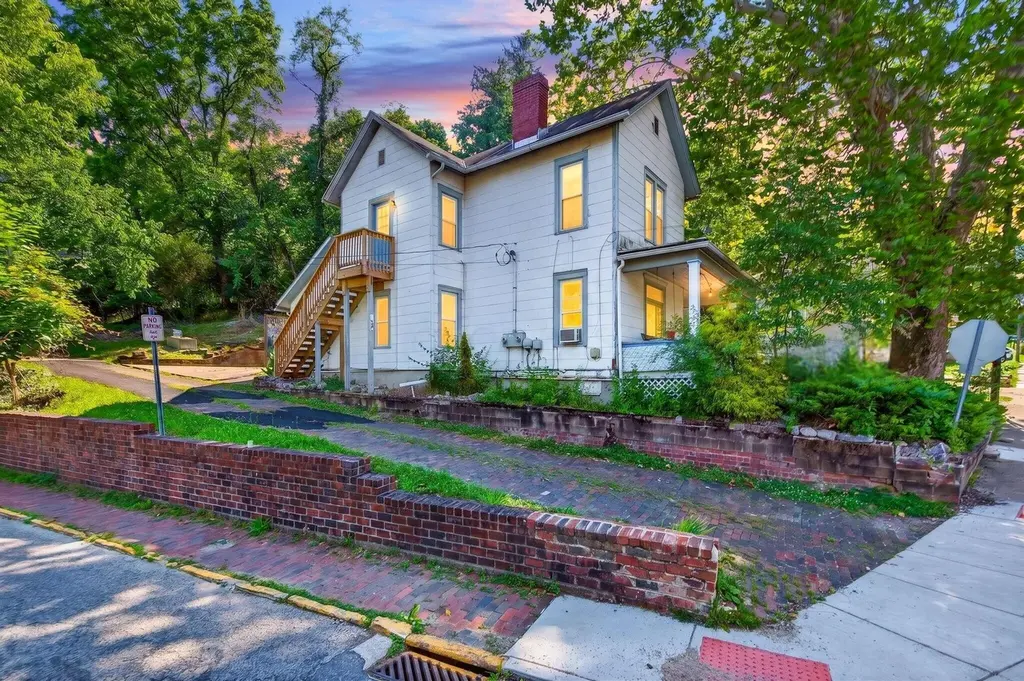
210 W State St · Athens, OH
Flood risk 1/10 · Minimal
- FEMA flood zone
- X (unshaded)
- Chance of flooding over 30 yrs
- 0.0%
- Est. flood insurance / yr
- $473 – $860
Fire risk 3/10 · Minor
- Est. fire insurance / yr
- $713 – $1,323
Heat risk 4/10 · Minor
- Hot days now (above 100°F)
- 7 days/yr
- Hot days in 30 yrs
- 18 days/yr
Wind risk 2/10 · Minimal
- Chance of severe wind over 30 yrs
- 1.0%
Air-quality risk 2/10 · Minimal
- Unhealthy air days now
- 0 days/yr
- Unhealthy air days in 30 yrs
- 1 days/yr
Risk factors via First Street. Map © Google.
Why this score? — see what drove the C- grade
The composite is a weighted blend of 9 inputs, each scored 0–100. Each bar is that input's sub-score; the figure is the points it added to the 100-point composite (weight × sub-score).
- ARV discount +15.0/15.0
- Cash flow +14.3/30.0
- Schools +4.5/10.0
- DSCR +4.4/10.0
- Livability +4.3/5.0
- 1% rule +4.2/10.0
- Rent growth +2.5/5.0
- Condition / age +2.5/5.0
- Appreciation +0.0/10.0
$185,000
🖨 Deal sheet (PDF) 📄 Offer letter ✓ Due diligence
Listing remarks MLS
This multi-unit home is fully rented and ready for a new investor! Walking distance to Ohio University, downtown and much more. Dowstairs unit has 2 bedrooms, living room, bathroom, kitchen, office and large foyer. Upstairs unit has bedroom, kitchen, bathroom and living room. Comes with storage shed and parking for both units. Priced "As Is" and under market value. Cash or conventional only.
Key facts
- 6,534 sq ft lot
- Built 1900
- Listed 8 days
Property features AI
Exterior
- Utilities: Public water; Public sewer
- Home design: Single family residence; Two levels; Built in 1900; No shared/common walls
- Construction: Built in 1900
- Exterior features: Other foundation
Interior
- Bedrooms: Two main-level bedrooms
- Bathrooms: Two full bathrooms
- Heating & cooling: Central air; Window unit(s)
- Interior features: Partial basement; Approximately 1,840 building area
Neighborhood map
What this means for you Summary
Snapshot
- This is a 5-bed/2.0-bath single-family listed at $185k.
Deal economics
- At list price, monthly cash flow is $34 ($412/yr) — positive.
- The deal already cash-flows at list — no discount required.
- To meet the 1% rule (rent ≥ 1% of price), the offer needs to be $171k (7.8% below list).
- Recommended offer: $171k (7.8% below list) — sets the bar for 1% rule.
- Cap rate 6.5% vs local median 2.8% in Athens — top-decile yield for the area; either an underpriced asset or a hidden risk that comps aren't pricing in. Stress-test before assuming the spread holds.
Location & tenants
- Location reads 86/100 on livability (#37 in OH, #350 nationally) — a professional / high-income tenant draw. Strengths: crime A+, amenities A+, commute A+; Watch: housing C-, employment F.
- Athens City (town): math 50% / reading 61% proficiency, ranked #393 of 656 in OH (top 60%) — acceptable for families but not a draw, mixed tenant base, ~2y average lease.
- Zoned schools: Athens Middle School (math 62% / reading 67%, grade A-, #205 of 654 statewide, top 34%, 385 students, 46% FRL); Athens High School (math 52% / reading 72%, grade B-, #202 of 781 statewide, top 29%, 692 students, 40% FRL).
- Market conditions: 112 active listings in the ZIP; 5 units permitted in Athens County in 2024 (0 in 5+ unit buildings).
- This rent runs 39% of the median local income ($53k/yr) — at the standard rent-burdened threshold; future hikes will face affordability resistance.
Forward outlook
- Local home prices are declining (-3.0%/yr); year-one equity from $1k of loan paydown is wiped out by about $6k of value loss. Plan a longer hold.
- Athens County population projected at +4% by 2050 — modest demand growth; plan on rents tracking national, not racing it.
Negotiation context
- Only 8 days on market — expect competitive offers; lowballing is unlikely to land.
- 3 sale attempts since 5y ago with the ask held roughly flat each time — persistent listings suggest the price (not the market) is what's stuck; bring a comps-based counter.
Risks & watch-outs
- Watch-outs: built in 1900 — expect roof / HVAC / electrical / plumbing capex.
Questions for the listing agent
- Built in 1900 — when were the roof, HVAC, electrical panel, plumbing, and water heater last replaced?
- Is there a deadline driving the sale (1031 exchange, divorce, estate, relocation)? That informs how much negotiation room exists.
- Schools are A-rated — typically a magnet for longer-tenancy family renters. What's the average tenant stay here, and is there a school-zone premium baked into asking?
- What's the average days-on-market for RENTAL listings here right now (not sales)? A rising rental-DOM trend means longer vacancies and softer asking-rent achievability than the comps imply.
- What's the recent tenant-quality profile in this submarket — average credit score on applications, eviction rate, late-payment / NSF rate, and stable-employment percentage? A property-management company in the area should have these aggregated.
- How much new for-sale + rental construction is in the pipeline within 1–3 miles? Heavy new supply typically softens prices + rents 12–24 months out; constrained supply supports both.
Investment metrics
- 1% rule
- 0.92% ✗
- Cap rate
- 6.52%
- Cash-on-cash
- 0.80%
- DSCR
- 1.04
- GRM
- 9.0
CMA / ARV
- ARV (on-the-fly)
- $263,120
- Comps found
- 8
Show comp detail 8 sales within ~0.75 mi
| Address | Dist | Beds/Ba | Sqft | Sold | Price | $/sf | Match |
|---|---|---|---|---|---|---|---|
| 29 Hanlin Ave | 0.15mi | 4/2.5 (-1) | 1,911 (+4%) | 8mo | $359,000 | $188 | 72 |
| 115 N Congress St | 0.42mi | 5/2.0 | 1,987 (+8%) | 1mo | $325,000 | $164 | 66 |
| 14 S High St | 0.49mi | 5/2.0 | 1,944 (+6%) | 11mo | $420,000 | $216 | 59 |
| 7 W Hills Dr | 0.19mi | 5/3.0 | 2,040 (+11%) | 13mo | $265,000 | $130 | 58 |
| 39 Brown Ave | 0.12mi | 4/2.5 (-1) | 2,016 (+10%) | 20mo | $288,000 | $143 | 55 |
| 102 N Lancaster St | 0.33mi | 4/1.5 (-1) | 1,912 (+4%) | 21mo | $225,000 | $118 | 54 |
| 6 Church St | 0.66mi | 4/2.0 (-1) | 1,901 (+3%) | 23mo | $250,000 | $132 | 40 |
| 94 Franklin Ave | 0.74mi | 4/2.0 (-1) | 1,664 (-10%) | 9mo | $135,000 | $81 | 37 |
Match score weights: distance 35% · size 25% · config 20% · recency 20%. Top-matched comps best support the ARV.
Projected returns pro-forma
-3.0% appreciation · 3.0% rent growth · sell at horizon
- IRR
- -15.0%
- Equity multiple
- 0.46×
- Total profit
- $-27,743
- Equity at exit
- $27,584
- IRR
- -6.3%
- Equity multiple
- 0.59×
- Total profit
- $-21,149
- Equity at exit
- $15,995
Cash invested: $51,800 (down + closing). Projections, not guarantees.
Landlord ↔ Tenant lean methodology
- Overall (STATE)
- 73 Landlord-Friendly
- State Ohio
- 73 Landlord-Friendly · R+6
- County
- — inherits STATE
- City
- — inherits STATE
ZIP-level market 45701
- Active inventory
- 112
- Price-to-rent
- 9.0×
Monthly cashflow live
- Estimated rent
- $1,707 medium interval (Pro) →
- Mortgage (P&I)
- −$970
- Tax from tax record
- −$267 /mo · $3,200/yr
- Insurance
- −$77
- HOA
- −$0
- Vacancy / Maint / Mgmt
- −$358
- Net cashflow
- $34
Break-even live
Sensitivity live
| Price | -10% $139 | -5% $87 | +0% $34 | +5% $-18 | +10% $-70 |
|---|---|---|---|---|---|
| Rent | -10% $-100 | -5% $-33 | +0% $34 | +5% $102 | +10% $169 |
| Rate | -1.0pp $128 | -0.5pp $81 | base $34 | +0.5pp $-14 | +1.0pp $-62 |
UW: 25.0% down · 7.5% · 30yr · 1.5% tax · 5.0% vac · 8.0% maint · 8.0% mgmt
Financing live
Cash to close
- Down payment
- $46,250
- Closing costs
- $5,550
- Reserves months
- —
- Total cash needed
- —
Loan-product check · same deal, 3 products live
Conventional
25% down · 7.5% · 30yr
- Down + closing
- —
- Monthly P&I
- —
- Monthly cashflow
- —
- DSCR
- —
- Eligible?
- —
Personal DTI + credit; lowest rate.
DSCR
20% down · 8.5% · 30yr
- Down + closing
- —
- Monthly P&I
- —
- Monthly cashflow
- —
- DSCR
- —
- Eligible?
- —
No personal income docs; deal must DSCR.
Hard money
10% down · 12.0% · 12mo
- Down + closing
- —
- Monthly P&I
- —
- Monthly cashflow
- —
- DSCR
- —
- Eligible?
- —
Short-term bridge; refi at stabilization.
Listing history 6 events
-
2026-06-17status $185,000 Pending 8 DOM
-
2026-06-16days on market $185,000 Active 8 DOM
-
2026-06-15days on market $185,000 Active 7 DOM
-
2026-06-14days on market $185,000 Active 5 DOM
-
2026-06-12days on market $185,000 Active 4 DOM
-
2026-06-09$185,000 Active 1 DOM
ⓘ Source: listings_history table (triggers on properties + properties_extension) + one-shot
backfill from property_details.listing_events for pre-trigger history.
Tax reassessment forecast OH · Partial reset (capped growth)
- Current annual tax
- $3,200 · $267/mo
- Projected year-2 tax
- $3,200 · $267/mo
- Expected delta
- $0/yr ($0/mo · 0.0%)
ⓘ Screening estimate from a state-policy table — verify with the county assessor before closing.
Climate risk First Street
- Flood 1/10 Low FEMA zone X (unshaded) · 0% chance over 30 yrs
- Wildfire 3/10 Moderate
- Heat 4/10 Moderate 7 d/yr ≥100°F today · 18 d/yr by 30 yrs out
- Wind 2/10 Low 100% chance of damaging wind over 30 yrs
- Air quality 2/10 Low 0 unhealthy d/yr today · 1 by 30 yrs out
Nearby sold comps map
Loading sold comps map…
Walkable amenities ~0.75 mi
Loading nearby amenities…
Taxation est. · year 1
- Rental income
- $20,479
- − Mortgage interest
- −$10,363
- − Property taxes
- −$3,200
- − Insurance
- −$925
- − Repairs & maintenance
- −$1,638
- − Management
- −$1,638
- − Depreciation
- −$5,382
- Taxable loss
- −$2,667
- Est. tax savings @ 24.0%
- +$640
- After-tax cash flow
- $1,052/yr
For passive investors: Depreciation is non-cash, so a rental often shows a tax loss while cash-flowing — sheltering income. Rental losses are passive: they offset passive income freely, and up to $25,000/yr can offset ordinary (W-2) income if you actively participate and your MAGI is under $100k (phasing out to $0 by $150k); unused losses carry forward. On sale, claimed depreciation is recaptured at up to 25%, and gains may owe capital-gains tax (a 1031 exchange can defer both). Figures are a year-1 estimate at your 24.0% rate — not tax advice; consult a CPA.
Schools (NCES district)
- District
- Athens City
- NCES district ID
- 3904352
- Math proficiency
- 50% ▼ -10.00%
- Reading proficiency
- 61% ▼ -5.00%
- Median HH income
- $30,360
- Composite
- 45.43/100
- National rank
- #2620
- State rank
- #393 of 656 in OH
Livability — Athens
- Score
- 86/100
- State rank
- #37
- US rank
- #350
Category grades
Schools grade is shown separately in the Schools card above.
Census & demographics
- Census place
- Athens, OH
- County
- Athens County · 33,329 people
- City population
- 33,329
- Metro
- Athens, OH
- Population (ZIP)
- 33,329
- Household income
- $53,075
- Rent vs Own
- Severe rent burden
- 2145.0
Population outlook (Athens County) Hauer SSP2
- Today (2025)
- 71,867 people
- By 2030
- 73,556 · +2.4%
- By 2040
- 74,528 · +3.7%
- By 2050
- 74,947 · +4.3%
- By 2075
- 77,996 · +8.5%
- By 2100
- 81,619 · +13.6%
Race, ethnicity, and origin ACS 2023
- Neighborhood character
- Predominantly White (84%)
- Race & ethnicity
- White 84% Two or more races 6% Asian 4% Black 3% Hispanic / Latino 3%
- Common ancestry
- Romanian 4% Slovak 3% Serbian 2%
- Foreign-born
- 6% · China, Canada, Vietnam
- Languages at home
- 91% English-only · Spanish 2% Arabic 1% Chinese 1%
Political lean MEDSL · Athens
- 2024 margin
- D (+10.8) · D 54.9% · R 44.2%
- 2008→2024 swing
- -24.5pp toward R · 2008: 35.3pp · 2024: 10.8pp
- All cycles
- 2024: D+10.8 2020: D+15.0 2016: D+16.9 2012: D+35.0 2008: D+35.3
Not yet ingested
- Civics
- —
Market trends
- HPI YoY
- ▼ -157.24%
- Current HPI
- 181.6919
- Rent YoY
- —
- Metro
- Athens, OH
- State GDP YoY
- ▲ 1.98%
- F500 in state
- 48
Industry mix (Fortune 500 HQ in OH)
| Industry | F500 HQs | Revenue |
|---|---|---|
| Insurance | 3 | $145B |
|
||
| Industrial Machinery | 3 | $49B |
|
||
| Financial Services | 3 | $24B |
|
||
| Consumer Goods | 2 | $93B |
|
||
| Aerospace / Defense | 2 | $47B |
|
||
| Utilities | 2 | $33B |
|
||
Price history
-27.5% since first listed6 events — show timeline
- 2026-06-08 Listed $185,000 SVAR
- 2026-06-08 Listed $185,000 CBRMLS
- 2021-10-26 Sold (Public Records) $166,500 Public Records
- 2021-08-27 Sold (MLS) $166,500 ACBOR
- 2021-05-07 Listed $179,900 ACBOR
- 2013-01-17 Sold (Public Records) $255,000 Public Records
Property tax history
+4.2%/yrLatest (2025): $3,200 · +0.9% YoY. Source: county tax records.
Cash-flow waterfall
monthlySold comps — $/sqft
last 12 mo · ≤1 miLoading sold comps…