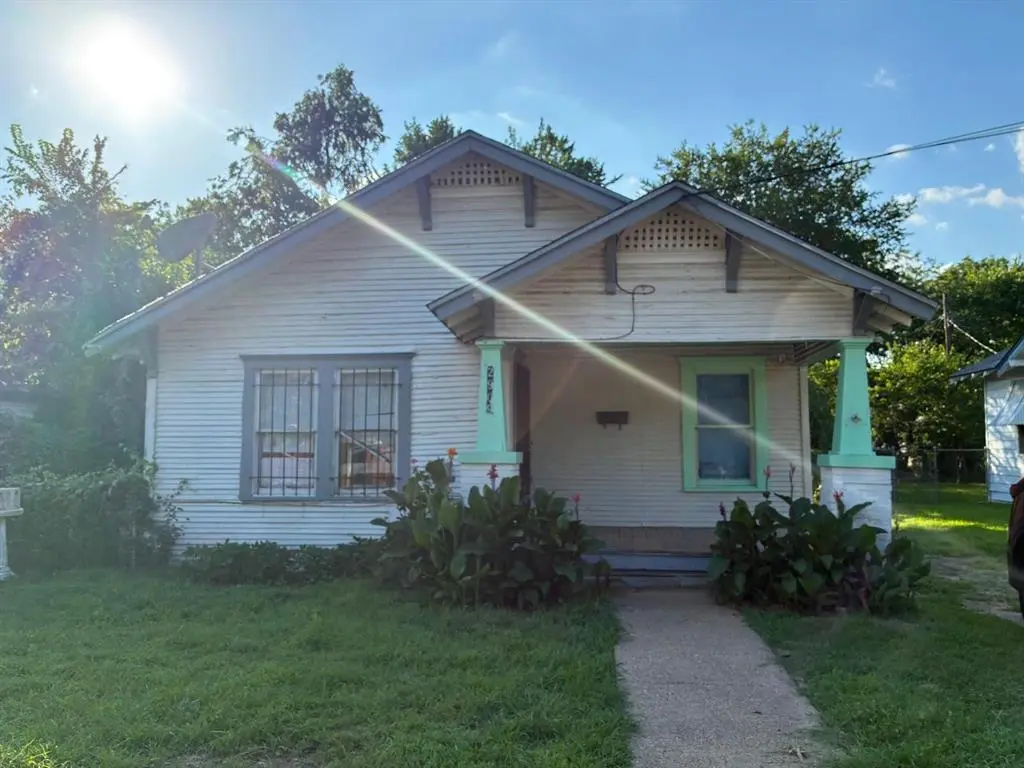
2909 Lenway St · Dallas, TX
Flood risk 3/10 · Minor
- FEMA flood zone
- X (unshaded)
- Chance of flooding over 30 yrs
- 0.1%
- Est. flood insurance / yr
- $507 – $1,088
Fire risk 1/10 · Minimal
- Est. fire insurance / yr
- $1,222 – $2,270
Heat risk 7/10 · Major
- Hot days now (above 110°F)
- 7 days/yr
- Hot days in 30 yrs
- 24 days/yr
Wind risk 6/10 · Moderate
- Chance of severe wind over 30 yrs
- 27.0%
Air-quality risk 3/10 · Minor
- Unhealthy air days now
- 2 days/yr
- Unhealthy air days in 30 yrs
- 3 days/yr
Risk factors via First Street. Map © Google.
Why this score? — see what drove the A- grade
The composite is a weighted blend of 9 inputs, each scored 0–100. Each bar is that input's sub-score; the figure is the points it added to the 100-point composite (weight × sub-score).
- Cash flow +30.0/30.0
- ARV discount +15.0/15.0
- 1% rule +10.0/10.0
- DSCR +10.0/10.0
- Appreciation +5.4/10.0
- Rent growth +4.3/5.0
- Livability +4.0/5.0
- Schools +2.8/10.0
- Condition / age +2.5/5.0
$95,000
🖨 Deal sheet 📄 Offer letter ✓ Due diligence
Listing remarks
PERFECT INVESTOR OPPORTUNITY. House located in the heart of Dallas near Fair Park. Cash only or Private Money Lender. Contact listing agent for details!
Key facts
- 5,502 sq ft lot
- Built 1925
- Listed 15 days
Property features AI
Finance
- Other: Subdivision: Freeman & Camps; County: Dallas; Transaction type: For Sale; Possession at closing/funding
- Financial info: Listing terms: Cash; Treat as clear loan type; No second mortgage
- HOA & community: No association
Exterior
- Parking: On-street parking
- Utilities: City water; City sewer; Not in a municipal utility district
- Home design: Single-family residence; Residential property; One story
- Construction: Built in 1925; Frame construction; Shingle roof; Pillar/post/pier foundation
- Exterior features: No fencing; Lot under 0.5 acre (about 5,502 sq ft)
Interior
- Kitchen: No appliances included
- Bedrooms: Primary bedroom (1st floor) — approx. 10 x 11; Second bedroom (1st floor) — approx. 10 x 10
- Flooring: Hardwood floors
- Bathrooms: 1 full bathroom
- Heating & cooling: Central heating; Central air conditioning
- Interior features: Natural woodwork; One living area; One dining area; 4 total rooms; One level
Neighborhood map
What this means for you Summary
Snapshot
- This is a 2-bed/1.0-bath single-family listed at $95k.
Deal economics
- At list price, monthly cash flow is $456 ($5k/yr) — positive.
- The deal already cash-flows at list — no discount required.
- Meets the 1% rule at list price ($2k rent vs $95k).
- Recommended offer: $94k (1.5% below list) — sets the bar for market timing.
- Cap rate 12.1% vs local median 2.3% in Dallas — top-decile yield for the area; either an underpriced asset or a hidden risk that comps aren't pricing in. Stress-test before assuming the spread holds.
Location & tenants
- Location reads 81/100 on livability (#24 in TX, #1,380 nationally) — a professional / high-income tenant draw. Strengths: amenities A+, commute A+, housing A+; Watch: crime F.
- Dallas ISD (urban): math 31% / reading 36% proficiency, ranked #559 of 826 in TX (top 68%) — families likely to look elsewhere, expect single-tenant / working-renter base with shorter leases; 83% free/reduced lunch — lower-income household profile, screen leases tightly.
- Zoned schools: Paul L Dunbar Learning Center (math 27% / reading 22%, grade F, #3,052 of 4,322 statewide, top 74%, 531 students, 95% FRL).
- Market conditions: Rents rising fast (+7.2%/yr); 248 active listings in the ZIP; 40 comparable units currently listed for rent nearby; rentals at typical pace (median 14d on market — plan ~3-4 weeks tenant-placement turnaround); 12,577 units permitted in Dallas County in 2024 (6,829 in 5+ unit buildings).
- This rent runs 40% of the median local income ($46k/yr) — at the standard rent-burdened threshold; future hikes will face affordability resistance.
Forward outlook
- In year one you build about $1k of equity ($657 loan paydown + $750 appreciation (0.8% local appreciation)).
- Dallas County population projected at +35% by 2050 — long-run rental-demand tailwind backs the buy-and-hold thesis.
- At projected returns (0.8% appreciation + 7.2% rent growth), your $27k cash investment doubles in ~4 years — after that, you're playing with house money.
Negotiation context
- It's been on market 15 days — a 2% lower offer ($94k) is reasonable based on typical stale-listing flexibility.
- 3 sale attempts since 2y ago with the ask held roughly flat each time — persistent listings suggest the price (not the market) is what's stuck; bring a comps-based counter.
Risks & watch-outs
- Watch-outs: property tax is 2.5% of price; built in 1925 — expect roof / HVAC / electrical / plumbing capex.
- Climate carrying-cost: major wind risk, 27% chance of damaging wind over 30y; extreme-heat days projected 7→24/yr by 2055 (HVAC capex compounding) — expect insurance premiums to compound above CPI over the hold.
Questions for the listing agent
- Built in 1925 — when were the roof, HVAC, electrical panel, plumbing, and water heater last replaced?
- Property tax is high relative to price — has the assessment been appealed recently, and will the sale trigger a re-assessment?
- Is there a deadline driving the sale (1031 exchange, divorce, estate, relocation)? That informs how much negotiation room exists.
- Crime grade is F in this area — have there been break-ins, vandalism, or insurance claims at this property in the last 3 years? What carrier currently insures it and at what premium?
- What's the average days-on-market for RENTAL listings here right now (not sales)? A rising rental-DOM trend means longer vacancies and softer asking-rent achievability than the comps imply.
- What's the recent tenant-quality profile in this submarket — average credit score on applications, eviction rate, late-payment / NSF rate, and stable-employment percentage? A property-management company in the area should have these aggregated.
- How much new for-sale + rental construction is in the pipeline within 1–3 miles? Heavy new supply typically softens prices + rents 12–24 months out; constrained supply supports both.
Investment metrics
- 1% rule
- 1.59% ✓
- Cap rate
- 12.05%
- Cash-on-cash
- 20.57%
- DSCR
- 1.92
- GRM
- 5.2
CMA / ARV
- ARV (on-the-fly)
- $130,416
- Comps found
- 12
Show comp detail 12 sales within ~0.75 mi
| Address | Dist | Beds/Ba | Sqft | Sold | Price | $/sf | Match |
|---|---|---|---|---|---|---|---|
| 3121 Metropolitan Ave | 0.29mi | 2/2.0 | 843 (+1%) | 12mo | $249,900 | $296 | 71 |
| 2915 Reed Ln | 0.66mi | 2/1.0 | 836 (0%) | 5mo | $175,000 | $209 | 65 |
| 3512 S Harwood St | 0.68mi | 2/1.0 | 840 (+0%) | 4mo | $90,000 | $107 | 64 |
| 2429 Romine Ave | 0.55mi | 2/2.0 | 864 (+3%) | 12mo | $200,000 | $231 | 55 |
| 3110 Roby St | 0.26mi | 2/2.0 | 728 (-13%) | 13mo | $115,000 | $158 | 51 |
| 3519 Frank St | 0.62mi | 2/1.0 | 924 (+10%) | 4mo | $90,000 | $97 | 50 |
| 3119 Tuskegee St | 0.39mi | 2/1.0 | 720 (-14%) | 12mo | $85,000 | $118 | 49 |
| 2638 Burger Ave | 0.26mi | 1/1.0 (-1) | 744 (-11%) | 21mo | $85,000 | $114 | 47 |
| 3030 Pine St | 0.64mi | 2/1.0 | 744 (-11%) | 8mo | $85,000 | $114 | 45 |
| 2911 Reed Ln | 0.66mi | 2/1.0 | 744 (-11%) | 11mo | $80,000 | $108 | 41 |
| 3912 Atlanta St | 0.58mi | 3/1.0 (+1) | 924 (+10%) | 19mo | $155,900 | $169 | 35 |
| 3634 Atlanta St | 0.39mi | 3/2.0 (+1) | 959 (+15%) | 22mo | $150,000 | $156 | 30 |
Match score weights: distance 35% · size 25% · config 20% · recency 20%. Top-matched comps best support the ARV.
Projected returns pro-forma
0.79% appreciation · 7.19% rent growth · sell at horizon
- IRR
- 26.0%
- Equity multiple
- 2.37×
- Total profit
- $36,571
- Equity at exit
- $31,393
- IRR
- 31.6%
- Equity multiple
- 5.36×
- Total profit
- $115,947
- Equity at exit
- $40,928
Cash invested: $26,600 (down + closing). Projections, not guarantees.
Landlord ↔ Tenant lean methodology
- Overall (STATE)
- 87 Strongly Landlord-Friendly
- State Texas
- 87 Strongly Landlord-Friendly · R+5
- County
- — inherits STATE
- City
- — inherits STATE
ZIP-level market 75215
- Home prices YoY
- 0.3%
- Rents YoY
- 7.2%
- Active inventory
- 248
- Price-to-rent
- 5.2×
Monthly cashflow live
- Estimated rent
- $1,513 high interval (Pro) →
- Mortgage (P&I)
- −$498
- Tax from tax record
- −$202 /mo · $2,421/yr
- Insurance
- −$40
- HOA
- −$0
- Vacancy / Maint / Mgmt
- −$318
- Net cashflow
- $456
Break-even live
UW: 25.0% down · 7.5% · 30yr · 1.5% tax · 5.0% vac · 8.0% maint · 8.0% mgmt
Financing live
Cash to close
- Down payment
- $23,750
- Closing costs
- $2,850
- Reserves months
- —
- Total cash needed
- —
Loan-product check · same deal, 3 products live
Conventional
25% down · 7.5% · 30yr
- Down + closing
- —
- Monthly P&I
- —
- Monthly cashflow
- —
- DSCR
- —
- Eligible?
- —
Personal DTI + credit; lowest rate.
DSCR
20% down · 8.5% · 30yr
- Down + closing
- —
- Monthly P&I
- —
- Monthly cashflow
- —
- DSCR
- —
- Eligible?
- —
No personal income docs; deal must DSCR.
Hard money
10% down · 12.0% · 12mo
- Down + closing
- —
- Monthly P&I
- —
- Monthly cashflow
- —
- DSCR
- —
- Eligible?
- —
Short-term bridge; refi at stabilization.
Rent comps 40 comps
| Address | Beds | Baths | Sqft | Rent | $/sqft | DOM | Units | Dist |
|---|---|---|---|---|---|---|---|---|
| 3711 Guaranty St Dallas, TX | 3.0 | 1.0 | 984 | $1,800 | $1.83 | 15d | 1 | 0.34mi |
| 3501 Latimer St Dallas, TX | 2.0 | 1.0 | 1008 | $1,095 | $1.09 | 2d | 1 | 0.42mi |
| 3907 Roberts Ave Dallas, TX | 3.0 | 1.0 | 908 | $1,395 | $1.54 | 15d | 1 | 0.43mi |
| 4024 Myrtle St Dallas, TX | 3.0 | 2.0 | 1106 | $1,595 | $1.44 | 4d | 1 | 0.59mi |
| 3529 Herrling St Dallas, TX | 2.0 | 1.0 | 632 | $1,200 | $1.90 | 10d | 1 | 0.67mi |
| 3408 Spring Ave Dallas, TX | 3.0 | 2.0 | 780 | $1,340 | $1.72 | 6d | 1 | 0.68mi |
| 2711 Cross St Dallas, TX | 2.0 | 1.0 | 700 | $1,275 | $1.82 | 6d | 1 | 0.77mi |
| 3639 Pine St Dallas, TX | 3.0 | 2.0 | 1090 | $1,490 | $1.37 | 14d | 1 | 0.82mi |
| 2408 Meyers St Unit 204 Dallas, TX | 2.0 | 1.0 | 700 | $770 | $1.10 | 14d | 1 | 0.87mi |
| 1723 Eugene St Unit 2 Dallas, TX | 1.0 | 1.0 | 756 | $1,250 | $1.65 | 43d | 1 | 0.88mi |
| 4205 Metropolitan Ave Dallas, TX | 2.0 | 1.0 | 625 | $1,150 | $1.84 | 43d | 1 | 0.95mi |
| 2513 Southland St Dallas, TX | 2.0 | 1.0 | 1010 | $1,399 | $1.39 | 20d | 1 | 0.97mi |
| 2513 Southland St Dallas, TX | 2.0 | 1.0 | 1010 | $1,299 | $1.29 | 2d | 1 | 0.97mi |
| 2627 Elsie Faye Heggins St Dallas, TX | 3.0 | 2.0 | 876 | $1,280 | $1.46 | 43d | 1 | 0.98mi |
| 2615 Elsie Faye Heggins St Dallas, TX | 3.0 | 2.0 | 876 | $1,280 | $1.46 | 15d | 1 | 0.98mi |
| 2603 Elsie Faye Heggins St Dallas, TX | 3.0 | 2.0 | 876 | $1,385 | $1.58 | 43d | 1 | 0.99mi |
| 2563 Elsie Faye Heggins St Dallas, TX | 3.0 | 2.0 | 876 | $1,240 | $1.42 | 15d | 1 | 0.99mi |
| 2561 Elsie Faye Heggins St Dallas, TX | 3.0 | 2.0 | 876 | $1,390 | $1.59 | 6d | 1 | 0.99mi |
| 1630 Poplar St Dallas, TX | 2.0 | 1.0 | 903 | $1,400 | $1.55 | 24d | 1 | 1.04mi |
| 1724 Pear St Unit 1 Dallas, TX | 2.0 | 1.0 | 605 | $875 | $1.45 | 43d | 1 | 1.04mi |
| 1628 Poplar St Dallas, TX | 2.0 | 1.0 | 903 | $1,400 | $1.55 | 43d | 1 | 1.04mi |
| 4303 Jamaica St Dallas, TX | 3.0 | 2.0 | 1027 | $1,375 | $1.34 | 6d | 1 | 1.05mi |
| 4722 Meadow St Dallas, TX | 2.0–3.0 | 2.0 | 1107 | $1,275 | $1.15 | 11d | 4 | 1.06mi |
| 3526 Elsie Faye Heggins St Dallas, TX | 3.0 | 2.0 | 1113 | $1,795 | $1.61 | 24d | 1 | 1.11mi |
| 3526 Elsie Faye Heggins St Dallas, TX | 3.0 | 2.0 | 1113 | $1,795 | $1.61 | 7d | 1 | 1.11mi |
| 4121 Commerce St Dallas, TX | 1.0 | 1.0–1.5 | 1495 | $3,200 | $2.14 | 7d | 5 | 1.15mi |
| 2010 S Cesar Chavez Blvd Dallas, TX | 1.0 | 1.0 | 791 | $1,047 | $1.32 | 43d | 1 | 1.17mi |
| 3627 Sidney St Dallas, TX | 3.0 | 2.0 | 1090 | $1,614 | $1.48 | 6d | 1 | 1.17mi |
| 4021 Commerce St Dallas, TX | 1.0 | 1.0 | 601 | $1,001 | $1.67 | 2d | 1 | 1.22mi |
| 2829 Oakdale St Dallas, TX | 3.0 | 2.0 | 1028 | $1,840 | $1.79 | 7d | 1 | 1.22mi |
| 4525 Metropolitan Ave Dallas, TX | 3.0 | 2.0 | 1090 | $1,490 | $1.37 | 14d | 1 | 1.28mi |
| 3900 Commerce St Dallas, TX | 2.0 | 1.0–2.0 | 1217 | $3,925 | $3.22 | 6d | 10 | 1.29mi |
| 3900 Commerce St Unit b1 Dallas, TX | 1.0 | 1.0 | 888 | $1,845 | $2.08 | 43d | 1 | 1.29mi |
| 2020 S Ervay St Dallas, TX | 2.0 | 1.0–2.0 | 821 | $2,325 | $2.83 | 3d | 54 | 1.30mi |
| 2016 S Ervay St Unit A2 Dallas, TX | 1.0 | 1.0 | 760 | $1,600 | $2.11 | 43d | 1 | 1.30mi |
| 2016 S Ervay St Unit B1 Dallas, TX | 2.0 | 2.0 | 1102 | $2,225 | $2.02 | 43d | 1 | 1.30mi |
| 2016 S Ervay St Unit A1 Dallas, TX | 1.0 | 1.0 | 660 | $1,449 | $2.20 | 43d | 1 | 1.30mi |
| 1812 Hickory St Dallas, TX | 1.0–2.0 | 1.0–2.0 | 825 | $2,261 | $2.74 | 43d | 19 | 1.31mi |
| 3800 Commerce St Dallas, TX | 1.0 | 1.0 | 892 | $2,138 | $2.40 | 2d | 9 | 1.33mi |
| 2007 S Ervay St Dallas, TX | 1.0 | 1.0 | 1510 | $2,295 | $1.52 | 7d | 2 | 1.35mi |
Listing history 10 events
-
2026-06-18days on market $95,000 Active 15 DOM
-
2026-06-17days on market $95,000 Active 14 DOM
-
2026-06-16days on market $95,000 Active 13 DOM
-
2026-06-15days on market $95,000 Active 12 DOM
-
2026-06-13days on market $95,000 Active 10 DOM
-
2026-06-09days on market $95,000 Active 6 DOM
-
2026-06-08days on market $95,000 Active 5 DOM
-
2026-06-07days on market $95,000 Active 4 DOM
-
2026-06-04remarks 152-char remark
-
2026-06-04$95,000 Active 1 DOM
ⓘ Source: listings_history table (triggers on properties + properties_extension) + one-shot
backfill from property_details.listing_events for pre-trigger history.
Tax reassessment forecast TX · Resets to sale price
- Current annual tax
- $2,421 · $202/mo
- Projected year-2 tax
- $2,421 · $202/mo
- Expected delta
- $0/yr ($0/mo · 0.0%)
ⓘ Screening estimate from a state-policy table — verify with the county assessor before closing.
Climate risk First Street
- Flood 3/10 Moderate FEMA zone X (unshaded) · 10% chance over 30 yrs
- Wildfire 1/10 Low
- Heat 7/10 Severe 7 d/yr ≥110°F today · 24 d/yr by 30 yrs out
- Wind 6/10 Major 27% chance of damaging wind over 30 yrs
- Air quality 3/10 Moderate 2 unhealthy d/yr today · 3 by 30 yrs out
Nearby sold comps map
Loading sold comps map…
Walkable amenities ~0.75 mi
Loading nearby amenities…
Taxation est. · year 1
- Rental income
- $18,161
- − Mortgage interest
- −$5,321
- − Property taxes
- −$2,421
- − Insurance
- −$475
- − Repairs & maintenance
- −$1,453
- − Management
- −$1,453
- − Depreciation
- −$2,764
- Taxable income
- $4,274
- Est. tax owed @ 24.0%
- −$1,026
- After-tax cash flow
- $4,447/yr
For passive investors: Depreciation is non-cash, so a rental often shows a tax loss while cash-flowing — sheltering income. Rental losses are passive: they offset passive income freely, and up to $25,000/yr can offset ordinary (W-2) income if you actively participate and your MAGI is under $100k (phasing out to $0 by $150k); unused losses carry forward. On sale, claimed depreciation is recaptured at up to 25%, and gains may owe capital-gains tax (a 1031 exchange can defer both). Figures are a year-1 estimate at your 24.0% rate — not tax advice; consult a CPA.
Schools (NCES district)
- District
- Dallas ISD
- NCES district ID
- 4816230
- Math proficiency
- 31% ▼ -16.00%
- Reading proficiency
- 36% ▼ -4.00%
- Median HH income
- $42,881
- Composite
- 28.41/100
- National rank
- #6763
- State rank
- #559 of 826 in TX
Livability — Dallas
- Score
- 81/100
- State rank
- #24
- US rank
- #1380
Category grades
Schools grade is shown separately in the Schools card above.
Census & demographics
- Census place
- Dallas, TX
- County
- Dallas County · 2,612,404 people
- City population
- 1,168,437
- Metro
- Dallas-Fort Worth-Arlington, TX
- Population (ZIP)
- 18,895
- Household income
- $45,557
- Rent vs Own
- Severe rent burden
- 1464.0
Population outlook (Dallas County) Hauer SSP2
- Today (2025)
- 2,979,839 people
- By 2030
- 3,191,823 · +7.1%
- By 2040
- 3,619,611 · +21.5%
- By 2050
- 4,026,915 · +35.1%
- By 2075
- 4,957,073 · +66.4%
- By 2100
- 5,508,725 · +84.9%
Race, ethnicity, and origin ACS 2023
- Neighborhood character
- Diverse neighborhood (Simpson 0.58)
- Race & ethnicity
- Black 59% Hispanic / Latino 25% White 11% Two or more races 10%
- Hispanic origin (detail)
- Mexican 21%
- Common ancestry
- Italian 1% Hispanic 1%
- Foreign-born
- 16% · Canada
- Languages at home
- 74% English-only · Spanish 26%
Political lean MEDSL · Dallas
- 2024 margin
- Strong D (+22.2) · D 60.2% · R 38.0% · Other 1.8%
- 2008→2024 swing
- +6.9pp toward D · 2008: 15.3pp · 2024: 22.2pp
- All cycles
- 2024: D+22.2 2020: D+31.6 2016: D+26.2 2012: D+15.4 2008: D+15.3
Not yet ingested
- Civics
- —
Market trends
- HPI YoY
- ▲ 0.79%
- Current HPI
- 224.2955
- Rent YoY
- ▲ 7.19%
- Metro
- Dallas-Fort Worth-Arlington, TX
- State GDP YoY
- ▲ 3.95%
- F500 in state
- 110
Industry mix (Fortune 500 HQ in TX)
| Industry | F500 HQs | Revenue |
|---|---|---|
| Energy | 16 | $1,198B |
|
||
| Technology | 5 | $198B |
|
||
| Engineering / Construction | 4 | $72B |
|
||
| Energy Services | 3 | $60B |
|
||
| Utilities | 3 | $41B |
|
||
| Healthcare | 2 | $330B |
|
||
Price history
-26.9% since first listed9 events — show timeline
- 2026-06-03 Listed $95,000 NTREIS
- 2025-01-08 Price Changed $110,000 NTREIS
- 2025-01-02 Relisted — NTREIS
- 2024-12-26 Contingent — NTREIS
- 2024-11-21 Price Changed $120,000 NTREIS
- 2024-09-19 Listed $130,000 NTREIS
- 2021-01-12 Sold (Public Records) — Public Records
- 2020-12-29 Sold (Public Records) — Public Records
- 2019-11-19 Sold (Public Records) — Public Records
Property tax history
+8.3%/yrLatest (2025): $2,421 · -1.0% YoY. Source: county tax records.
Cash-flow waterfall
monthlySold comps — $/sqft
last 12 mo · ≤1 miLoading sold comps…