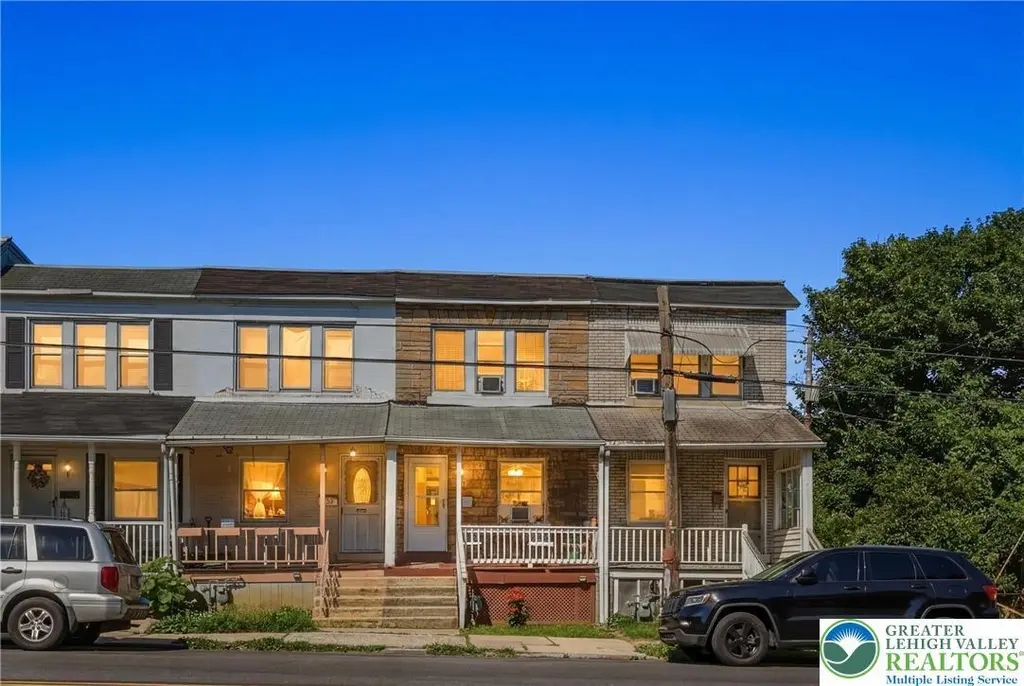
730 S 8th St · Allentown, PA
Flood risk 1/10 · Minimal
- FEMA flood zone
- X (unshaded)
- Chance of flooding over 30 yrs
- 0.0%
- Est. flood insurance / yr
- $473 – $860
Fire risk 2/10 · Minimal
- Est. fire insurance / yr
- $511 – $949
Heat risk 5/10 · Moderate
- Hot days now (above 99°F)
- 7 days/yr
- Hot days in 30 yrs
- 15 days/yr
Wind risk 4/10 · Minor
- Chance of severe wind over 30 yrs
- 16.0%
Air-quality risk 3/10 · Minor
- Unhealthy air days now
- 3 days/yr
- Unhealthy air days in 30 yrs
- 4 days/yr
Risk factors via First Street. Map © Google.
Why this score? — see what drove the D grade
The composite is a weighted blend of 9 inputs, each scored 0–100. Each bar is that input's sub-score; the figure is the points it added to the 100-point composite (weight × sub-score).
- Cash flow +14.3/30.0
- ARV discount +6.6/15.0
- DSCR +4.3/10.0
- Rent growth +4.3/5.0
- Livability +4.0/5.0
- 1% rule +3.5/10.0
- Condition / age +2.5/5.0
- Schools +1.2/10.0
- Appreciation +0.0/10.0
$199,900
🖨 Deal sheet 📄 Offer letter ✓ Due diligence
Listing remarks MLS
Cute Two Bedroom Home With Little Outside Yard Work Economical Gas Warm Air Heat With Central Airconditioning, Gas Hw Heater Updated Electric Service-circut Breakers, Clean Dry Basement Refrigerator, Washer(3yr) And Dryer(6yr) Included Owner Willing To Help With Closing Costs. Vacant! Vacant!
Key facts
- Covered front patio
- Granite countertops
- Rear deck
Tags
Property features AI
Finance
- Other: Zoned R-Mh (Medium High Density)
Exterior
- Parking: 1-car garage; Off-street parking; Parking pad; On-street parking
- Utilities: Public water; Public sewer
- Home design: Brick construction
- Construction: Asphalt/fiberglass roof; Brick exterior; Finished below-grade living area (436); Above-grade finished area (980)
- Exterior features: Deck; Porch; Walk-out basement
Interior
- Kitchen: Gas cooktop; Gas oven; Refrigerator
- Bedrooms: Includes finished basement (walk-out access)
- Flooring: Hardwood; Tile
- Bathrooms: 2 full bathrooms
- Heating & cooling: Gas heating; Ceiling fans; Wall/window air conditioning units
- Interior features: Dining area; Separate/formal dining room
- Laundry & utility: Washer hookup; Dryer hookup; Washer; Dryer; Gas water heater
Neighborhood map
What this means for you Summary
Snapshot
- This is a 2-bed/1.0-bath townhouse listed at $200k.
Deal economics
- At list price, monthly cash flow is $36 ($430/yr) — positive.
- The deal already cash-flows at list — no discount required.
- To meet the 1% rule (rent ≥ 1% of price), the offer needs to be $169k (15.5% below list).
- Recommended offer: $169k (15.5% below list) — sets the bar for 1% rule.
- Cap rate 6.5% vs local median 5.3% in Allentown — meaningfully above typical; check what's discounted (condition, days-on-market, listing class) to confirm the premium yield is real.
Location & tenants
- Location reads 81/100 on livability (#171 in PA, #1,440 nationally) — a professional / high-income tenant draw. Strengths: commute A+, cost of living A+, housing A+; Watch: schools D+, employment D.
- Allentown City SD (urban): math 10% / reading 20% proficiency, ranked #513 of 539 in PA (top 95%) — low school quality limits family demand, transient renter base, plan for 1-2y turnover; 73% free/reduced lunch — lower-income household profile, screen leases tightly.
- Market conditions: Rents rising fast (+7.0%/yr); 161 active listings in the ZIP; 40 comparable units currently listed for rent nearby; rentals at typical pace (median 20d on market — plan ~3-4 weeks tenant-placement turnaround); 765 units permitted in Lehigh County in 2024 (286 in 5+ unit buildings).
Forward outlook
- Local home prices are declining (-3.0%/yr); year-one equity from $1k of loan paydown is wiped out by about $6k of value loss. Plan a longer hold.
- Lehigh County population projected at +21% by 2050 — long-run rental-demand tailwind backs the buy-and-hold thesis.
Negotiation context
- Only 2 days on market — expect competitive offers; lowballing is unlikely to land.
- 2 sale attempts since 25y ago with the ask held roughly flat each time — persistent listings suggest the price (not the market) is what's stuck; bring a comps-based counter.
- Current owner paid $80k; list at $200k implies a 150% gain — meaningful room to come down on a strong offer.
Risks & watch-outs
- Watch-outs: built in 1926 — expect roof / HVAC / electrical / plumbing capex.
- Climate carrying-cost: extreme-heat days projected 7→15/yr by 2055 (HVAC capex compounding) — expect insurance premiums to compound above CPI over the hold.
Questions for the listing agent
- Built in 1926 — when were the roof, HVAC, electrical panel, plumbing, and water heater last replaced?
- Is there a deadline driving the sale (1031 exchange, divorce, estate, relocation)? That informs how much negotiation room exists.
- Schools are D-rated, which usually means shorter tenancies and higher turnover. Who's the typical renter profile here, and what's been the actual vacancy rate?
- The area grade is low — what's the realistic commute time and amenity access for the typical tenant pool here? Any planned neighborhood developments (good or bad) we should know about?
- What's the average days-on-market for RENTAL listings here right now (not sales)? A rising rental-DOM trend means longer vacancies and softer asking-rent achievability than the comps imply.
- What's the recent tenant-quality profile in this submarket — average credit score on applications, eviction rate, late-payment / NSF rate, and stable-employment percentage? A property-management company in the area should have these aggregated.
- How much new for-sale + rental construction is in the pipeline within 1–3 miles? Heavy new supply typically softens prices + rents 12–24 months out; constrained supply supports both.
Investment metrics
- 1% rule
- 0.85% ✗
- Cap rate
- 6.51%
- Cash-on-cash
- 0.77%
- DSCR
- 1.03
- GRM
- 9.9
CMA / ARV
- ARV (on-the-fly)
- $196,000
- Comps found
- 12
Show comp detail 12 sales within ~0.75 mi
| Address | Dist | Beds/Ba | Sqft | Sold | Price | $/sf | Match |
|---|---|---|---|---|---|---|---|
| 218 Priscilla St | 0.67mi | 2/1.0 | 960 (-2%) | 6mo | $195,000 | $203 | 60 |
| 613 S 5th St | 0.34mi | 3/1.0 (+1) | 1,028 (+5%) | 14mo | $185,000 | $180 | 59 |
| 1244 Union St | 0.66mi | 2/1.0 | 1,024 (+4%) | 6mo | $205,000 | $200 | 56 |
| 411 Max St | 0.45mi | 3/1.5 (+1) | 960 (-2%) | 16mo | $185,000 | $193 | 55 |
| 1214 Hickory St | 0.68mi | 2/1.5 | 1,028 (+5%) | 10mo | $147,500 | $143 | 50 |
| 121 S Blank St | 0.66mi | 3/1.0 (+1) | 1,046 (+7%) | 5mo | $160,000 | $153 | 49 |
| 1026 S 10Th St | 0.37mi | 2/1.0 | 840 (-14%) | 15mo | $175,000 | $208 | 47 |
| 745 Genesee St | 0.69mi | 3/1.0 (+1) | 973 (-1%) | 22mo | $189,000 | $194 | 44 |
| 1240 W Union St | 0.65mi | 3/1.0 (+1) | 1,024 (+4%) | 21mo | $200,000 | $195 | 39 |
| 440 Harrison St | 0.36mi | 3/1.0 (+1) | 1,110 (+13%) | 20mo | $254,500 | $229 | 39 |
| 908 S Meadow St | 0.57mi | 3/1.0 (+1) | 1,080 (+10%) | 17mo | $218,000 | $202 | 37 |
| 906 S Meadow St | 0.57mi | 3/1.5 (+1) | 1,080 (+10%) | 17mo | $221,000 | $205 | 35 |
Match score weights: distance 35% · size 25% · config 20% · recency 20%. Top-matched comps best support the ARV.
Projected returns pro-forma
-3.0% appreciation · 7.05% rent growth · sell at horizon
- IRR
- -10.9%
- Equity multiple
- 0.59×
- Total profit
- $-22,970
- Equity at exit
- $29,806
- IRR
- 3.1%
- Equity multiple
- 1.26×
- Total profit
- $14,804
- Equity at exit
- $17,284
Cash invested: $55,972 (down + closing). Projections, not guarantees.
Landlord ↔ Tenant lean methodology
- Overall (STATE)
- 62 Landlord-Friendly
- State Pennsylvania
- 62 Landlord-Friendly · EVEN
- County
- — inherits STATE
- City
- — inherits STATE
ZIP-level market 18103
- Rents YoY
- 7.0%
- Active inventory
- 161
- Price-to-rent
- 9.9×
Monthly cashflow live
- Estimated rent
- $1,690 high interval (Pro) →
- Mortgage (P&I)
- −$1,048
- Tax from tax record
- −$168 /mo · $2,010/yr
- Insurance
- −$83
- HOA
- −$0
- Vacancy / Maint / Mgmt
- −$355
- Net cashflow
- $36
Break-even live
UW: 25.0% down · 7.5% · 30yr · 1.5% tax · 5.0% vac · 8.0% maint · 8.0% mgmt
Financing live
Cash to close
- Down payment
- $49,975
- Closing costs
- $5,997
- Reserves months
- —
- Total cash needed
- —
Loan-product check · same deal, 3 products live
Conventional
25% down · 7.5% · 30yr
- Down + closing
- —
- Monthly P&I
- —
- Monthly cashflow
- —
- DSCR
- —
- Eligible?
- —
Personal DTI + credit; lowest rate.
DSCR
20% down · 8.5% · 30yr
- Down + closing
- —
- Monthly P&I
- —
- Monthly cashflow
- —
- DSCR
- —
- Eligible?
- —
No personal income docs; deal must DSCR.
Hard money
10% down · 12.0% · 12mo
- Down + closing
- —
- Monthly P&I
- —
- Monthly cashflow
- —
- DSCR
- —
- Eligible?
- —
Short-term bridge; refi at stabilization.
Rent comps 40 comps
| Address | Beds | Baths | Sqft | Rent | $/sqft | DOM | Units | Dist |
|---|---|---|---|---|---|---|---|---|
| 701 Harrison St Allentown, PA | 1.0 | 1.0 | 542 | $1,550 | $2.86 | 3d | 8 | 0.13mi |
| 702 Saint John St Apt 3 Allentown, PA | 2.0 | 1.0 | 896 | $1,400 | $1.56 | 3d | 1 | 0.19mi |
| 1018-1024 S Hall St Unit 1022-O Allentown, PA | 1.0 | 1.0 | 650 | $875 | $1.35 | 44d | 1 | 0.24mi |
| 1022 S 10th St Allentown, PA | 2.0 | 1.5 | 840 | $1,600 | $1.90 | 3d | 1 | 0.37mi |
| 1014 Hoe St Allentown, PA | 2.0 | 1.0 | 1016 | $1,850 | $1.82 | 44d | 1 | 0.38mi |
| 520 W Cumberland St Allentown, PA | 1.0–2.0 | 1.0–2.0 | 929 | $2,293 | $2.47 | 3d | 13 | 0.38mi |
| 818 Walnut St Apt 5 Allentown, PA | 2.0 | 1.0 | 936 | $1,450 | $1.55 | 19d | 1 | 0.52mi |
| 1316 S Fountain St Unit 1st floor Allentown, PA | 2.0 | 1.0 | 1000 | $1,550 | $1.55 | 3d | 1 | 0.53mi |
| 1324 S Fountain St Unit 2 Allentown, PA | 2.0 | 1.0 | 1100 | $1,550 | $1.41 | 44d | 1 | 0.54mi |
| 835 S 4th St Unit 2 Allentown, PA | 1.0 | 1.0 | 800 | $1,050 | $1.31 | 44d | 1 | 0.55mi |
| 835 S 4th St Unit 9 Allentown, PA | 1.0 | 1.0 | 900 | $1,025 | $1.14 | 44d | 1 | 0.55mi |
| 555 W Walnut St Allentown, PA | 1.0 | 1.0 | 750 | $1,674 | $2.23 | 3d | 4 | 0.59mi |
| 1046 Walnut St Unit 1 Allentown, PA | 2.0 | 1.0 | 972 | $1,500 | $1.54 | 23d | 1 | 0.60mi |
| 932 W Hamilton St Allentown, PA | 2.0 | 1.0–2.0 | 862 | $2,350 | $2.73 | 3d | 15 | 0.62mi |
| 1010 W Hamilton St Allentown, PA | 1.0–2.0 | 1.0–2.0 | 943 | $2,022 | $2.14 | 3d | 6 | 0.65mi |
| 835 Hamilton St Unit 224 Allentown, PA | 1.0 | 1.0 | 902 | $2,100 | $2.33 | 44d | 1 | 0.66mi |
| 835 Hamilton St Unit 409 Allentown, PA | 2.0 | 2.0 | 1052 | $2,374 | $2.26 | 19d | 1 | 0.66mi |
| 835 Hamilton St Unit 618 Allentown, PA | 1.0 | 1.0 | 872 | $2,025 | $2.32 | 3d | 1 | 0.67mi |
| 835 Hamilton St Unit 511 Allentown, PA | 1.0 | 1.0 | 744 | $1,695 | $2.28 | 14d | 1 | 0.67mi |
| 835 Hamilton St Unit 509 Allentown, PA | 2.0 | 2.0 | 1052 | $2,399 | $2.28 | 19d | 1 | 0.67mi |
| 520 Hamilton St Allentown, PA | 1.0 | 1.0 | 607 | $2,105 | $3.47 | 3d | 5 | 0.67mi |
| 627 Hamilton St Allentown, PA | 1.0 | 1.0 | 623 | $1,485 | $2.38 | 14d | 1 | 0.68mi |
| 450 Maple St Unit 3 Allentown, PA | 1.0 | 1.0 | 900 | $1,100 | $1.22 | 44d | 1 | 0.68mi |
| 25 N 10th St Allentown, PA | 2.0 | 1.0 | 717 | $1,475 | $2.06 | 44d | 1 | 0.72mi |
| 717 S Filmore St Allentown, PA | 2.0 | 1.0 | 950 | $1,745 | $1.84 | 3d | 1 | 0.73mi |
| 27 N 7th St Allentown, PA | 2.0 | 1.0–2.0 | 840 | $2,222 | $2.64 | 3d | 11 | 0.74mi |
| 104 N Eighth St Unit 9 Allentown, PA | 1.0 | 1.0 | 800 | $1,100 | $1.38 | 14d | 1 | 0.75mi |
| 26 N 6th St Allentown, PA | 1.0–2.0 | 1.0–2.0 | 953 | $2,224 | $2.33 | 3d | 9 | 0.75mi |
| 1119 Hamilton St Unit 2 Allentown, PA | 1.0 | 1.0 | 800 | $1,425 | $1.78 | 44d | 1 | 0.75mi |
| 45 N 6th St Allentown, PA | 2.0 | 1.0–2.0 | 1002 | $3,616 | $3.61 | 3d | 13 | 0.75mi |
| 107 N 7th St Allentown, PA | 2.0 | 1.0–2.0 | 855 | $2,972 | $3.47 | 3d | 23 | 0.77mi |
| 830 Chestnut St Unit 3 Allentown, PA | 1.0 | 1.0 | 700 | $1,025 | $1.46 | 21d | 1 | 0.78mi |
| 832 Chestnut St Allentown, PA | 3.0 | 1.0 | 1124 | $2,100 | $1.87 | 23d | 1 | 0.78mi |
| 830 Chestnut St Unit 2 Allentown, PA | 1.0 | 1.0 | 700 | $1,100 | $1.57 | 3d | 1 | 0.78mi |
| 39 N 11th St Unit C Allentown, PA | 1.0 | 1.0 | 1064 | $1,295 | $1.22 | 44d | 1 | 0.78mi |
| 122 8th St Unit B Allentown, PA | 1.0 | 1.0 | 800 | $985 | $1.23 | 44d | 1 | 0.78mi |
| 45 N 11th St Unit 3 Allentown, PA | 2.0 | 1.0 | 900 | $1,250 | $1.39 | 3d | 1 | 0.79mi |
| 125 N Eighth St Allentown, PA | 1.0 | 1.0 | 547 | $1,450 | $2.65 | 44d | 1 | 0.79mi |
| 123-127 N Lumber St Unit 4A Allentown, PA | 1.0 | 1.0 | 685 | $1,500 | $2.19 | 44d | 1 | 0.79mi |
| 128 N Eighth St Unit 2C Allentown, PA | 1.0 | 2.0 | 850 | $1,450 | $1.71 | 44d | 1 | 0.80mi |
Listing history 3 events
-
2026-06-03days on market $199,900 Active 2 DOM
-
2026-06-02remarks 699-char remark
-
2026-06-02$199,900 Active 1 DOM
ⓘ Source: listings_history table (triggers on properties + properties_extension) + one-shot
backfill from property_details.listing_events for pre-trigger history.
Tax reassessment forecast PA · Partial reset (capped growth)
- Current annual tax
- $2,010 · $168/mo
- Projected year-2 tax
- $2,584 · $215/mo
- Expected delta
- +$574/yr (+$48/mo · 28.6%)
ⓘ Screening estimate from a state-policy table — verify with the county assessor before closing.
Climate risk First Street
- Flood 1/10 Low FEMA zone X (unshaded) · 0% chance over 30 yrs
- Wildfire 2/10 Low
- Heat 5/10 Major 7 d/yr ≥99°F today · 15 d/yr by 30 yrs out
- Wind 4/10 Moderate 16% chance of damaging wind over 30 yrs
- Air quality 3/10 Moderate 3 unhealthy d/yr today · 4 by 30 yrs out
Nearby sold comps map
Loading sold comps map…
Walkable amenities ~0.75 mi
Loading nearby amenities…
Taxation est. · year 1
- Rental income
- $20,277
- − Mortgage interest
- −$11,198
- − Property taxes
- −$2,010
- − Insurance
- −$1,000
- − Repairs & maintenance
- −$1,622
- − Management
- −$1,622
- − Depreciation
- −$5,815
- Taxable loss
- −$2,989
- Est. tax savings @ 24.0%
- +$717
- After-tax cash flow
- $1,147/yr
For passive investors: Depreciation is non-cash, so a rental often shows a tax loss while cash-flowing — sheltering income. Rental losses are passive: they offset passive income freely, and up to $25,000/yr can offset ordinary (W-2) income if you actively participate and your MAGI is under $100k (phasing out to $0 by $150k); unused losses carry forward. On sale, claimed depreciation is recaptured at up to 25%, and gains may owe capital-gains tax (a 1031 exchange can defer both). Figures are a year-1 estimate at your 24.0% rate — not tax advice; consult a CPA.
Schools (NCES district)
- District
- Allentown City SD
- NCES district ID
- 4202280
- Math proficiency
- 10% ▼ -10.00%
- Reading proficiency
- 20% ▼ -15.00%
- Median HH income
- $36,337
- Composite
- 12.43/100
- National rank
- #9630
- State rank
- #513 of 539 in PA
Livability — Allentown
- Score
- 81/100
- State rank
- #171
- US rank
- #1440
Category grades
Schools grade is shown separately in the Schools card above.
Census & demographics
- Census place
- Allentown, PA
- County
- Lehigh County · 333,019 people
- City population
- 172,996
- Metro
- Allentown-Bethlehem-Easton, PA-NJ
- Population (ZIP)
- 48,746
- Household income
- $72,895
- Rent vs Own
- Severe rent burden
- 1792.0
Population outlook (Lehigh County) Hauer SSP2
- Today (2025)
- 392,957 people
- By 2030
- 408,319 · +3.9%
- By 2040
- 440,007 · +12.0%
- By 2050
- 475,940 · +21.1%
- By 2075
- 590,448 · +50.3%
- By 2100
- 690,314 · +75.7%
Race, ethnicity, and origin ACS 2023
- Neighborhood character
- Diverse neighborhood (Simpson 0.63)
- Race & ethnicity
- White 46% Hispanic / Latino 38% Two or more races 15% Black 9% Asian 3% Native American 1%
- Hispanic origin (detail)
- Mexican 4% Puerto Rican 15% Dominican 13%
- Common ancestry
- Romanian 3% Polish 3% Iranian 1%
- Foreign-born
- 19% · Canada, Jamaica, Vietnam
- Languages at home
- 64% English-only · Spanish 30% Other Indo-European 1% Other Asian/Pacific 1%
Political lean MEDSL · Lehigh
- 2024 margin
- Toss-up / Even · D 50.7% · R 48.0% · Other 1.2%
- 2008→2024 swing
- -12.9pp toward R · 2008: 15.6pp · 2024: 2.7pp
- All cycles
- 2024: D+2.7 2020: D+7.6 2016: D+4.4 2012: D+7.5 2008: D+15.6
Not yet ingested
- Civics
- —
Market trends
- HPI YoY
- ▼ -358.28%
- Current HPI
- 298.1512
- Rent YoY
- ▲ 7.05%
- Metro
- Allentown-Bethlehem-Easton, PA-NJ
- State GDP YoY
- ▲ 1.68%
- F500 in state
- 34
Industry mix (Fortune 500 HQ in PA)
| Industry | F500 HQs | Revenue |
|---|---|---|
| Healthcare | 2 | $309B |
|
||
| Insurance | 2 | $27B |
|
||
| Telecommunications / Media | 1 | $124B |
|
||
| Industrial Distribution | 1 | $22B |
|
||
| Financial Services | 1 | $20B |
|
||
| Chemicals / Materials | 1 | $18B |
|
||
Price history
+2565.3% since first listed6 events — show timeline
- 2026-06-01 Listed $199,900 GLVRMLS
- 2021-02-16 Sold (Public Records) $80,000 Public Records
- 2001-06-01 Sold (Public Records) $36,860 Public Records
- 2001-05-30 Sold (MLS) $36,860 GLVRMLS
- 2001-03-22 Listed $42,000 GLVRMLS
- 1970-01-01 Sold (Public Records) $7,500 Public Records
Property tax history
-2.1%/yrLatest (2026): $2,010 · +0.7% YoY. Source: county tax records.
Cash-flow waterfall
monthlySold comps — $/sqft
last 12 mo · ≤1 miLoading sold comps…