 10-Plex
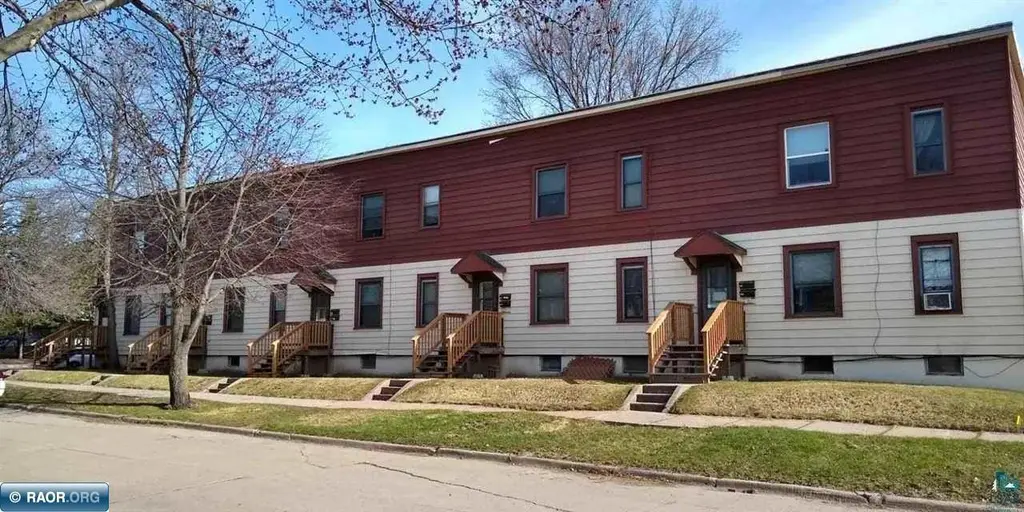
602 7th St S · Virginia, MN
Flood risk 1/10 · Minimal
- FEMA flood zone
- —
- Chance of flooding over 30 yrs
- 0.0%
- Est. flood insurance / yr
- —
Fire risk 4/10 · Minor
- Est. fire insurance / yr
- $888 – $1,650
Heat risk 1/10 · Minimal
- Hot days now (above 91°F)
- 7 days/yr
- Hot days in 30 yrs
- 12 days/yr
Wind risk 1/10 · Minimal
- Chance of severe wind over 30 yrs
- —
Air-quality risk 2/10 · Minimal
- Unhealthy air days now
- 2 days/yr
- Unhealthy air days in 30 yrs
- 2 days/yr
Risk factors via First Street. Map © Google.
Why this score? — see what drove the B grade
The composite is a weighted blend of 9 inputs, each scored 0–100. Each bar is that input's sub-score; the figure is the points it added to the 100-point composite (weight × sub-score).
- Cash flow +30.0/30.0
- 1% rule +10.0/10.0
- DSCR +10.0/10.0
- ARV discount +7.5/15.0
- Schools +5.0/10.0
- Livability +3.2/5.0
- Rent growth +2.5/5.0
- Condition / age +2.5/5.0
- Appreciation +0.0/10.0
$419,900
🖨 Deal sheet (PDF) 📄 Offer letter ✓ Due diligence
Multi-family units
County records classify this as Multi-Family (5+ Unit). Listing-text estimate: 10 units. confirmed
5+ unit building — per-unit beds/baths from public records are typically unavailable; the breakdown below (if shown) is an estimate from the listing text.
Listing remarks MLS
Attention investors! Look at this chance to purchase a rare 10 unit building with partial seller financing! Well maintained fully occupied 10 unit apartment building with 3 two bedroom units and 7 one bedroom units. This property has upgrades including new roof, new high efficiency heating system, new on demand hot water, and new commercial water softener system. All units have updated interiors and all 10 units have new rear decks and front porches. Steel siding and many new windows throughout. Property has been well managed and is fully occupied with no delinquencies. Rental performance is 5,600/mo with all utilities tenant paid. Rents are below market with significant opportunity to optimize cash flow and value.
Key facts
- Roof renovated
- 7,680 sq ft lot
- Built 1907
Tags
Property features AI
Exterior
- Parking: On-street parking
- Utilities: Public water; Public sewer
- Home design: Residential income property; Apartment complex
- Construction: Frame construction; Metal siding
- Exterior features: Balcony
Interior
- Heating & cooling: Natural gas heating; Hot water heating
- Interior features: Full basement; Balcony
Neighborhood map
What this means for you Summary
Snapshot
- This is a 3×2bd/1ba + 7×1bd/1ba units multifamily listed at $420k.
Deal economics
- At list price, monthly cash flow is $4k ($48k/yr) — positive. Per door: $398/mo.
- The deal already cash-flows at list — no discount required.
- Meets the 1% rule at list price ($9k rent vs $420k).
- Recommended offer: $407k (3.0% below list) — sets the bar for market timing.
- Cap rate 17.7% vs local median 7.7% in Virginia — top-decile yield for the area; either an underpriced asset or a hidden risk that comps aren't pricing in. Stress-test before assuming the spread holds.
Location & tenants
- Location reads 63/100 on livability (#664 in MN) — a middle-class / working-renter tenant base. Strengths: cost of living A+, housing A+; Watch: schools C-, crime D, health & safety D.
- Market conditions: 65 active listings in the ZIP; 639 units permitted in St. Louis County in 2024 (338 in 5+ unit buildings).
- At $9,090/mo this rent would consume 203% of the median local household income ($54k/yr) (locally 286% of renters already pay >50% of income on rent) — very limited rent-growth headroom before tenants either downsize or default.
Forward outlook
- Local home prices are declining (-3.0%/yr); year-one equity from $3k of loan paydown is wiped out by about $13k of value loss. Plan a longer hold.
- At projected returns (-3.0% appreciation + 3.0% rent growth), your $118k cash investment doubles in ~3 years — after that, you're playing with house money.
Negotiation context
- It's been on market 44 days — a 3% lower offer ($407k) is reasonable based on typical stale-listing flexibility.
- 5 sale attempts since 5y ago with the ask held roughly flat each time — persistent listings suggest the price (not the market) is what's stuck; bring a comps-based counter.
Risks & watch-outs
- Watch-outs: built in 1907 — expect roof / HVAC / electrical / plumbing capex.
Questions for the listing agent
- It's been on market 44 days. Have you received any prior offers? Is the seller open to a 3% concession, seller financing, or rate buy-down credit?
- Can we see the unit-by-unit rent roll, current vacancy, and any below-market leases? What's the average tenancy length?
- What capital expenditures (roof, boiler, parking lot, exteriors) have been made in the last 5 years, and what's planned in the next 2?
- Built in 1907 — when were the roof, HVAC, electrical panel, plumbing, and water heater last replaced?
- Is there a deadline driving the sale (1031 exchange, divorce, estate, relocation)? That informs how much negotiation room exists.
- Crime grade is D in this area — have there been break-ins, vandalism, or insurance claims at this property in the last 3 years? What carrier currently insures it and at what premium?
- What's the average days-on-market for RENTAL listings here right now (not sales)? A rising rental-DOM trend means longer vacancies and softer asking-rent achievability than the comps imply.
- What's the recent tenant-quality profile in this submarket — average credit score on applications, eviction rate, late-payment / NSF rate, and stable-employment percentage? A property-management company in the area should have these aggregated.
- How much new apartment / multifamily construction is in the pipeline within 1–3 miles? Heavy new supply (>2% of stock underway) typically softens rents 12–24 months out; light construction supports rent growth.
Investment metrics
- 1% rule
- 2.16% ✓
- Cap rate
- 17.67%
- Cash-on-cash
- 40.63%
- DSCR
- 2.81
- GRM
- 3.8
CMA / ARV
No comps found within radius.
Projected returns pro-forma
-3.0% appreciation · 3.0% rent growth · sell at horizon
- IRR
- 37.1%
- Equity multiple
- 2.58×
- Total profit
- $185,787
- Equity at exit
- $62,608
- IRR
- 43.7%
- Equity multiple
- 5.16×
- Total profit
- $489,515
- Equity at exit
- $36,305
Cash invested: $117,572 (down + closing). Projections, not guarantees.
Landlord ↔ Tenant lean methodology
- Overall (STATE)
- 46 Balanced
- State Minnesota
- 46 Balanced · D+2
- County
- — inherits STATE
- City
- — inherits STATE
ZIP-level market 55792
- Home prices YoY
- -26.5%
- Active inventory
- 65
- Price-to-rent
- 37.2×
Monthly cashflow live
- Estimated rent
- $9,090 high interval (Pro) →
- Mortgage (P&I)
- −$2,202
- Tax from tax record
- −$824 /mo · $9,886/yr
- Insurance
- −$175
- HOA
- −$0
- Vacancy / Maint / Mgmt
- −$1,909
- Net cashflow
- $3,980
Break-even live
Sensitivity live
| Price | -10% $4,218 | -5% $4,099 | +0% $3,980 | +5% $3,861 | +10% $3,743 |
|---|---|---|---|---|---|
| Rent | -10% $3,262 | -5% $3,621 | +0% $3,980 | +5% $4,339 | +10% $4,698 |
| Rate | -1.0pp $4,192 | -0.5pp $4,087 | base $3,980 | +0.5pp $3,872 | +1.0pp $3,761 |
10-unit breakdown (identical units grouped — click to expand)
| Units | Beds | Baths | Est. rent |
|---|---|---|---|
| 3× units | 2 | 1 | $2,826 |
| #1 | 2 | 1 | $942 |
| #2 | 2 | 1 | $942 |
| #3 | 2 | 1 | $942 |
| 7× units | 1 | 1 | $6,265 |
| #4 | 1 | 1 | $895 |
| #5 | 1 | 1 | $895 |
| #6 | 1 | 1 | $895 |
| #7 | 1 | 1 | $895 |
| #8 | 1 | 1 | $895 |
| #9 | 1 | 1 | $895 |
| #10 | 1 | 1 | $895 |
| Total (10 units) | $9,090 | ||
UW: 25.0% down · 7.5% · 30yr · 1.5% tax · 5.0% vac · 8.0% maint · 8.0% mgmt
Financing live
Cash to close
- Down payment
- $104,975
- Closing costs
- $12,597
- Reserves months
- —
- Total cash needed
- —
Loan-product check · same deal, 3 products live
Conventional
25% down · 7.5% · 30yr
- Down + closing
- —
- Monthly P&I
- —
- Monthly cashflow
- —
- DSCR
- —
- Eligible?
- —
Personal DTI + credit; lowest rate.
DSCR
20% down · 8.5% · 30yr
- Down + closing
- —
- Monthly P&I
- —
- Monthly cashflow
- —
- DSCR
- —
- Eligible?
- —
No personal income docs; deal must DSCR.
Hard money
10% down · 12.0% · 12mo
- Down + closing
- —
- Monthly P&I
- —
- Monthly cashflow
- —
- DSCR
- —
- Eligible?
- —
Short-term bridge; refi at stabilization.
Listing history 31 events
-
2026-06-21days on market $419,900 Active 44 DOM
-
2026-06-19days on market $419,900 Active 42 DOM
-
2026-06-18days on market $419,900 Active 41 DOM
-
2026-06-17days on market $419,900 Active 40 DOM
-
2026-06-16days on market $419,900 Active 39 DOM
-
2026-06-15days on market $419,900 Active 38 DOM
-
2026-06-14days on market $419,900 Active 36 DOM
-
2026-06-13days on market $419,900 Active 35 DOM
-
2026-06-10days on market $419,900 Active 33 DOM
-
2026-06-09days on market $419,900 Active 32 DOM
-
2026-06-08days on market $419,900 Active 31 DOM
-
2026-06-07days on market $419,900 Active 30 DOM
-
2026-06-05days on market $419,900 Active 27 DOM
-
2026-06-03days on market $419,900 Active 26 DOM
-
2026-06-02days on market $419,900 Active 25 DOM
-
2026-06-01days on market $419,900 Active 24 DOM
-
2026-05-31days on market $419,900 Active 23 DOM
-
2026-05-30days on market $419,900 Active 22 DOM
-
2026-05-08$419,900 Active
-
2025-05-19historical $1,100
-
2025-03-14$1,100
-
2025-03-13historical $1,100
-
2025-03-05$1,100
-
2024-02-17historical $1,050
-
2024-01-04price $1,050
-
2023-12-13$1,005
-
2022-01-19soldstatus $460,000
-
2021-12-30soldstatus $460,000 724-char remark
Show marketing remark (724 chars)
Attention investors! Look at this chance to purchase a rare 10 unit building with partial seller financing! Well maintained fully occupied 10 unit apartment building with 3 two bedroom units and 7 one bedroom units. This property has upgrades including new roof, new high efficiency heating system, new on demand hot water, and new commercial water softener system. All units have updated interiors and all 10 units have new rear decks and front porches. Steel siding and many new windows throughout. Property has been well managed and is fully occupied with no delinquencies. Rental performance is 5,600/mo with all utilities tenant paid. Rents are below market with significant opportunity to optimize cash flow and value.
-
2021-05-01$469,000 724-char remark
Show marketing remark (724 chars)
Attention investors! Look at this chance to purchase a rare 10 unit building with partial seller financing! Well maintained fully occupied 10 unit apartment building with 3 two bedroom units and 7 one bedroom units. This property has upgrades including new roof, new high efficiency heating system, new on demand hot water, and new commercial water softener system. All units have updated interiors and all 10 units have new rear decks and front porches. Steel siding and many new windows throughout. Property has been well managed and is fully occupied with no delinquencies. Rental performance is 5,600/mo with all utilities tenant paid. Rents are below market with significant opportunity to optimize cash flow and value.
-
2018-12-11soldstatus $200,000
-
2014-08-07soldstatus $250,000
ⓘ Source: listings_history table (triggers on properties + properties_extension) + one-shot
backfill from property_details.listing_events for pre-trigger history.
Tax reassessment forecast MN · Partial reset (capped growth)
- Current annual tax
- $9,886 · $824/mo
- Projected year-2 tax
- $9,886 · $824/mo
- Expected delta
- $0/yr ($0/mo · 0.0%)
ⓘ Screening estimate from a state-policy table — verify with the county assessor before closing.
Climate risk First Street
- Flood 1/10 Low 0% chance over 30 yrs
- Wildfire 4/10 Moderate
- Heat 1/10 Low 7 d/yr ≥91°F today · 12 d/yr by 30 yrs out
- Wind 1/10 Low
- Air quality 2/10 Low 2 unhealthy d/yr today · 2 by 30 yrs out
Nearby sold comps map
Loading sold comps map…
Walkable amenities ~0.75 mi
Loading nearby amenities…
Taxation est. · year 1
- Rental income
- $109,080
- − Mortgage interest
- −$23,521
- − Property taxes
- −$9,886
- − Insurance
- −$2,100
- − Repairs & maintenance
- −$8,726
- − Management
- −$8,726
- − Depreciation
- −$12,215
- Taxable income
- $43,905
- Est. tax owed @ 24.0%
- −$10,537
- After-tax cash flow
- $37,226/yr
For passive investors: Depreciation is non-cash, so a rental often shows a tax loss while cash-flowing — sheltering income. Rental losses are passive: they offset passive income freely, and up to $25,000/yr can offset ordinary (W-2) income if you actively participate and your MAGI is under $100k (phasing out to $0 by $150k); unused losses carry forward. On sale, claimed depreciation is recaptured at up to 25%, and gains may owe capital-gains tax (a 1031 exchange can defer both). Figures are a year-1 estimate at your 24.0% rate — not tax advice; consult a CPA.
Schools (NCES district)
No district data.
Livability — Virginia
- Score
- 63/100
- State rank
- #664
- US rank
- #15991
Category grades
Schools grade is shown separately in the Schools card above.
Census & demographics
- Census place
- Virginia, MN
- County
- Saint Louis County · 115,152 people
- City population
- 9,663
- Metro
- Duluth, MN-WI
- Population (ZIP)
- 9,663
- Household income
- $53,750
- Rent vs Own
- Severe rent burden
- 286.0
Population outlook (St. Louis County) Hauer SSP2
- Today (2025)
- 202,411 people
- By 2030
- 203,234 · +0.4%
- By 2040
- 202,520 · +0.1%
- By 2050
- 200,853 · -0.8%
- By 2075
- 200,943 · -0.7%
- By 2100
- 192,058 · -5.1%
Race, ethnicity, and origin ACS 2023
- Neighborhood character
- Predominantly White (90%)
- Race & ethnicity
- White 90% Two or more races 4% Native American 3% Asian 1%
- Common ancestry
- Portuguese 12% Romanian 4% Lithuanian 2%
- Foreign-born
- 2% · Canada, Vietnam
- Languages at home
- 96% English-only · Spanish 1% Other Asian/Pacific 1%
Political lean MEDSL · St. Louis
- 2024 margin
- D (+13.7) · D 55.9% · R 42.2% · Other 1.8%
- 2008→2024 swing
- -18.8pp toward R · 2008: 32.5pp · 2024: 13.7pp
- All cycles
- 2024: D+13.7 2020: D+15.6 2016: D+11.8 2012: D+29.6 2008: D+32.5
Not yet ingested
- Civics
- —
Market trends
- HPI YoY
- ▼ -72.05%
- Current HPI
- 199.7165
- Rent YoY
- —
- Metro
- Duluth, MN-WI
- State GDP YoY
- ▲ 2.41%
- F500 in state
- 34
Industry mix (Fortune 500 HQ in MN)
| Industry | F500 HQs | Revenue |
|---|---|---|
| Healthcare | 2 | $407B |
|
||
| Retail | 2 | $150B |
|
||
| Consumer Goods | 2 | $32B |
|
||
| Industrial Machinery | 2 | $6B |
|
||
| Agriculture | 1 | $40B |
|
||
| Healthcare / Medical Devices | 1 | $32B |
|
||
Price history
+68.0% since first listed13 events — show timeline
- 2026-05-08 Listed $419,900 RAOR
- 2025-05-19 Rental Removed $1,100 LEASESTAR
- 2025-03-14 Listed for Rent $1,100 LEASESTAR
- 2025-03-13 Rental Removed $1,100 LEASESTAR
- 2025-03-05 Listed for Rent $1,100 LEASESTAR
- 2024-02-17 Rental Removed $1,050 LEASESTAR
- 2024-01-04 Price Changed $1,050 LEASESTAR
- 2023-12-13 Listed for Rent $1,005 LEASESTAR
- 2022-01-19 Sold (Public Records) $460,000 Public Records
- 2021-12-30 Sold (MLS) $460,000 LSAR
- 2021-05-01 Listed $469,000 LSAR
- 2018-12-11 Sold (Public Records) $200,000 Public Records
- 2014-08-07 Sold (Public Records) $250,000 Public Records
Property tax history
+10.9%/yrLatest (2025): $9,886 · +33.5% YoY. Source: county tax records.
Cash-flow waterfall
monthlySold comps — $/sqft
last 12 mo · ≤1 miLoading sold comps…