 Multi-family
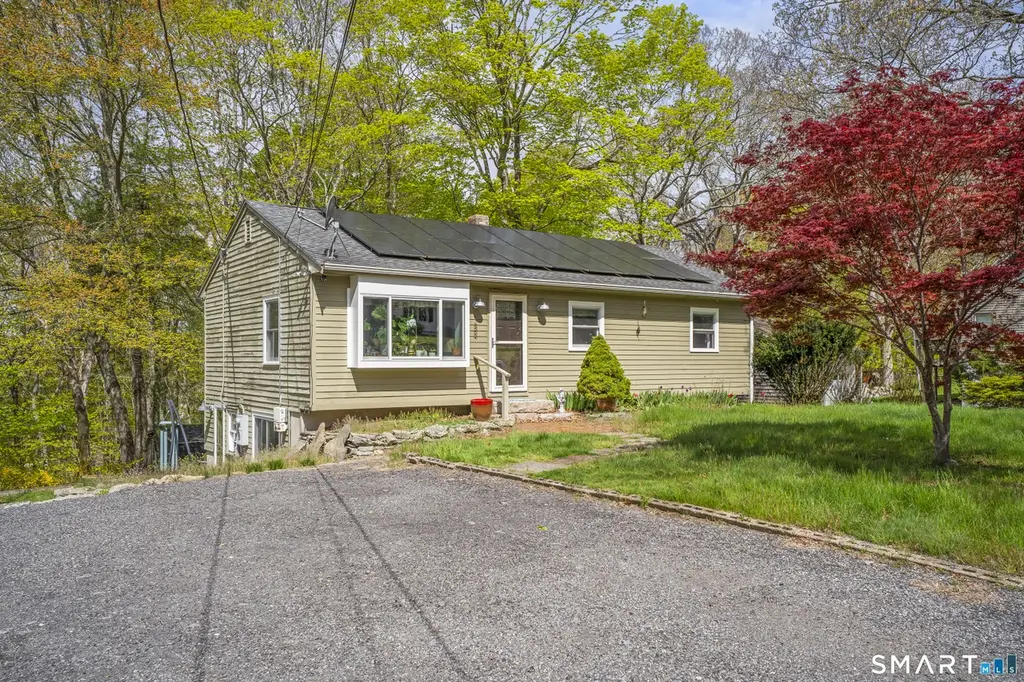
239 Haley Rd · Old Mystic, CT
Flood risk 1/10 · Minimal
- FEMA flood zone
- X (unshaded)
- Chance of flooding over 30 yrs
- 0.0%
- Est. flood insurance / yr
- $507 – $1,088
Fire risk 2/10 · Minimal
- Est. fire insurance / yr
- $829 – $1,539
Heat risk 5/10 · Moderate
- Hot days now (above 94°F)
- 7 days/yr
- Hot days in 30 yrs
- 15 days/yr
Wind risk 8/10 · Major
- Chance of severe wind over 30 yrs
- 80.0%
Air-quality risk 3/10 · Minor
- Unhealthy air days now
- 2 days/yr
- Unhealthy air days in 30 yrs
- 3 days/yr
Risk factors via First Street. Map © Google.
Why this score? — see what drove the C- grade
The composite is a weighted blend of 9 inputs, each scored 0–100. Each bar is that input's sub-score; the figure is the points it added to the 100-point composite (weight × sub-score).
- Cash flow +19.5/30.0
- ARV discount +11.3/15.0
- DSCR +6.2/10.0
- 1% rule +4.9/10.0
- Schools +3.9/10.0
- Livability +3.5/5.0
- Rent growth +2.5/5.0
- Condition / age +2.5/5.0
- Appreciation +0.0/10.0
$359,000
🖨 Deal sheet (PDF) 📄 Offer letter ✓ Due diligence
Multi-family units
County records classify this as Multi-Family (2-4 Unit). Listing-text estimate: 1 unit. estimate disagrees with records
Listing remarks MLS
Convenient ranch style home with additional 800 sf in lower level and full bath. Possible inlaw setup. No seller disclosure. Sold as is. Property has barn/outbuilding
Key facts
- Full size barn
- Solar panels
- Roof replaced
Tags
Property features AI
Exterior
- Parking: Off-street parking; Driveway (crushed stone); Unpaved parking; Total 3 parking spaces
- Utilities: Private well water; Septic sewage; Domestic hot water
- Home design: Single-family home
- Construction: Frame construction; Clapboard siding; Asphalt shingle roof; Concrete foundation; Green exterior color; Built (year not provided)
- Exterior features: Barn; Lightly wooded, sloping lot
Interior
- Kitchen: Oven/Range; Refrigerator
- Bedrooms: Three bedrooms
- Bathrooms: Two full bathrooms
- Heating & cooling: Hot water heat (propane); Window unit cooling; Above-ground fuel tank
- Interior features: Five total rooms; Sitting room; Has attic with access via hatch; No basement
- Laundry & utility: Washer; Dryer; Laundry on lower level
Neighborhood map
What this means for you Summary
Snapshot
- This is a 3-bed/2.0-bath multifamily listed at $359k.
Deal economics
- At list price, monthly cash flow is $407 ($5k/yr) — positive.
- The deal already cash-flows at list — no discount required.
- To meet the 1% rule (rent ≥ 1% of price), the offer needs to be $355k (1.1% below list).
- Recommended offer: $354k (1.5% below list) — sets the bar for market timing.
- Cap rate 7.7% vs local median 4.3% in Old Mystic — top-decile yield for the area; either an underpriced asset or a hidden risk that comps aren't pricing in. Stress-test before assuming the spread holds.
Location & tenants
- Location reads 69/100 on livability (#106 in CT) — a middle-class / working-renter tenant base. Strengths: crime A+, employment A+, housing A+; Watch: cost of living D+, amenities F, commute F.
- Ledyard School District (rural): math 34% / reading 49% proficiency, ranked #92 of 153 in CT (top 60%) — families likely to look elsewhere, expect single-tenant / working-renter base with shorter leases; only 15% free/reduced lunch — higher-income household profile.
- Zoned schools: Gallup Hill School (math 44% / reading 50%, grade D-, #256 of 553 statewide, top 48%, 618 students, 24% FRL); Ledyard Middle School (math 28% / reading 43%, grade F, #120 of 175 statewide, top 70%, 534 students, 27% FRL); Ledyard High School (math 42% / reading 67%, grade C-, #63 of 194 statewide, top 39%, 743 students, 25% FRL).
- Market conditions: 36 active listings in the ZIP; 487 units permitted in Southeastern Connecticut Planning Region in 2024 (244 in 5+ unit buildings).
Forward outlook
- Local home prices are declining (-3.0%/yr); year-one equity from $2k of loan paydown is wiped out by about $11k of value loss. Plan a longer hold.
Negotiation context
- It's been on market 20 days — a 2% lower offer ($354k) is reasonable based on typical stale-listing flexibility.
- 3 sale attempts since 19y ago with the ask held roughly flat each time — persistent listings suggest the price (not the market) is what's stuck; bring a comps-based counter.
- Current owner paid $163k; list at $359k implies a 120% gain — meaningful room to come down on a strong offer.
Risks & watch-outs
- Watch-outs: built in 1957 — expect roof / HVAC / electrical / plumbing capex.
- Climate carrying-cost: severe wind risk, 80% chance of damaging wind over 30y; extreme-heat days projected 7→15/yr by 2055 (HVAC capex compounding) — expect insurance premiums to compound above CPI over the hold.
Questions for the listing agent
- Built in 1957 — when were the roof, HVAC, electrical panel, plumbing, and water heater last replaced?
- Is there a deadline driving the sale (1031 exchange, divorce, estate, relocation)? That informs how much negotiation room exists.
- What's the average days-on-market for RENTAL listings here right now (not sales)? A rising rental-DOM trend means longer vacancies and softer asking-rent achievability than the comps imply.
- What's the recent tenant-quality profile in this submarket — average credit score on applications, eviction rate, late-payment / NSF rate, and stable-employment percentage? A property-management company in the area should have these aggregated.
- How much new apartment / multifamily construction is in the pipeline within 1–3 miles? Heavy new supply (>2% of stock underway) typically softens rents 12–24 months out; light construction supports rent growth.
Investment metrics
- 1% rule
- 0.99% ✗
- Cap rate
- 7.65%
- Cash-on-cash
- 4.86%
- DSCR
- 1.22
- GRM
- 8.4
CMA / ARV
- ARV (median comp)
- $392,178
- List price
- $359,000
- Delta
- -8.46%
- Verdict
- FAIR
- Comps
- 20 within 1.0 mi
Projected returns pro-forma
-3.0% appreciation · 3.0% rent growth · sell at horizon
- IRR
- -8.7%
- Equity multiple
- 0.68×
- Total profit
- $-32,252
- Equity at exit
- $53,528
- IRR
- 0.8%
- Equity multiple
- 1.05×
- Total profit
- $5,299
- Equity at exit
- $31,040
Cash invested: $100,520 (down + closing). Projections, not guarantees.
Landlord ↔ Tenant lean methodology
- Overall (STATE)
- 27 Tenant-Leaning
- State Connecticut
- 27 Tenant-Leaning · D+7
- County
- — inherits STATE
- City
- — inherits STATE
ZIP-level market 06339
- Home prices YoY
- -19.4%
- Active inventory
- 36
- Price-to-rent
- 16.9×
Monthly cashflow live
- Estimated rent
- $3,550 medium interval (Pro) →
- Mortgage (P&I)
- −$1,883
- Tax from tax record
- −$365 /mo · $4,384/yr
- Insurance
- −$150
- HOA
- −$0
- Vacancy / Maint / Mgmt
- −$746
- Net cashflow
- $407
Break-even live
Sensitivity live
| Price | -10% $610 | -5% $509 | +0% $407 | +5% $305 | +10% $204 |
|---|---|---|---|---|---|
| Rent | -10% $126 | -5% $267 | +0% $407 | +5% $547 | +10% $687 |
| Rate | -1.0pp $588 | -0.5pp $498 | base $407 | +0.5pp $314 | +1.0pp $219 |
2-unit breakdown (identical units grouped — click to expand)
| Units | Beds | Baths | Est. rent |
|---|---|---|---|
| 2× units | 2 | 1 | $3,550 |
| #1 | 2 | 1 | $1,775 |
| #2 | 2 | 1 | $1,775 |
| Total (2 units) | $3,550 | ||
UW: 25.0% down · 7.5% · 30yr · 1.5% tax · 5.0% vac · 8.0% maint · 8.0% mgmt
Financing live
Cash to close
- Down payment
- $89,750
- Closing costs
- $10,770
- Reserves months
- —
- Total cash needed
- —
Loan-product check · same deal, 3 products live
Conventional
25% down · 7.5% · 30yr
- Down + closing
- —
- Monthly P&I
- —
- Monthly cashflow
- —
- DSCR
- —
- Eligible?
- —
Personal DTI + credit; lowest rate.
DSCR
20% down · 8.5% · 30yr
- Down + closing
- —
- Monthly P&I
- —
- Monthly cashflow
- —
- DSCR
- —
- Eligible?
- —
No personal income docs; deal must DSCR.
Hard money
10% down · 12.0% · 12mo
- Down + closing
- —
- Monthly P&I
- —
- Monthly cashflow
- —
- DSCR
- —
- Eligible?
- —
Short-term bridge; refi at stabilization.
Listing history 8 events
-
2026-05-08$359,000 Active 613-char remark
-
2015-09-15historical
-
2015-01-06$92,000
-
2007-12-04soldstatus $163,000
-
2007-11-30soldstatus $163,000
Show marketing remark (166 chars)
Convenient ranch style home with additional 800 sf in lower level and full bath. Possible inlaw setup. No seller disclosure. Sold as is. Property has barn/outbuilding
-
2007-06-26$170,000
Show marketing remark (166 chars)
Convenient ranch style home with additional 800 sf in lower level and full bath. Possible inlaw setup. No seller disclosure. Sold as is. Property has barn/outbuilding
-
2006-01-11soldstatus $200,000
-
2005-02-22soldstatus $200,000
ⓘ Source: listings_history table (triggers on properties + properties_extension) + one-shot
backfill from property_details.listing_events for pre-trigger history.
Tax reassessment forecast CT · Partial reset (capped growth)
- Current annual tax
- $4,384 · $365/mo
- Projected year-2 tax
- $6,033 · $503/mo
- Expected delta
- +$1,649/yr (+$137/mo · 37.6%)
ⓘ Screening estimate from a state-policy table — verify with the county assessor before closing.
Climate risk First Street
- Flood 1/10 Low FEMA zone X (unshaded) · 0% chance over 30 yrs
- Wildfire 2/10 Low
- Heat 5/10 Major 7 d/yr ≥94°F today · 15 d/yr by 30 yrs out
- Wind 8/10 Severe 80% chance of damaging wind over 30 yrs
- Air quality 3/10 Moderate 2 unhealthy d/yr today · 3 by 30 yrs out
Nearby sold comps map
Loading sold comps map…
Walkable amenities ~0.75 mi
Loading nearby amenities…
Taxation est. · year 1
- Rental income
- $42,600
- − Mortgage interest
- −$20,110
- − Property taxes
- −$4,384
- − Insurance
- −$1,795
- − Repairs & maintenance
- −$3,408
- − Management
- −$3,408
- − Depreciation
- −$10,444
- Taxable loss
- −$948
- Est. tax savings @ 24.0%
- +$228
- After-tax cash flow
- $5,111/yr
For passive investors: Depreciation is non-cash, so a rental often shows a tax loss while cash-flowing — sheltering income. Rental losses are passive: they offset passive income freely, and up to $25,000/yr can offset ordinary (W-2) income if you actively participate and your MAGI is under $100k (phasing out to $0 by $150k); unused losses carry forward. On sale, claimed depreciation is recaptured at up to 25%, and gains may owe capital-gains tax (a 1031 exchange can defer both). Figures are a year-1 estimate at your 24.0% rate — not tax advice; consult a CPA.
Schools (NCES district)
- District
- Ledyard School District
- NCES district ID
- 0902160
- Math proficiency
- 34% ▼ -12.00%
- Reading proficiency
- 49% ▼ -6.00%
- Median HH income
- $84,854
- Composite
- 39.02/100
- National rank
- #4064
- State rank
- #92 of 153 in CT
Livability — Old Mystic
- Score
- 69/100
- State rank
- #106
- US rank
- #9037
Category grades
Schools grade is shown separately in the Schools card above.
Census & demographics
- Population (ZIP)
- 9,263
Population outlook (Southeastern Connecticut County) Hauer SSP2
- By 2040
- 293,442
Race, ethnicity, and origin ACS 2023
- Neighborhood character
- Predominantly White (80%)
- Race & ethnicity
- White 80% Hispanic / Latino 9% Two or more races 6% Asian 3% Black 2% Native American 1%
- Hispanic origin (detail)
- Mexican 1% Puerto Rican 5%
- Common ancestry
- Romanian 4% Italian 2% Lithuanian 2%
- Foreign-born
- 5% · Canada, China, Jamaica
- Languages at home
- 91% English-only · Spanish 5% Chinese 2% Russian/Polish/Slavic 1%
Political lean MEDSL · Southeastern Connecticut
- 2024 margin
- D (+13.0) · D 55.6% · R 42.6% · Other 1.8%
- All cycles
- 2024: D+13.0
Not yet ingested
- Civics
- —
Market trends
- HPI YoY
- ▼ -61.39%
- Current HPI
- 255.764
- Rent YoY
- —
- Metro
- —
- State GDP YoY
- ▲ 1.06%
- F500 in state
- 38
Industry mix (Fortune 500 HQ in CT)
| Industry | F500 HQs | Revenue |
|---|---|---|
| Industrial Machinery | 4 | $38B |
|
||
| Insurance | 3 | $71B |
|
||
| Financial Services | 2 | $25B |
|
||
| Transportation / Logistics | 2 | $18B |
|
||
| Healthcare | 1 | $247B |
|
||
| Telecommunications | 1 | $55B |
|
||
Price history
+79.5% since first listed9 events — show timeline
- 2026-05-28 Pending — Smart MLS
- 2026-05-08 Listed $359,000 Smart MLS
- 2015-09-15 Listing Removed — Smart MLS
- 2015-01-06 Listed $92,000 Smart MLS
- 2007-12-04 Sold (Public Records) $163,000 Public Records
- 2007-11-30 Sold (MLS) $163,000 Smart MLS
- 2007-06-26 Listed $170,000 Smart MLS
- 2006-01-11 Sold (Public Records) $200,000 Public Records
- 2005-02-22 Sold (Public Records) $200,000 Public Records
Property tax history
+2.0%/yrLatest (2023): $4,384 · +2.2% YoY. Source: county tax records.
Cash-flow waterfall
monthlySold comps — $/sqft
last 12 mo · ≤1 miLoading sold comps…