2 Lanoka Trl · Pocono Springs, PA
Flood risk 1/10 · Minimal
- FEMA flood zone
- X (unshaded)
- Chance of flooding over 30 yrs
- 0.0%
- Est. flood insurance / yr
- $507 – $1,088
Fire risk 1/10 · Minimal
- Est. fire insurance / yr
- $511 – $949
Heat risk 1/10 · Minimal
- Hot days now (above 88°F)
- 7 days/yr
- Hot days in 30 yrs
- 16 days/yr
Wind risk 3/10 · Minor
- Chance of severe wind over 30 yrs
- 5.0%
Air-quality risk 2/10 · Minimal
- Unhealthy air days now
- 1 days/yr
- Unhealthy air days in 30 yrs
- 2 days/yr
Risk factors via First Street. Map © Google.
Why this score? — see what drove the C+ grade
The composite is a weighted blend of 9 inputs, each scored 0–100. Each bar is that input's sub-score; the figure is the points it added to the 100-point composite (weight × sub-score).
- Cash flow +15.0/30.0
- ARV discount +15.0/15.0
- Appreciation +6.5/10.0
- 1% rule +5.0/10.0
- DSCR +5.0/10.0
- Schools +5.0/10.0
- Livability +3.7/5.0
- Rent growth +2.5/5.0
- Condition / age +2.5/5.0
$29,999
🖨 Deal sheet 📄 Offer letter ✓ Due diligence
Listing remarks
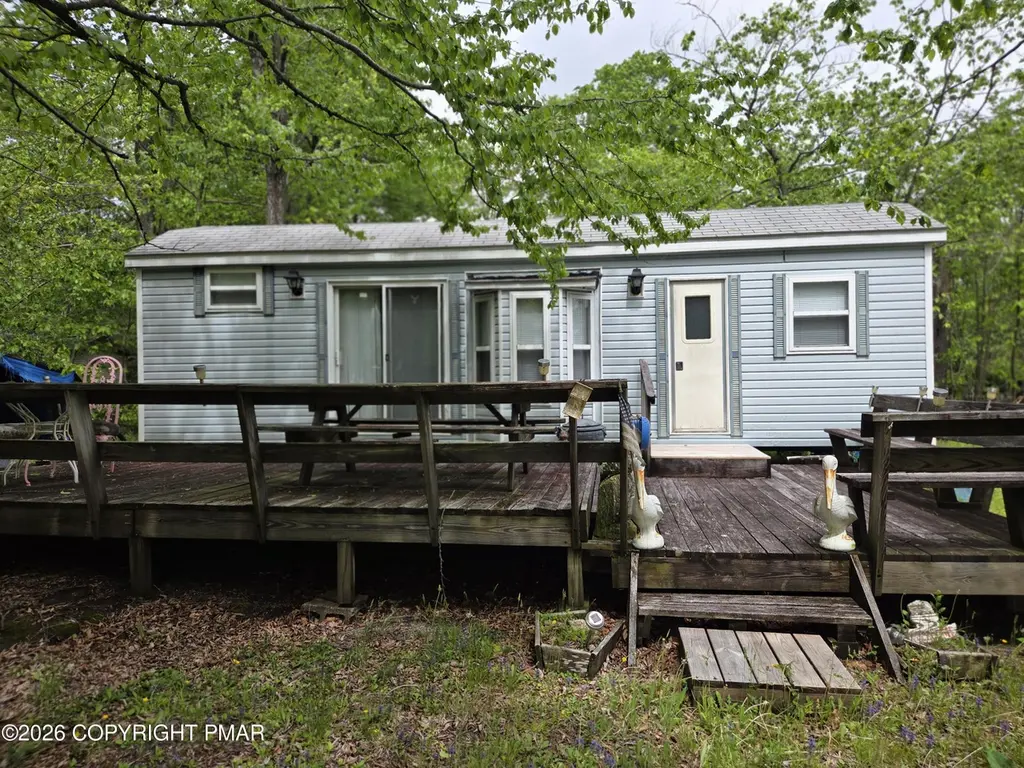
Discover this well-kept 2-bed, 1-bath park model trailer located in Glen 3 in a desirable vacation community. This sale includes three lots covered under one set of annual dues, offering extra space and flexibility that's hard to find. Community dues conveniently cover water, electric, and garbage, keeping annual costs simple and predictable. This is a vacation-use community NO FULLTIME RESIDENCE, ideal for seasonal living, weekend getaways, or a peaceful retreat. Home is being sold as is where is.
Key facts
- Three lots
- Annual dues
- 7,840 sq ft lot
Tags
Property features AI
Finance
- Other: Property is designated residential and currently used recreationally
- HOA & community: Homeowners association with annual fee (includes electricity, water, security); Community amenities include security, basketball court, and pool
Exterior
- Parking: 2 off-street gravel parking spaces (open parking)
- Security: Security gate; Security guard
- Utilities: Private water; Septic tank; 100 amp electric service
- Home design: Mobile home (Pine Ridge Inc, Cedar Ridge Elite); Attached property; Single-story; Faces east; Slider entry
- Construction: Vinyl siding; Vinyl skirt; Asbestos shingle and shingle roof; Pillar/post/pier foundation; Built as a mobile home
- Exterior features: Deck; Shed(s); Corner lot with few trees; Private gravel road access (private maintained road)
Interior
- Kitchen: Gas range; Refrigerator
- Flooring: Carpet; Linoleum
- Bathrooms: 1 full bathroom
- Heating & cooling: Forced air heating (propane); Ceiling fans; Window air conditioning units
- Interior features: Bookcases; Furnished; Storage (shed)
Neighborhood map
What this means for you Summary
Snapshot
- This is a 2-bed/1.0-bath single-family listed at $30k.
Deal economics
- At list price, monthly cash flow is $875 ($11k/yr) — positive.
- The deal already cash-flows at list — no discount required.
- Meets the 1% rule at list price ($2k rent vs $30k).
- Cap rate 41.3% vs local median 5.0% in Pocono Springs — top-decile yield for the area; either an underpriced asset or a hidden risk that comps aren't pricing in. Stress-test before assuming the spread holds.
Location & tenants
- Location reads 73/100 on livability (#560 in PA) — a middle-class / working-renter tenant base. Strengths: crime A+, employment A+, cost of living A+; Watch: schools F, amenities F, commute F.
- North Pocono SD (rural): math 45% / reading 71% proficiency, ranked #82 of 539 in PA (top 15%) — acceptable for families but not a draw, mixed tenant base, ~2y average lease.
- Market conditions: 83 active listings in the ZIP; 177 units permitted in Wayne County in 2024 (0 in 5+ unit buildings).
Forward outlook
- In year one you build about $1k of equity ($207 loan paydown + $896 appreciation (3.0% local appreciation)).
- Wayne County population projected at -17% by 2050 — secular population decline; favor cash flow + early exit over multi-decade hold.
- At projected returns (3.0% appreciation + 3.0% rent growth), your $8k cash investment doubles in ~1 year — after that, you're playing with house money.
Negotiation context
- Only 10 days on market — expect competitive offers; lowballing is unlikely to land.
- Current owner paid $7k; list at $30k implies a 355% gain — meaningful room to come down on a strong offer.
Questions for the listing agent
- What does the HOA fee cover, when was the last increase, and are there any pending special assessments or reserve-fund shortfalls?
- Is there a deadline driving the sale (1031 exchange, divorce, estate, relocation)? That informs how much negotiation room exists.
- Schools are F-rated, which usually means shorter tenancies and higher turnover. Who's the typical renter profile here, and what's been the actual vacancy rate?
- What's the average days-on-market for RENTAL listings here right now (not sales)? A rising rental-DOM trend means longer vacancies and softer asking-rent achievability than the comps imply.
- What's the recent tenant-quality profile in this submarket — average credit score on applications, eviction rate, late-payment / NSF rate, and stable-employment percentage? A property-management company in the area should have these aggregated.
- How much new for-sale + rental construction is in the pipeline within 1–3 miles? Heavy new supply typically softens prices + rents 12–24 months out; constrained supply supports both.
Investment metrics
- 1% rule
- 5.28% ✓
- Cap rate
- 41.30%
- Cash-on-cash
- 125.04%
- DSCR
- 6.56
- GRM
- 1.6
CMA / ARV
- ARV (on-the-fly)
- $37,293
- Comps found
- 1
Show comp detail 1 sale within ~0.75 mi
| Address | Dist | Beds/Ba | Sqft | Sold | Price | $/sf | Match |
|---|---|---|---|---|---|---|---|
| 30 Kechi Trl | 0.15mi | 1/1.0 (-1) | 407 (+2%) | 18mo | $38,000 | $93 | 71 |
Match score weights: distance 35% · size 25% · config 20% · recency 20%. Top-matched comps best support the ARV.
Projected returns pro-forma
2.99% appreciation · 3.0% rent growth · sell at horizon
- IRR
- —
- Equity multiple
- 8.08×
- Total profit
- $59,468
- Equity at exit
- $13,469
- IRR
- —
- Equity multiple
- 16.93×
- Total profit
- $133,781
- Equity at exit
- $20,741
Cash invested: $8,400 (down + closing). Projections, not guarantees.
Landlord ↔ Tenant lean methodology
- Overall (STATE)
- 62 Landlord-Friendly
- State Pennsylvania
- 62 Landlord-Friendly · EVEN
- County
- — inherits STATE
- City
- — inherits STATE
ZIP-level market 18445
- Home prices YoY
- 0.9%
- Active inventory
- 83
- Price-to-rent
- 1.6×
Monthly cashflow live
- Estimated rent
- $1,585 medium interval (Pro) →
- Mortgage (P&I)
- −$157
- Tax from tax record
- −$34 /mo · $410/yr
- Insurance
- −$12
- HOA
- −$173
- Vacancy / Maint / Mgmt
- −$333
- Net cashflow
- $875
Break-even live
UW: 25.0% down · 7.5% · 30yr · 1.5% tax · 5.0% vac · 8.0% maint · 8.0% mgmt
Financing live
Cash to close
- Down payment
- $7,500
- Closing costs
- $900
- Reserves months
- —
- Total cash needed
- —
Loan-product check · same deal, 3 products live
Conventional
25% down · 7.5% · 30yr
- Down + closing
- —
- Monthly P&I
- —
- Monthly cashflow
- —
- DSCR
- —
- Eligible?
- —
Personal DTI + credit; lowest rate.
DSCR
20% down · 8.5% · 30yr
- Down + closing
- —
- Monthly P&I
- —
- Monthly cashflow
- —
- DSCR
- —
- Eligible?
- —
No personal income docs; deal must DSCR.
Hard money
10% down · 12.0% · 12mo
- Down + closing
- —
- Monthly P&I
- —
- Monthly cashflow
- —
- DSCR
- —
- Eligible?
- —
Short-term bridge; refi at stabilization.
HOA detail
- Monthly dues
- $173 · $2,076/yr
- Likely covers
- watertrashelectric
Listing history 7 events
-
2026-06-07statusdays on market $29,999 Pending 10 DOM
-
2026-06-02days on market $29,999 Active 7 DOM
-
2026-06-01days on market $29,999 Active 6 DOM
-
2026-05-31days on market $29,999 Active 5 DOM
-
2026-05-30days on market $29,999 Active 4 DOM
-
2026-05-26$29,999 Active
-
1987-06-26soldstatus $6,600
ⓘ Source: listings_history table (triggers on properties + properties_extension) + one-shot
backfill from property_details.listing_events for pre-trigger history.
Tax reassessment forecast PA · Partial reset (capped growth)
- Current annual tax
- $410 · $34/mo
- Projected year-2 tax
- $442 · $37/mo
- Expected delta
- +$32/yr (+$3/mo · 7.8%)
ⓘ Screening estimate from a state-policy table — verify with the county assessor before closing.
Climate risk First Street
- Flood 1/10 Low FEMA zone X (unshaded) · 0% chance over 30 yrs
- Wildfire 1/10 Low
- Heat 1/10 Low 7 d/yr ≥88°F today · 16 d/yr by 30 yrs out
- Wind 3/10 Moderate 5% chance of damaging wind over 30 yrs
- Air quality 2/10 Low 1 unhealthy d/yr today · 2 by 30 yrs out
Nearby sold comps map
Loading sold comps map…
Walkable amenities ~0.75 mi
Loading nearby amenities…
Taxation est. · year 1
- Rental income
- $19,021
- − Mortgage interest
- −$1,680
- − Property taxes
- −$410
- − Insurance
- −$150
- − Repairs & maintenance
- −$1,522
- − Management
- −$1,522
- − HOA
- −$2,076
- − Depreciation
- −$873
- Taxable income
- $10,789
- Est. tax owed @ 24.0%
- −$2,589
- After-tax cash flow
- $7,914/yr
For passive investors: Depreciation is non-cash, so a rental often shows a tax loss while cash-flowing — sheltering income. Rental losses are passive: they offset passive income freely, and up to $25,000/yr can offset ordinary (W-2) income if you actively participate and your MAGI is under $100k (phasing out to $0 by $150k); unused losses carry forward. On sale, claimed depreciation is recaptured at up to 25%, and gains may owe capital-gains tax (a 1031 exchange can defer both). Figures are a year-1 estimate at your 24.0% rate — not tax advice; consult a CPA.
Schools (NCES district)
- District
- North Pocono SD
- NCES district ID
- 4217310
- Math proficiency
- 45% ▼ -9.00%
- Reading proficiency
- 71% ▼ -2.00%
- Median HH income
- $59,555
- Composite
- 50.23/100
- National rank
- #1894
- State rank
- #82 of 539 in PA
Livability — Pocono Springs
- Score
- 73/100
- State rank
- #560
- US rank
- #5263
Category grades
Schools grade is shown separately in the Schools card above.
Census & demographics
- Population (ZIP)
- 2,488
Population outlook (Wayne County) Hauer SSP2
- Today (2025)
- 47,924 people
- By 2030
- 46,191 · -3.6%
- By 2040
- 42,815 · -10.7%
- By 2050
- 39,873 · -16.8%
- By 2075
- 34,556 · -27.9%
- By 2100
- 28,358 · -40.8%
Race, ethnicity, and origin ACS 2023
- Neighborhood character
- Predominantly White (77%)
- Race & ethnicity
- White 77% Hispanic / Latino 13% Two or more races 9% Asian 5%
- Hispanic origin (detail)
- Mexican 4% Puerto Rican 5% Cuban 1% Dominican 2%
- Common ancestry
- Romanian 8% Iranian 2% Estonian 1%
- Foreign-born
- 7% · Canada
- Languages at home
- 84% English-only · Spanish 8% Other Asian/Pacific 3% Other Indo-European 2%
Political lean MEDSL · Wayne
- 2024 margin
- Solid R (+37.1) · D 31.1% · R 68.2%
- 2008→2024 swing
- -24.8pp toward R · 2008: -12.3pp · 2024: -37.1pp
- All cycles
- 2024: R+37.1 2020: R+33.6 2016: R+39.7 2012: R+20.9 2008: R+12.3
Not yet ingested
- Civics
- —
Market trends
- HPI YoY
- ▲ 2.99%
- Current HPI
- 349.2006
- Rent YoY
- —
- Metro
- —
- State GDP YoY
- ▲ 1.68%
- F500 in state
- 34
Industry mix (Fortune 500 HQ in PA)
| Industry | F500 HQs | Revenue |
|---|---|---|
| Healthcare | 2 | $309B |
|
||
| Insurance | 2 | $27B |
|
||
| Telecommunications / Media | 1 | $124B |
|
||
| Industrial Distribution | 1 | $22B |
|
||
| Financial Services | 1 | $20B |
|
||
| Chemicals / Materials | 1 | $18B |
|
||
Price history
+354.5% since first listed2 events — show timeline
- 2026-05-26 Listed $29,999 PMAR
- 1987-06-26 Sold (Public Records) $6,600 Public Records
Property tax history
-2.6%/yrLatest (2026): $410 · +3.3% YoY. Source: county tax records.
Cash-flow waterfall
monthlySold comps — $/sqft
last 12 mo · ≤1 miLoading sold comps…