561 NW Douglas St · Burleson, TX
Flood risk 1/10 · Minimal
- FEMA flood zone
- X (unshaded)
- Chance of flooding over 30 yrs
- 0.0%
- Est. flood insurance / yr
- $507 – $1,088
Fire risk 2/10 · Minimal
- Est. fire insurance / yr
- $1,222 – $2,270
Heat risk 7/10 · Major
- Hot days now (above 110°F)
- 7 days/yr
- Hot days in 30 yrs
- 24 days/yr
Wind risk 6/10 · Moderate
- Chance of severe wind over 30 yrs
- 27.0%
Air-quality risk 3/10 · Minor
- Unhealthy air days now
- 2 days/yr
- Unhealthy air days in 30 yrs
- 3 days/yr
Risk factors via First Street. Map © Google.
Why this score? — see what drove the B- grade
The composite is a weighted blend of 9 inputs, each scored 0–100. Each bar is that input's sub-score; the figure is the points it added to the 100-point composite (weight × sub-score).
- Cash flow +23.9/30.0
- ARV discount +15.0/15.0
- 1% rule +9.6/10.0
- DSCR +7.7/10.0
- Schools +4.0/10.0
- Livability +4.0/5.0
- Rent growth +2.9/5.0
- Condition / age +2.5/5.0
- Appreciation +0.0/10.0
$135,000
🖨 Deal sheet 📄 Offer letter ✓ Due diligence
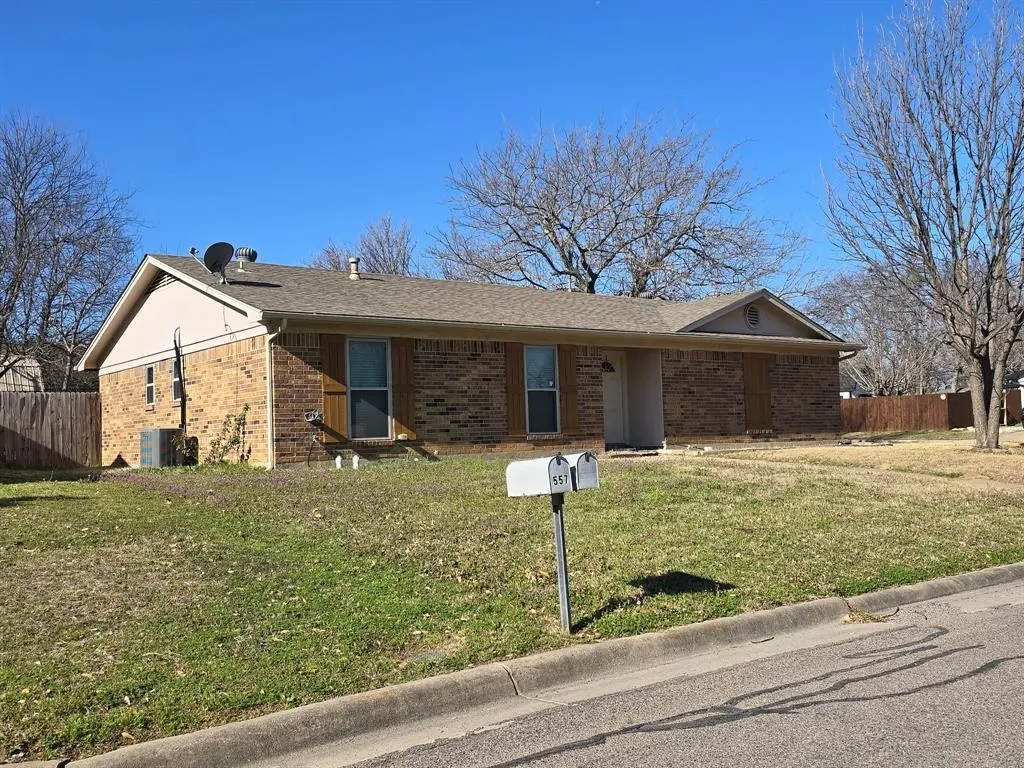
Listing remarks MLS
This home has been beautiful, and with a little TLC it can be again! Large lot with a storage shed.
Key facts
- Large lot
- Storage shed
- 8,668 sq ft lot
Tags
Neighborhood map
What this means for you Summary
Snapshot
- This is a 3-bed/2.0-bath single-family listed at $135k.
Deal economics
- At list price, monthly cash flow is $263 ($3k/yr) — positive.
- The deal already cash-flows at list — no discount required.
- Meets the 1% rule at list price ($2k rent vs $135k).
- Cap rate 8.6% vs local median 3.5% in Burleson — top-decile yield for the area; either an underpriced asset or a hidden risk that comps aren't pricing in. Stress-test before assuming the spread holds.
Location & tenants
- Location reads 79/100 on livability (#53 in TX, #2,133 nationally) — a middle-class / working-renter tenant base. Strengths: employment A+, cost of living A+, housing A+; Watch: amenities F, commute F.
- Burleson ISD (suburban): math 41% / reading 48% proficiency, ranked #236 of 826 in TX (top 29%) — families likely to look elsewhere, expect single-tenant / working-renter base with shorter leases.
- Market conditions: Rents rising (+1.8%/yr); 679 active listings in the ZIP; 38 comparable units currently listed for rent nearby; rentals at typical pace (median 25d on market — plan ~3-4 weeks tenant-placement turnaround); solid renter incomes; 18,938 units permitted in Tarrant County in 2024 (8,336 in 5+ unit buildings).
Forward outlook
- Local home prices are declining (-3.0%/yr); year-one equity from $933 of loan paydown is wiped out by about $4k of value loss. Plan a longer hold.
- Tarrant County population projected at +41% by 2050 — long-run rental-demand tailwind backs the buy-and-hold thesis.
Negotiation context
- Only 7 days on market — expect competitive offers; lowballing is unlikely to land.
- 5 sale attempts since 11y ago; this cycle's ask is 35% above the opening price — seller raised mid-cycle; expect resistance to lowballs.
Risks & watch-outs
- Watch-outs: property tax is 4.7% of price.
- Climate carrying-cost: major wind risk, 27% chance of damaging wind over 30y; extreme-heat days projected 7→24/yr by 2055 (HVAC capex compounding) — expect insurance premiums to compound above CPI over the hold.
Questions for the listing agent
- Built in 1970 — when were the roof, HVAC, electrical panel, plumbing, and water heater last replaced?
- Property tax is high relative to price — has the assessment been appealed recently, and will the sale trigger a re-assessment?
- Is there a deadline driving the sale (1031 exchange, divorce, estate, relocation)? That informs how much negotiation room exists.
- What's the average days-on-market for RENTAL listings here right now (not sales)? A rising rental-DOM trend means longer vacancies and softer asking-rent achievability than the comps imply.
- What's the recent tenant-quality profile in this submarket — average credit score on applications, eviction rate, late-payment / NSF rate, and stable-employment percentage? A property-management company in the area should have these aggregated.
- How much new for-sale + rental construction is in the pipeline within 1–3 miles? Heavy new supply typically softens prices + rents 12–24 months out; constrained supply supports both.
Investment metrics
- 1% rule
- 1.46% ✓
- Cap rate
- 8.63%
- Cash-on-cash
- 8.35%
- DSCR
- 1.37
- GRM
- 5.7
CMA / ARV
- ARV (median comp)
- $231,994
- List price
- $135,000
- Delta
- -41.81%
- Verdict
- UNDERPRICED
- Comps
- 20 within 1.0 mi
Show comp detail 12 sales within ~0.75 mi
| Address | Dist | Beds/Ba | Sqft | Sold | Price | $/sf | Match |
|---|---|---|---|---|---|---|---|
| 318 NE Michael Dr | 0.10mi | 3/2.0 | 1,206 (-5%) | 4mo | $175,000 | $145 | 84 |
| 405 Marion Ln | 0.24mi | 3/2.0 | 1,170 (-8%) | 2mo | $163,000 | $139 | 74 |
| 102 NE Murphy Rd | 0.39mi | 3/1.0 | 1,350 (+6%) | 1mo | $218,000 | $161 | 67 |
| 841 Park Meadow Ln | 0.54mi | 3/2.0 | 1,187 (-6%) | 0mo | $270,000 | $227 | 64 |
| 219 Murphy Rd | 0.64mi | 3/1.5 | 1,264 (-0%) | 6mo | $199,900 | $158 | 63 |
| 128 NW Lorna St | 0.68mi | 4/2.0 (+1) | 1,300 (+2%) | 0mo | $259,000 | $199 | 59 |
| 508 Arbor Ln | 0.59mi | 3/2.0 | 1,191 (-6%) | 4mo | $259,999 | $218 | 59 |
| 929 Meadowcrest Dr | 0.64mi | 3/2.0 | 1,352 (+7%) | 7mo | $265,000 | $196 | 53 |
| 516 Renfro St | 0.37mi | 3/1.0 | 1,100 (-13%) | 4mo | $215,000 | $195 | 53 |
| 200 SW Moody St | 0.55mi | 3/1.5 | 1,143 (-10%) | 4mo | $165,000 | $144 | 53 |
| 216 Laura Dr | 0.62mi | 3/2.0 | 1,434 (+13%) | 3mo | $279,900 | $195 | 46 |
| 709 Stonebrooke Dr | 0.69mi | 3/2.0 | 1,456 (+15%) | 2mo | $250,000 | $172 | 41 |
Match score weights: distance 35% · size 25% · config 20% · recency 20%. Top-matched comps best support the ARV.
Projected returns pro-forma
-3.0% appreciation · 1.78% rent growth · sell at horizon
- IRR
- -5.2%
- Equity multiple
- 0.81×
- Total profit
- $-7,261
- Equity at exit
- $20,129
- IRR
- 2.6%
- Equity multiple
- 1.18×
- Total profit
- $6,696
- Equity at exit
- $11,672
Cash invested: $37,800 (down + closing). Projections, not guarantees.
Landlord ↔ Tenant lean methodology
- Overall (STATE)
- 87 Strongly Landlord-Friendly
- State Texas
- 87 Strongly Landlord-Friendly · R+5
- County
- — inherits STATE
- City
- — inherits STATE
ZIP-level market 76028
- Home prices YoY
- -33.4%
- Rents YoY
- 1.8%
- Active inventory
- 679
- Price-to-rent
- 5.7×
Monthly cashflow live
- Estimated rent
- $1,974 high interval (Pro) →
- Mortgage (P&I)
- −$708
- Tax from tax record
- −$532 /mo · $6,386/yr
- Insurance
- −$56
- HOA
- −$0
- Vacancy / Maint / Mgmt
- −$415
- Net cashflow
- $263
Break-even live
UW: 25.0% down · 7.5% · 30yr · 1.5% tax · 5.0% vac · 8.0% maint · 8.0% mgmt
Financing live
Cash to close
- Down payment
- $33,750
- Closing costs
- $4,050
- Reserves months
- —
- Total cash needed
- —
Loan-product check · same deal, 3 products live
Conventional
25% down · 7.5% · 30yr
- Down + closing
- —
- Monthly P&I
- —
- Monthly cashflow
- —
- DSCR
- —
- Eligible?
- —
Personal DTI + credit; lowest rate.
DSCR
20% down · 8.5% · 30yr
- Down + closing
- —
- Monthly P&I
- —
- Monthly cashflow
- —
- DSCR
- —
- Eligible?
- —
No personal income docs; deal must DSCR.
Hard money
10% down · 12.0% · 12mo
- Down + closing
- —
- Monthly P&I
- —
- Monthly cashflow
- —
- DSCR
- —
- Eligible?
- —
Short-term bridge; refi at stabilization.
Rent comps 38 comps
| Address | Beds | Baths | Sqft | Rent | $/sqft | DOM | Units | Dist |
|---|---|---|---|---|---|---|---|---|
| 609 NW Lorna St Burleson, TX | 3.0 | 2.0 | 1381 | $1,800 | $1.30 | 43d | 1 | 0.26mi |
| 409 Oxford St Burleson, TX | 3.0 | 2.0 | 1402 | $1,995 | $1.42 | 43d | 1 | 0.26mi |
| 532 NW King St Burleson, TX | 3.0 | 1.0 | 1300 | $1,550 | $1.19 | 43d | 1 | 0.29mi |
| 109 SW Cindy Ln Burleson, TX | 3.0 | 1.0 | 1276 | $1,700 | $1.33 | 43d | 1 | 0.41mi |
| 112 SW Murphy Rd Burleson, TX | 3.0 | 2.0 | 1210 | $1,850 | $1.53 | 2d | 1 | 0.47mi |
| 344 NW Renfro St Burleson, TX | 3.0 | 1.0 | 1026 | $1,580 | $1.54 | 24d | 1 | 0.49mi |
| 517 Meadowcrest Dr Burleson, TX | 3.0 | 2.0 | 1305 | $2,050 | $1.57 | 12d | 1 | 0.68mi |
| 517 Meadowcrest Dr Burleson, TX | 3.0 | 2.0 | 1305 | $2,050 | $1.57 | 16d | 1 | 0.68mi |
| 828 Vicksburg Ln Burleson, TX | 3.0 | 2.0 | 1241 | $2,000 | $1.61 | 43d | 1 | 0.73mi |
| 900 Vicksburg Ln Burleson, TX | 4.0 | 2.0 | 1744 | $2,215 | $1.27 | 7d | 1 | 0.73mi |
| 125 NE Brushy Mound Rd Burleson, TX | 3.0 | 2.0 | 1671 | $2,200 | $1.32 | 24d | 1 | 0.80mi |
| 121 NE Brushy Mound Rd Burleson, TX | 3.0 | 2.0 | 1690 | $2,500 | $1.48 | 24d | 1 | 0.80mi |
| 1120 Highcrest Dr Burleson, TX | 3.0 | 2.0 | 1462 | $2,100 | $1.44 | 16d | 1 | 0.87mi |
| 812 Walnut St Burleson, TX | 3.0 | 2.0 | 1192 | $1,750 | $1.47 | 18d | 1 | 0.89mi |
| 905 Chestnut Ave Burleson, TX | 3.0 | 2.0 | 1855 | $2,190 | $1.18 | 43d | 1 | 0.95mi |
| 772 Hampshire Dr Burleson, TX | 3.0 | 2.0 | 1210 | $2,350 | $1.94 | 43d | 1 | 1.00mi |
| 200 Village Creek Pkwy Unit 2121 Burleson, TX | 2.0 | 2.0 | 1051 | $1,486 | $1.41 | 22d | 1 | 1.15mi |
| 200 Village Creek Pkwy Unit 257 Burleson, TX | 2.0 | 2.0 | 1051 | $1,527 | $1.45 | 12d | 1 | 1.15mi |
| 357 Coral Vine Ln Burleson, TX | 4.0 | 2.0 | 1846 | $2,400 | $1.30 | 43d | 1 | 1.18mi |
| 829 Beaver Creek Dr Burleson, TX | 4.0 | 2.0 | 1864 | $2,400 | $1.29 | 10d | 1 | 1.21mi |
| 200 Village Creek Pkwy Unit 223 Burleson, TX | 2.0 | 2.0 | 1051 | $1,645 | $1.57 | 2d | 1 | 1.21mi |
| 236 S Scott St Burleson, TX | 3.0 | 2.0 | 1250 | $1,780 | $1.42 | 12d | 1 | 1.22mi |
| 621 Barkridge Trl Burleson, TX | 3.0 | 2.0 | 1444 | $2,000 | $1.39 | 12d | 1 | 1.22mi |
| 200 Village Creek Pkwy Burleson, TX | 1.0–2.0 | 1.0–2.0 | 905 | $1,852 | $2.05 | 20d | 11 | 1.25mi |
| 444 E Renfro St Burleson, TX | 1.0–3.0 | 1.0–2.0 | 1094 | $2,250 | $2.06 | 1d | 1 | 1.26mi |
| 1412 Anna Lea Ln Burleson, TX | 3.0 | 2.0 | 1293 | $1,925 | $1.49 | 3d | 1 | 1.26mi |
| 450 E Renfro St Burleson, TX | 3.0 | 2.0 | 1413 | $2,135 | $1.51 | 43d | 1 | 1.26mi |
| 329 SE Robert St Burleson, TX | 3.0 | 1.5 | 1644 | $2,100 | $1.28 | 43d | 1 | 1.27mi |
| 329 Indian Blanket Dr Burleson, TX | 3.0 | 2.0 | 1799 | $2,100 | $1.17 | 22d | 1 | 1.29mi |
| 812 NW Summercrest Blvd Apt B Burleson, TX | 3.0 | 1.5 | 1085 | $1,450 | $1.34 | 24d | 1 | 1.30mi |
| 12733 Seton Ln Burleson, TX | 2.0 | 1.0–2.0 | 687 | $1,549 | $2.25 | 2d | 13 | 1.32mi |
| NW Summercrest Blvd Burleson, TX | 3.0 | 1.5 | 1085 | $1,450 | $1.34 | 24d | 1 | 1.32mi |
| 12605 Vantage Pkwy Burleson, TX | 1.0–2.0 | 1.0–2.0 | 800 | $2,023 | $2.53 | 15d | 1 | 1.42mi |
| 812 Sierra Cir Burleson, TX | 4.0 | 2.0 | 1818 | $2,300 | $1.27 | 43d | 1 | 1.42mi |
| 105 SE Gardens Blvd Apt 112 Burleson, TX | 2.0 | 1.5 | 1019 | $1,425 | $1.40 | 7d | 1 | 1.42mi |
| 105 SE Gardens Blvd Apt 108 Burleson, TX | 2.0 | 1.5 | 1019 | $1,425 | $1.40 | 24d | 1 | 1.43mi |
| 207 Stefanie St Burleson, TX | 3.0 | 2.0 | 1145 | $1,695 | $1.48 | 24d | 1 | 1.43mi |
| 716 SW Sunset Ln Burleson, TX | 3.0 | 1.0 | 1018 | $1,725 | $1.69 | 43d | 1 | 1.46mi |
Listing history 21 events
-
2026-05-06status Pending 100-char remark
Show marketing remark (100 chars)
This home has been beautiful, and with a little TLC it can be again! Large lot with a storage shed.
-
2026-05-02price $135,000 100-char remark
Show marketing remark (100 chars)
This home has been beautiful, and with a little TLC it can be again! Large lot with a storage shed.
-
2026-05-01status Active 100-char remark
Show marketing remark (100 chars)
This home has been beautiful, and with a little TLC it can be again! Large lot with a storage shed.
-
2026-03-02status Pending 100-char remark
Show marketing remark (100 chars)
This home has been beautiful, and with a little TLC it can be again! Large lot with a storage shed.
-
2026-02-27$100,000 Active 100-char remark
Show marketing remark (100 chars)
This home has been beautiful, and with a little TLC it can be again! Large lot with a storage shed.
-
2018-06-20soldstatus
-
2018-06-14soldstatus Sold 395-char remark
Show marketing remark (395 chars)
MOVE IN READY!!! IMMACULATE!!! 3-2-2 Home On A Large Corner Lot! Side Entry 2 Car Garage. Privacy Fence With Gate On The Side. Big Covered Patio With Ceiling Fan. Landscaped. Roomy Shed With Electricity. Extra Room Used As A Dining Room. Stainless Steeel Appliances. Ceiling Fans Throughout. New Windows. Blinds, Curtain Rods and Curtains Stay. VERY WELL KEPT!!! COME SEE IT TODAY!!
-
2018-05-24status Pending 395-char remark
Show marketing remark (395 chars)
MOVE IN READY!!! IMMACULATE!!! 3-2-2 Home On A Large Corner Lot! Side Entry 2 Car Garage. Privacy Fence With Gate On The Side. Big Covered Patio With Ceiling Fan. Landscaped. Roomy Shed With Electricity. Extra Room Used As A Dining Room. Stainless Steeel Appliances. Ceiling Fans Throughout. New Windows. Blinds, Curtain Rods and Curtains Stay. VERY WELL KEPT!!! COME SEE IT TODAY!!
-
2018-05-17historical Active Option Contract 395-char remark
Show marketing remark (395 chars)
MOVE IN READY!!! IMMACULATE!!! 3-2-2 Home On A Large Corner Lot! Side Entry 2 Car Garage. Privacy Fence With Gate On The Side. Big Covered Patio With Ceiling Fan. Landscaped. Roomy Shed With Electricity. Extra Room Used As A Dining Room. Stainless Steeel Appliances. Ceiling Fans Throughout. New Windows. Blinds, Curtain Rods and Curtains Stay. VERY WELL KEPT!!! COME SEE IT TODAY!!
-
2018-05-11$170,000 Active 395-char remark
Show marketing remark (395 chars)
MOVE IN READY!!! IMMACULATE!!! 3-2-2 Home On A Large Corner Lot! Side Entry 2 Car Garage. Privacy Fence With Gate On The Side. Big Covered Patio With Ceiling Fan. Landscaped. Roomy Shed With Electricity. Extra Room Used As A Dining Room. Stainless Steeel Appliances. Ceiling Fans Throughout. New Windows. Blinds, Curtain Rods and Curtains Stay. VERY WELL KEPT!!! COME SEE IT TODAY!!
-
2016-02-10soldstatus Sold
-
2016-02-09soldstatus
-
2016-02-03status Pending
-
2016-01-06historical Active Option Contract
-
2015-12-12status Pending
-
2015-12-02historical Active Option Contract
-
2015-11-28$116,500 Active
-
2015-08-20soldstatus
-
2015-08-18soldstatus Sold
-
2015-08-12status Pending
-
2015-08-10$60,000 Active
ⓘ Source: listings_history table (triggers on properties + properties_extension) + one-shot
backfill from property_details.listing_events for pre-trigger history.
Tax reassessment forecast TX · Resets to sale price
- Current annual tax
- $6,386 · $532/mo
- Projected year-2 tax
- $6,386 · $532/mo
- Expected delta
- $0/yr ($0/mo · 0.0%)
ⓘ Screening estimate from a state-policy table — verify with the county assessor before closing.
Climate risk First Street
- Flood 1/10 Low FEMA zone X (unshaded) · 0% chance over 30 yrs
- Wildfire 2/10 Low
- Heat 7/10 Severe 7 d/yr ≥110°F today · 24 d/yr by 30 yrs out
- Wind 6/10 Major 27% chance of damaging wind over 30 yrs
- Air quality 3/10 Moderate 2 unhealthy d/yr today · 3 by 30 yrs out
Nearby sold comps map
Loading sold comps map…
Walkable amenities ~0.75 mi
Loading nearby amenities…
Taxation est. · year 1
- Rental income
- $23,688
- − Mortgage interest
- −$7,562
- − Property taxes
- −$6,386
- − Insurance
- −$675
- − Repairs & maintenance
- −$1,895
- − Management
- −$1,895
- − Depreciation
- −$3,927
- Taxable income
- $1,348
- Est. tax owed @ 24.0%
- −$323
- After-tax cash flow
- $2,834/yr
For passive investors: Depreciation is non-cash, so a rental often shows a tax loss while cash-flowing — sheltering income. Rental losses are passive: they offset passive income freely, and up to $25,000/yr can offset ordinary (W-2) income if you actively participate and your MAGI is under $100k (phasing out to $0 by $150k); unused losses carry forward. On sale, claimed depreciation is recaptured at up to 25%, and gains may owe capital-gains tax (a 1031 exchange can defer both). Figures are a year-1 estimate at your 24.0% rate — not tax advice; consult a CPA.
Schools (NCES district)
- District
- Burleson ISD
- NCES district ID
- 4812180
- Math proficiency
- 41% ▼ -8.00%
- Reading proficiency
- 48% ▼ -3.00%
- Median HH income
- $69,349
- Composite
- 40.05/100
- National rank
- #3818
- State rank
- #236 of 826 in TX
Livability — Burleson
- Score
- 79/100
- State rank
- #53
- US rank
- #2133
Category grades
Schools grade is shown separately in the Schools card above.
Census & demographics
- Census place
- Burleson, TX
- County
- Johnson County · 147,987 people
- City population
- 81,549
- Metro
- Dallas-Fort Worth-Arlington, TX
- Population (ZIP)
- 81,549
- Household income
- $101,138
- Rent vs Own
- Severe rent burden
- 1117.0
Population outlook (Tarrant County) Hauer SSP2
- Today (2025)
- 2,380,417 people
- By 2030
- 2,578,900 · +8.3%
- By 2040
- 2,974,995 · +25.0%
- By 2050
- 3,350,489 · +40.8%
- By 2075
- 4,216,909 · +77.2%
- By 2100
- 4,741,527 · +99.2%
Race, ethnicity, and origin ACS 2023
- Neighborhood character
- Predominantly White (69%)
- Race & ethnicity
- White 69% Hispanic / Latino 19% Two or more races 11% Black 6% Asian 1%
- Hispanic origin (detail)
- Mexican 17%
- Common ancestry
- Lithuanian 2% Italian 2% Slovak 2%
- Foreign-born
- 5% · Canada
- Languages at home
- 88% English-only · Spanish 10% Other Indo-European 1%
Political lean MEDSL · Tarrant
- 2024 margin
- Lean R (+5.1) · D 46.7% · R 51.9% · Other 1.4%
- 2008→2024 swing
- +6.6pp toward D · 2008: -11.7pp · 2024: -5.1pp
- All cycles
- 2024: R+5.1 2020: D+0.2 2016: R+8.7 2012: R+15.7 2008: R+11.7
Not yet ingested
- Civics
- —
Market trends
- HPI YoY
- ▼ -141.44%
- Current HPI
- 282.466
- Rent YoY
- ▲ 1.78%
- Metro
- Dallas-Fort Worth-Arlington, TX
- State GDP YoY
- ▲ 3.95%
- F500 in state
- 110
Industry mix (Fortune 500 HQ in TX)
| Industry | F500 HQs | Revenue |
|---|---|---|
| Energy | 16 | $1,198B |
|
||
| Technology | 5 | $198B |
|
||
| Engineering / Construction | 4 | $72B |
|
||
| Energy Services | 3 | $60B |
|
||
| Utilities | 3 | $41B |
|
||
| Healthcare | 2 | $330B |
|
||
Price history
+125.0% since first listed21 events — show timeline
- 2026-05-06 Pending — NTREIS
- 2026-05-02 Price Changed $135,000 NTREIS
- 2026-05-01 Relisted — NTREIS
- 2026-03-02 Pending — NTREIS
- 2026-02-27 Listed $100,000 NTREIS
- 2018-06-20 Sold (Public Records) — Public Records
- 2018-06-14 Sold (MLS) — NTREIS
- 2018-05-24 Pending — NTREIS
- 2018-05-17 Contingent — NTREIS
- 2018-05-11 Listed $170,000 NTREIS
- 2016-02-10 Sold (MLS) — NTREIS
- 2016-02-09 Sold (Public Records) — Public Records
- 2016-02-03 Pending — NTREIS
- 2016-01-06 Contingent — NTREIS
- 2015-12-12 Pending — NTREIS
- 2015-12-02 Contingent — NTREIS
- 2015-11-28 Listed $116,500 NTREIS
- 2015-08-20 Sold (Public Records) — Public Records
- 2015-08-18 Sold (MLS) — NTREIS
- 2015-08-12 Pending — NTREIS
- 2015-08-10 Listed $60,000 NTREIS
Property tax history
+7.2%/yrLatest (2025): $6,386 · +1.7% YoY. Source: county tax records.
Cash-flow waterfall
monthlySold comps — $/sqft
last 12 mo · ≤1 miLoading sold comps…