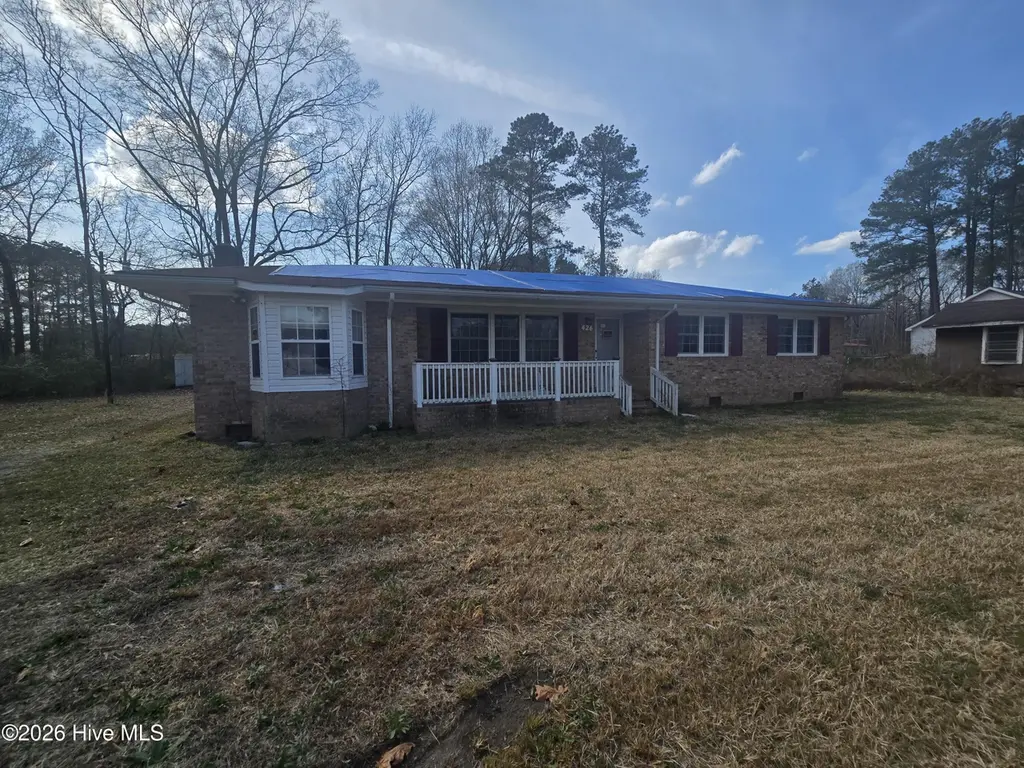
426 Boone Farm Rd · Ahoskie, NC
Flood risk 1/10 · Minimal
- FEMA flood zone
- X (unshaded)
- Chance of flooding over 30 yrs
- 0.0%
- Est. flood insurance / yr
- $507 – $1,088
Fire risk 4/10 · Minor
- Est. fire insurance / yr
- $906 – $1,684
Heat risk 8/10 · Major
- Hot days now (above 106°F)
- 7 days/yr
- Hot days in 30 yrs
- 16 days/yr
Wind risk 8/10 · Major
- Chance of severe wind over 30 yrs
- 80.0%
Air-quality risk 1/10 · Minimal
- Unhealthy air days now
- 0 days/yr
- Unhealthy air days in 30 yrs
- 0 days/yr
Risk factors via First Street. Map © Google.
Why this score? — see what drove the B grade
The composite is a weighted blend of 9 inputs, each scored 0–100. Each bar is that input's sub-score; the figure is the points it added to the 100-point composite (weight × sub-score).
- Cash flow +30.0/30.0
- 1% rule +10.0/10.0
- DSCR +10.0/10.0
- ARV discount +7.5/15.0
- Appreciation +6.3/10.0
- Livability +2.9/5.0
- Rent growth +2.5/5.0
- Condition / age +2.5/5.0
- Schools +1.6/10.0
$85,000
🖨 Deal sheet 📄 Offer letter ✓ Due diligence
Listing remarks
Home is ready to put your touch on. Home features a sitting and living area with a finished enclosed garage with half bath. Deck off the back.
Key facts
- 0.82 acre lot
- Built 1978
- Listed 83 days
Property features AI
Finance
- Other: Zoning: RA-30
Exterior
- Parking: Unpaved parking
- Utilities: Septic tank sewer; Other water source; Other utilities
- Home design: Single-family residence; One level / 1 story; Residential property; Irregular lot shape
- Construction: Brick veneer, vinyl siding, and frame construction; Shingle roof; Built with crawl space foundation
- Exterior features: Deck; Outbuilding; Has a view; Paved road access
Interior
- Kitchen: Refrigerator
- Bedrooms: Total of 7 rooms (bedroom count not specified)
- Flooring: Tile; Vinyl; Wood
- Bathrooms: 2 full bathrooms; 1 half bathroom
- Heating & cooling: Propane heating; Other heating; Has cooling (type: Other)
- Interior features: Ceiling fan(s); Unfurnished; Crawl space basement (no full basement)
- Laundry & utility: Washer hookup; Electric water heater
Neighborhood map
What this means for you Summary
Snapshot
- This is a 3-bed/2.5-bath single-family listed at $85k.
Deal economics
- At list price, monthly cash flow is $773 ($9k/yr) — positive.
- The deal already cash-flows at list — no discount required.
- Meets the 1% rule at list price ($2k rent vs $85k).
- Recommended offer: $80k (6.0% below list) — sets the bar for market timing.
- Cap rate 17.2% vs local median 7.7% in Ahoskie — top-decile yield for the area; either an underpriced asset or a hidden risk that comps aren't pricing in. Stress-test before assuming the spread holds.
Location & tenants
- Location reads 57/100 on livability (#600 in NC) — a working-class tenant base; expect higher turnover. Strengths: cost of living A+, health & safety A+, housing B+; Watch: crime F, amenities F, commute F.
- Hertford County Schools (town): math 14% / reading 26% proficiency, ranked #171 of 178 in NC (top 96%) — low school quality limits family demand, transient renter base, plan for 1-2y turnover; 74% free/reduced lunch — lower-income household profile, screen leases tightly.
- Zoned schools: Hertford County Middle (math 6% / reading 26%, grade F, #455 of 475 statewide, top 96%, 536 students, 99% FRL); Hertford Co Early College (math 74% / reading 74%, grade B+, #92 of 535 statewide, top 18%, 172 students, 98% FRL) — zoned schools average 99% FRL vs 74% district-wide (25 pts higher); higher-poverty schools than district average — tighter screening recommended.
- Zoned-school proficiency averages 45% at this address vs 20% district-wide (+25 pts) — the actual schools serving this property are materially stronger than the Hertford County Schools average implies; a family-tenant draw the district grade alone would hide.
- Market conditions: 59 active listings in the ZIP; 5 units permitted in Hertford County in 2024 (0 in 5+ unit buildings).
Forward outlook
- In year one you build about $3k of equity ($588 loan paydown + $2k appreciation (2.5% local appreciation)).
- Hertford County population projected at -15% by 2050 — secular population decline; favor cash flow + early exit over multi-decade hold.
- At projected returns (2.5% appreciation + 3.0% rent growth), your $24k cash investment doubles in ~2 years — after that, you're playing with house money.
Negotiation context
- It's been on market 84 days — a 6% lower offer ($80k) is reasonable based on typical stale-listing flexibility.
- 2 sale attempts since 3y ago; this cycle's ask has dropped $10k (11%) from the opening price — seller is motivated, your offer sets the floor, not the list.
Risks & watch-outs
- Climate carrying-cost: severe wind risk, 80% chance of damaging wind over 30y; extreme-heat days projected 7→16/yr by 2055 (HVAC capex compounding) — expect insurance premiums to compound above CPI over the hold.
Questions for the listing agent
- It's been on market 84 days. Have you received any prior offers? Is the seller open to a 6% concession, seller financing, or rate buy-down credit?
- Built in 1978 — when were the roof, HVAC, electrical panel, plumbing, and water heater last replaced?
- Why hasn't it sold? Are there any deal-killer items the seller is aware of (foundation, flood, title, zoning, code violations)?
- Is there a deadline driving the sale (1031 exchange, divorce, estate, relocation)? That informs how much negotiation room exists.
- Schools are F-rated, which usually means shorter tenancies and higher turnover. Who's the typical renter profile here, and what's been the actual vacancy rate?
- Crime grade is F in this area — have there been break-ins, vandalism, or insurance claims at this property in the last 3 years? What carrier currently insures it and at what premium?
- What's the average days-on-market for RENTAL listings here right now (not sales)? A rising rental-DOM trend means longer vacancies and softer asking-rent achievability than the comps imply.
- What's the recent tenant-quality profile in this submarket — average credit score on applications, eviction rate, late-payment / NSF rate, and stable-employment percentage? A property-management company in the area should have these aggregated.
- How much new for-sale + rental construction is in the pipeline within 1–3 miles? Heavy new supply typically softens prices + rents 12–24 months out; constrained supply supports both.
Investment metrics
- 1% rule
- 2.00% ✓
- Cap rate
- 17.20%
- Cash-on-cash
- 38.97%
- DSCR
- 2.73
- GRM
- 4.2
CMA / ARV
- ARV (on-the-fly)
- $44,520
- Comps found
- 2
Show comp detail 2 sales within ~0.75 mi
| Address | Dist | Beds/Ba | Sqft | Sold | Price | $/sf | Match |
|---|---|---|---|---|---|---|---|
| 849 Nc-461 | 0.22mi | 3/1.0 | 1,102 (-13%) | 6mo | $30,000 | $27 | 56 |
| 832 Nc 461 | 0.09mi | 3/2.0 | 1,450 (+14%) | 24mo | $51,000 | $35 | 51 |
Match score weights: distance 35% · size 25% · config 20% · recency 20%. Top-matched comps best support the ARV.
Projected returns pro-forma
2.52% appreciation · 3.0% rent growth · sell at horizon
- IRR
- 43.8%
- Equity multiple
- 3.41×
- Total profit
- $57,346
- Equity at exit
- $35,950
- IRR
- 44.1%
- Equity multiple
- 6.79×
- Total profit
- $137,903
- Equity at exit
- $53,699
Cash invested: $23,800 (down + closing). Projections, not guarantees.
Landlord ↔ Tenant lean methodology
- Overall (STATE)
- 85 Strongly Landlord-Friendly
- State North Carolina
- 85 Strongly Landlord-Friendly · R+3
- County
- — inherits STATE
- City
- — inherits STATE
ZIP-level market 27910
- Home prices YoY
- 1.9%
- Active inventory
- 59
- Price-to-rent
- 4.2×
Monthly cashflow live
- Estimated rent
- $1,703 medium interval (Pro) →
- Mortgage (P&I)
- −$446
- Tax from tax record
- −$91 /mo · $1,096/yr
- Insurance
- −$35
- HOA
- −$0
- Vacancy / Maint / Mgmt
- −$358
- Net cashflow
- $773
Break-even live
UW: 25.0% down · 7.5% · 30yr · 1.5% tax · 5.0% vac · 8.0% maint · 8.0% mgmt
Financing live
Cash to close
- Down payment
- $21,250
- Closing costs
- $2,550
- Reserves months
- —
- Total cash needed
- —
Loan-product check · same deal, 3 products live
Conventional
25% down · 7.5% · 30yr
- Down + closing
- —
- Monthly P&I
- —
- Monthly cashflow
- —
- DSCR
- —
- Eligible?
- —
Personal DTI + credit; lowest rate.
DSCR
20% down · 8.5% · 30yr
- Down + closing
- —
- Monthly P&I
- —
- Monthly cashflow
- —
- DSCR
- —
- Eligible?
- —
No personal income docs; deal must DSCR.
Hard money
10% down · 12.0% · 12mo
- Down + closing
- —
- Monthly P&I
- —
- Monthly cashflow
- —
- DSCR
- —
- Eligible?
- —
Short-term bridge; refi at stabilization.
Listing history 22 events
-
2026-06-18days on market $85,000 Active 84 DOM
-
2026-06-17days on market $85,000 Active 83 DOM
-
2026-06-16days on market $85,000 Active 82 DOM
-
2026-06-15days on market $85,000 Active 81 DOM
-
2026-06-13days on market $85,000 Active 79 DOM
-
2026-06-12days on market $85,000 Active 78 DOM
-
2026-06-09days on market $85,000 Active 75 DOM
-
2026-06-09price $85,000 Active 74 DOM
-
2026-06-08days on market $90,000 Active 74 DOM
-
2026-06-07days on market $90,000 Active 73 DOM
-
2026-06-07days on market $90,000 Active 72 DOM
-
2026-06-04days on market $90,000 Active 69 DOM
-
2026-06-02days on market $90,000 Active 68 DOM
-
2026-06-01days on market $90,000 Active 67 DOM
-
2026-05-31days on market $90,000 Active 66 DOM
-
2026-05-07price $90,000
-
2026-03-25$95,000 Active
-
2024-01-09historical
-
2023-08-25price $90,000
-
2023-07-05price $129,900
-
2023-06-12price $139,900
-
2023-05-08$149,900 Active
ⓘ Source: listings_history table (triggers on properties + properties_extension) + one-shot
backfill from property_details.listing_events for pre-trigger history.
Tax reassessment forecast NC · Resets to sale price
- Current annual tax
- $1,096 · $91/mo
- Projected year-2 tax
- $1,096 · $91/mo
- Expected delta
- $0/yr ($0/mo · 0.0%)
ⓘ Screening estimate from a state-policy table — verify with the county assessor before closing.
Climate risk First Street
- Flood 1/10 Low FEMA zone X (unshaded) · 0% chance over 30 yrs
- Wildfire 4/10 Moderate
- Heat 8/10 Severe 7 d/yr ≥106°F today · 16 d/yr by 30 yrs out
- Wind 8/10 Severe 80% chance of damaging wind over 30 yrs
- Air quality 1/10 Low 0 unhealthy d/yr today · 0 by 30 yrs out
Nearby sold comps map
Loading sold comps map…
Walkable amenities ~0.75 mi
Loading nearby amenities…
Taxation est. · year 1
- Rental income
- $20,436
- − Mortgage interest
- −$4,761
- − Property taxes
- −$1,096
- − Insurance
- −$425
- − Repairs & maintenance
- −$1,635
- − Management
- −$1,635
- − Depreciation
- −$2,473
- Taxable income
- $8,411
- Est. tax owed @ 24.0%
- −$2,019
- After-tax cash flow
- $7,256/yr
For passive investors: Depreciation is non-cash, so a rental often shows a tax loss while cash-flowing — sheltering income. Rental losses are passive: they offset passive income freely, and up to $25,000/yr can offset ordinary (W-2) income if you actively participate and your MAGI is under $100k (phasing out to $0 by $150k); unused losses carry forward. On sale, claimed depreciation is recaptured at up to 25%, and gains may owe capital-gains tax (a 1031 exchange can defer both). Figures are a year-1 estimate at your 24.0% rate — not tax advice; consult a CPA.
Schools (NCES district)
- District
- Hertford County Schools
- NCES district ID
- 3702160
- Math proficiency
- 14% ▼ -3.00%
- Reading proficiency
- 26% ▼ -1.00%
- Median HH income
- $33,467
- Composite
- 16.29/100
- National rank
- #9213
- State rank
- #171 of 178 in NC
Livability — Ahoskie
- Score
- 57/100
- State rank
- #600
- US rank
- #21815
Category grades
Schools grade is shown separately in the Schools card above.
Census & demographics
- City population
- 10,427
- Population (ZIP)
- 10,427
Population outlook (Hertford County) Hauer SSP2
- Today (2025)
- 23,401 people
- By 2030
- 22,708 · -3.0%
- By 2040
- 21,227 · -9.3%
- By 2050
- 19,942 · -14.8%
- By 2075
- 17,844 · -23.7%
- By 2100
- 15,148 · -35.3%
Race, ethnicity, and origin ACS 2023
- Neighborhood character
- Diverse neighborhood (Simpson 0.55)
- Race & ethnicity
- Black 59% White 32% Hispanic / Latino 4% Two or more races 3% Native American 2% Asian 1%
- Common ancestry
- Serbian 1% Slovak 1%
- Foreign-born
- 3% · Canada, Philippines
- Languages at home
- 96% English-only · Spanish 3% Other Asian/Pacific 1%
Political lean MEDSL · Hertford
- 2024 margin
- Strong D (+26.8) · D 63.0% · R 36.3%
- 2008→2024 swing
- -14.8pp toward R · 2008: 41.5pp · 2024: 26.8pp
- All cycles
- 2024: D+26.8 2020: D+34.0 2016: D+37.7 2012: D+44.3 2008: D+41.5
Not yet ingested
- Civics
- —
Market trends
- HPI YoY
- ▲ 2.52%
- Current HPI
- 135.494
- Rent YoY
- —
- Metro
- —
- State GDP YoY
- ▲ 3.28%
- F500 in state
- 26
Industry mix (Fortune 500 HQ in NC)
| Industry | F500 HQs | Revenue |
|---|---|---|
| Financial Services | 2 | $213B |
|
||
| Retail | 2 | $95B |
|
||
| Industrial Conglomerate | 1 | $38B |
|
||
| Metals / Steel | 1 | $35B |
|
||
| Utilities | 1 | $30B |
|
||
| Industrial Machinery | 1 | $19B |
|
||
Price history
-40.0% since first listed7 events — show timeline
- 2026-05-07 Price Changed $90,000 Hive MLS
- 2026-03-25 Listed $95,000 Hive MLS
- 2024-01-09 Listing Removed — Hive MLS
- 2023-08-25 Price Changed $90,000 Hive MLS
- 2023-07-05 Price Changed $129,900 Hive MLS
- 2023-06-12 Price Changed $139,900 Hive MLS
- 2023-05-08 Listed $149,900 Hive MLS
Property tax history
+5.6%/yrLatest (2025): $1,096 · +60.2% YoY. Source: county tax records.
Cash-flow waterfall
monthlySold comps — $/sqft
last 12 mo · ≤1 miLoading sold comps…